


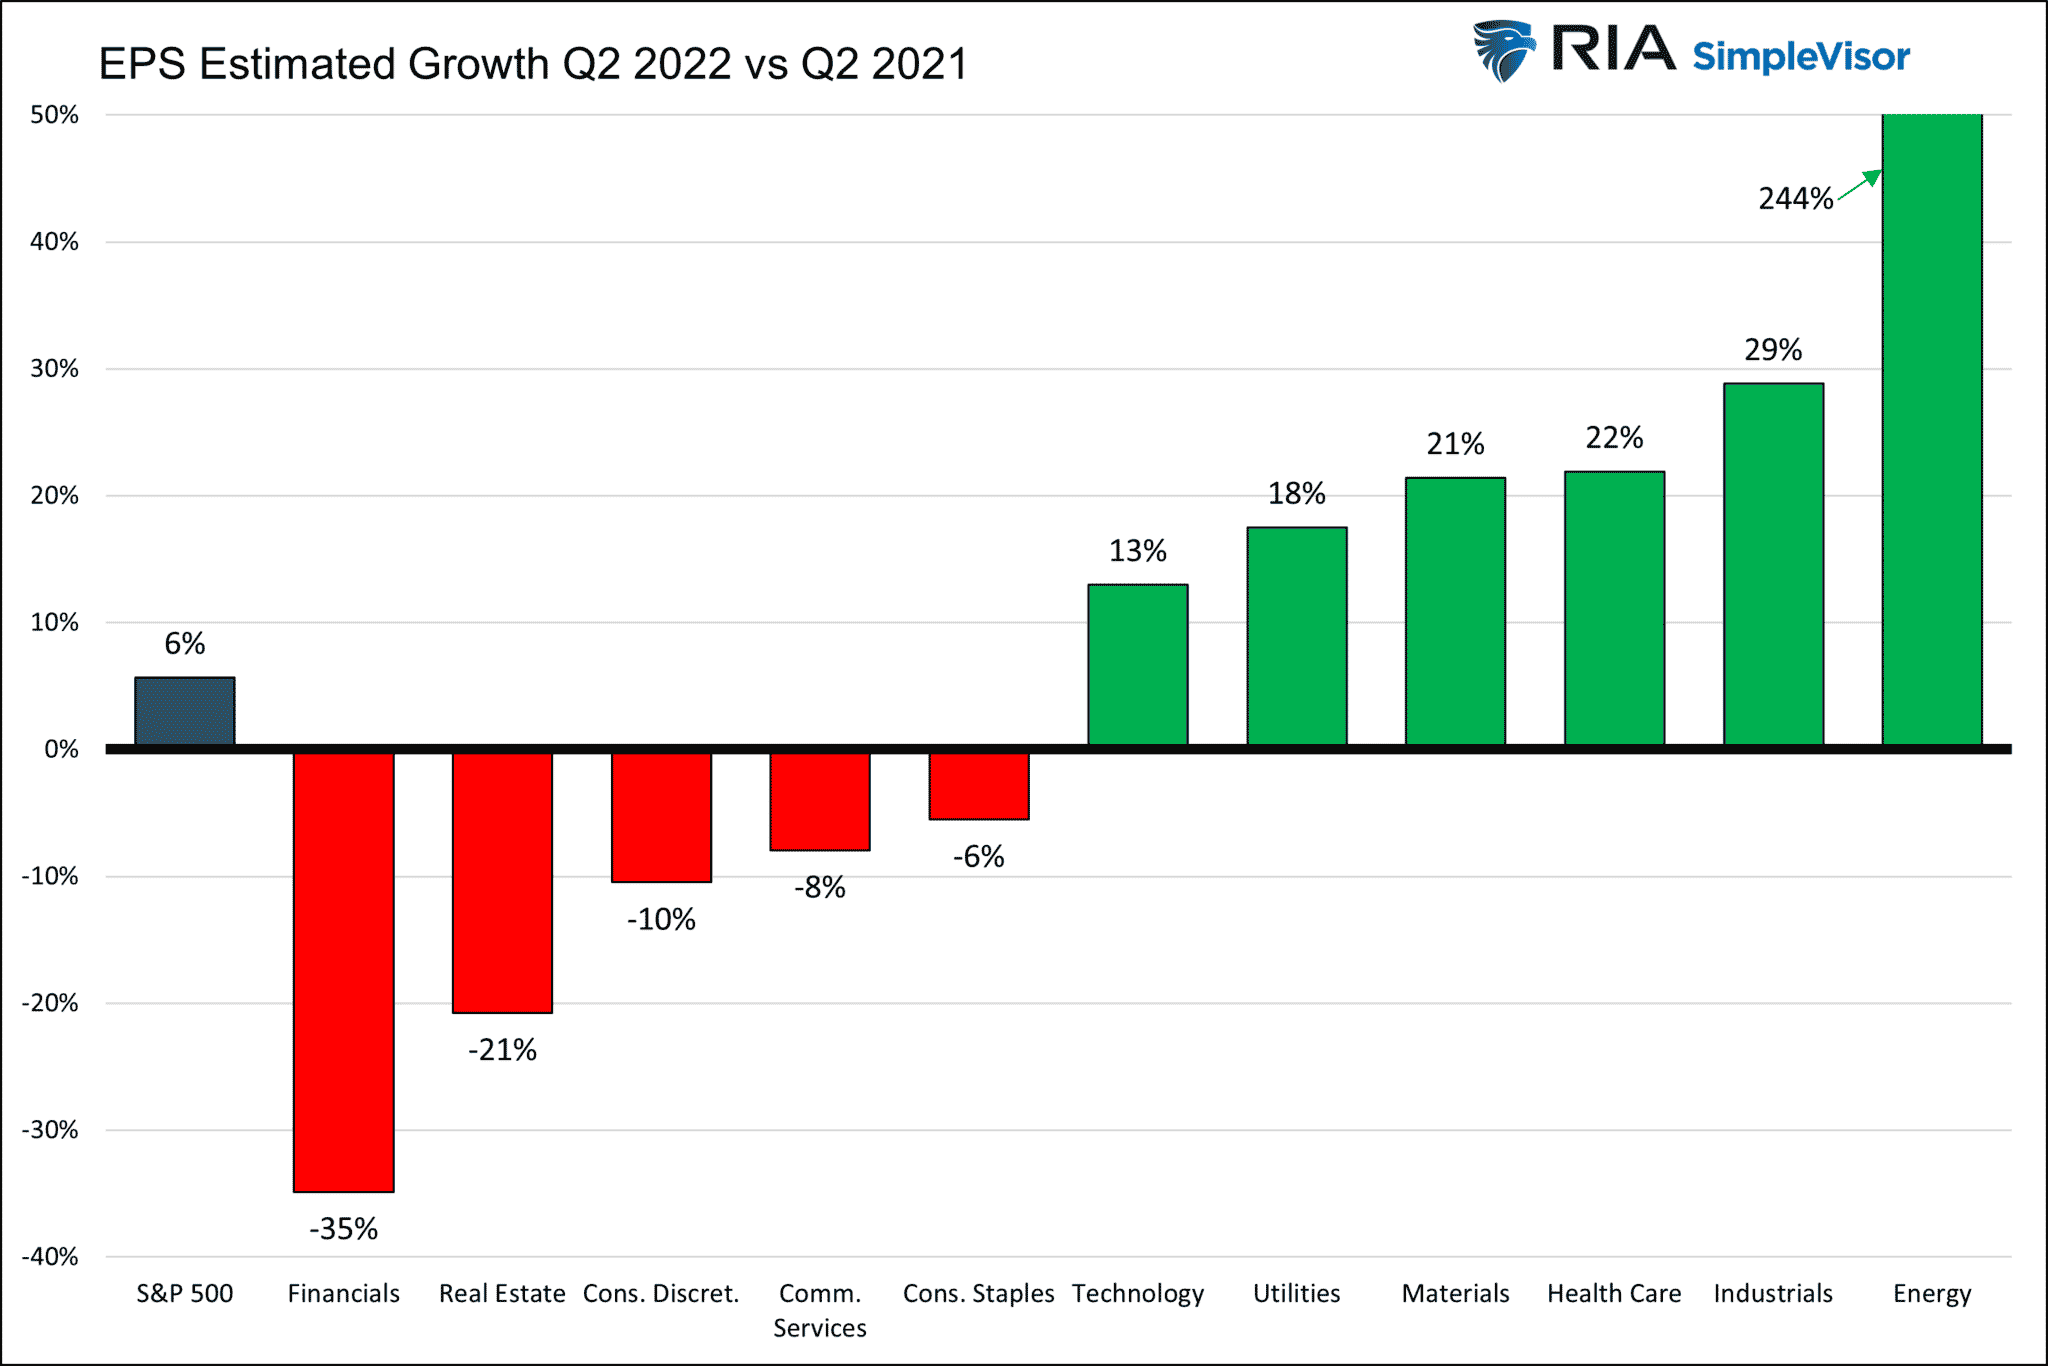
Earnings season starts next week, with banks and airlines leading the way. Last earnings season (Q1), S&P 500 operating EPS grew by 4.10% year over year. This quarter S&P Global estimates 5.7% EPS growth. The prior and estimate are impressive considering GDP growth was negative in Q1 and likely will be flat to negative again in Q2. It appears that companies, in aggregate, were able to pass on higher costs to consumers in the first quarter. Will that again be the case in this coming earnings season? The 5.7% estimate must assume as much. To help guide our expectations, we provide the chart below. It breaks down this quarter’s forecasts by sector. Not surprisingly, the energy sector is expecting massive EPS growth. Conversely, the sectors that deal more directly with people are expected to see earnings growth slide. For more on earnings, check out our weekly Newsletter- Earnings at Risk.

What To Watch Today
Economy
- No major data set for release.
Earnings
- No major reports set for release.
Market Trading Update
The message has remained consistent for this year to “sell rallies” and “raise cash.” But even with markets deeply oversold, bounces remain short-lived. As noted last week, we suspected a rally was likely given the deep oversold condition and the MACD “buy signal” (top panel).
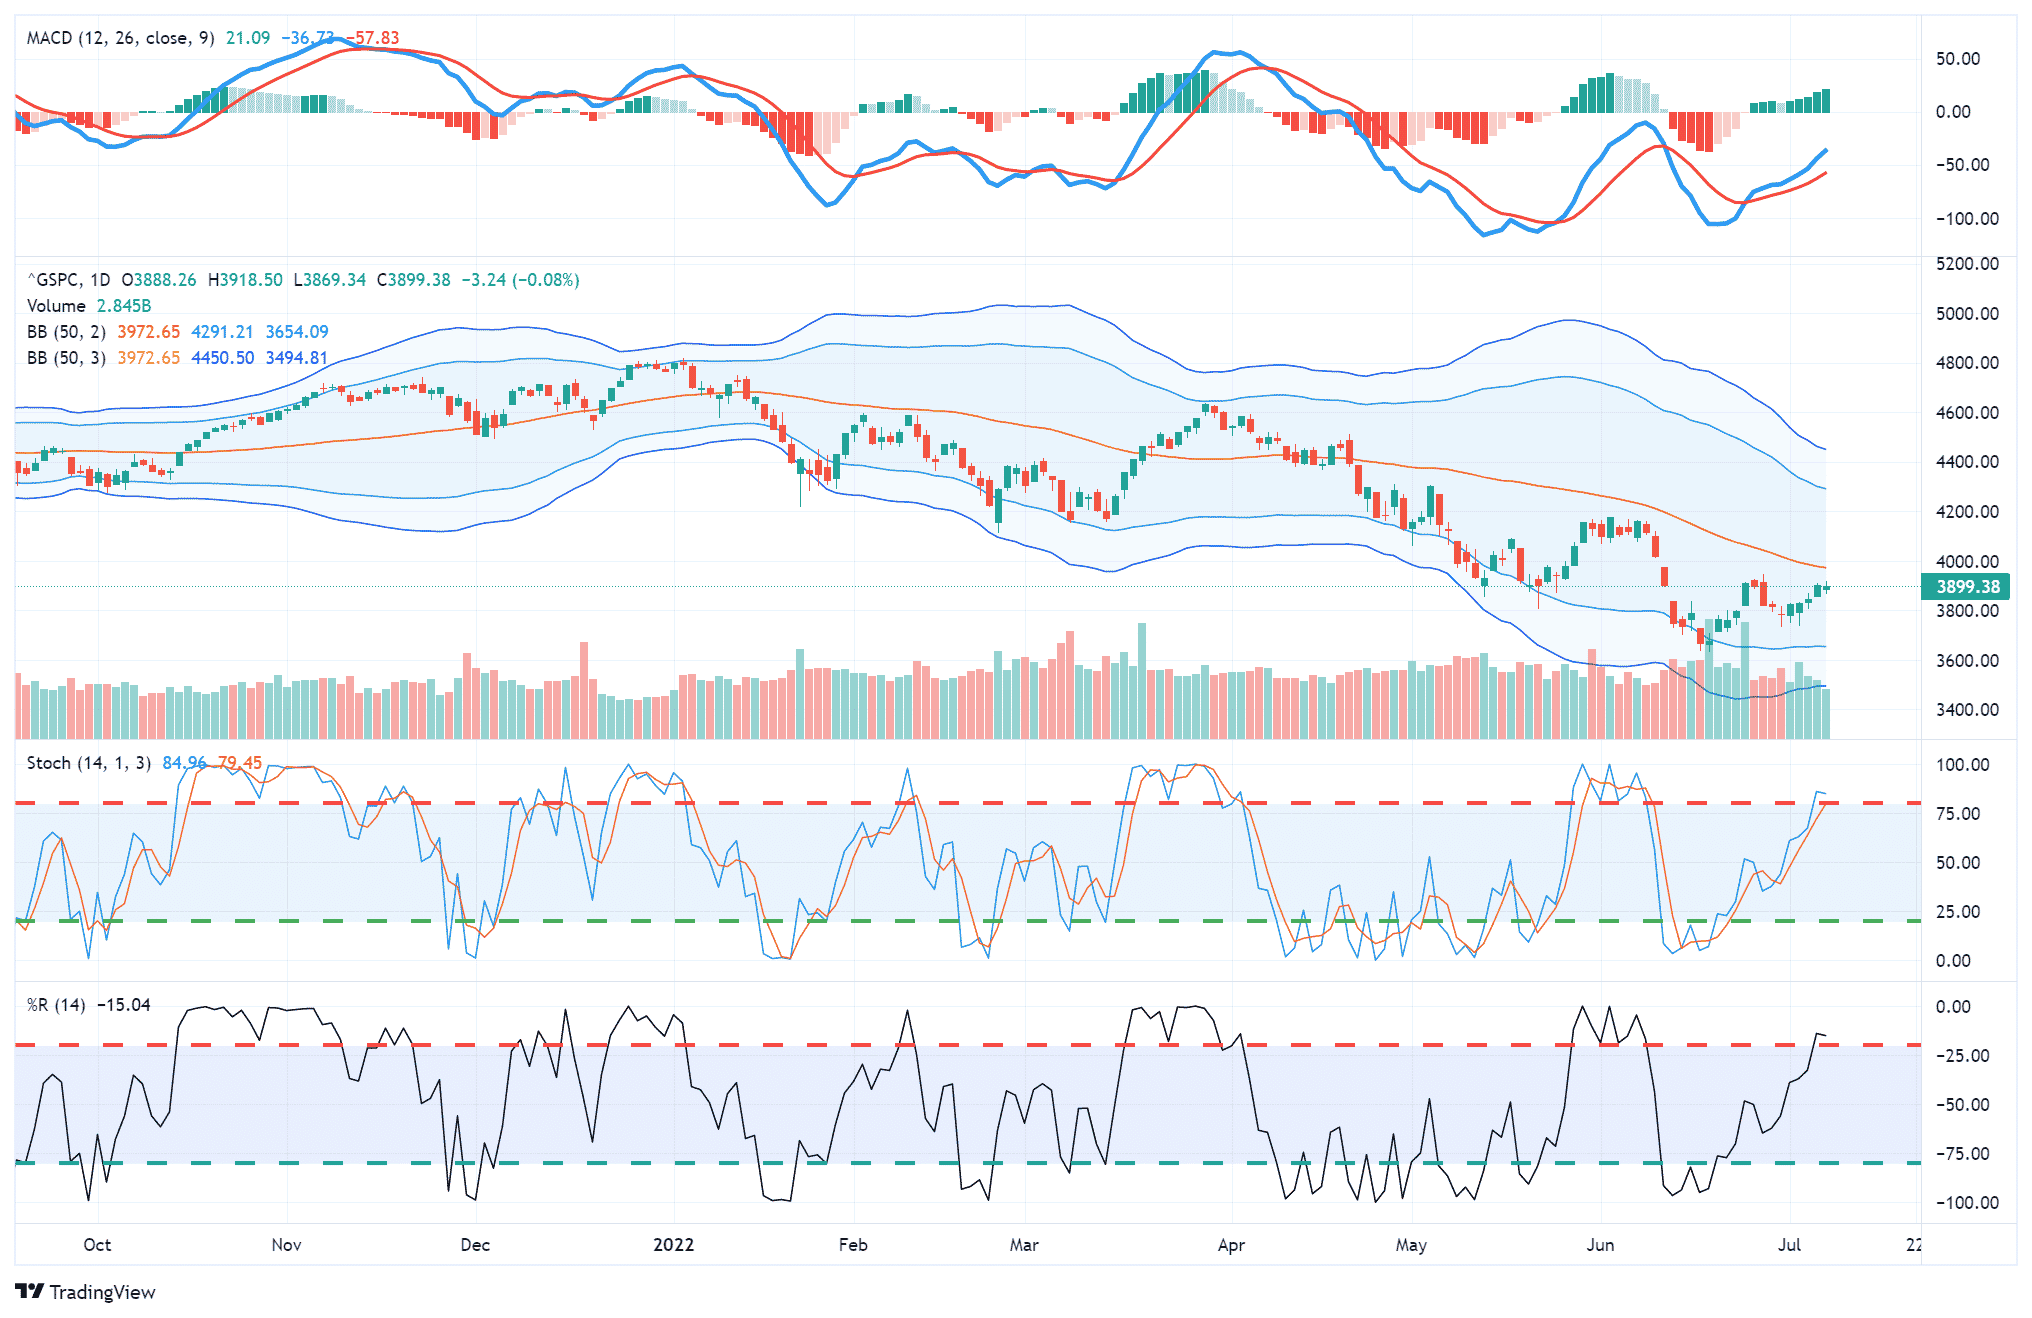
However, that rally has lacked a strong pickup in volume and the advance lacked commitment by traders. Unfortunately, the small advance consumed the majority of the oversold condition with the 50-dma remaining stiff resistance for the time being. We had taken on some index trading positions in both the Nasdaq (QQQ) and the S&P 500 Equal Weight Index (RSP) to trade the rally. However, given the weakness of that rally, we took profits in the QQQ position last week, and will likely close out RSP next week.
As we will discuss in today’s commentary, the big risk heading into the third quarter is not only the continued slowing of economic growth but earnings are at risk.
“Of the 103 S&P 500 companies have issued quarterly EPS guidance for the second quarter, 71 have issued negative EPS guidance and 32 have issued positive EPS guidance. The number of companies issuing negative EPS guidance is above the five-year average of 59 and above the 10-year average of 66. In fact, the second quarter has the highest number of S&P 500 companies issuing negative EPS guidance for a quarter since Q4 2019 (73).” – FactSet

Read more our expectations for this earnings season in this past weekend’s newsletter.
The Week Ahead
CPI, PPI, and Retail Sales will be well followed this week. With the strong jobs report on Friday, the Fed maintains the rationale to raise rates aggressively. The only thing that might temper their approach is a pronounced and unexpected weakening of inflationary pressures. Economists expect CPI to rise from 8.6% to 8.8% and the core rate to stay steady at 6%. PPI is expected to increase slightly. PPI is more difficult to estimate as it is unclear how recent swoons in commodity prices played into the calculation. Retail Sales are expected to grow by .5% but are likely to be negative on a real basis.
As we noted earlier, earnings season starts this week. JP Morgan on Thursday and Wells Fargo and Citibank on Friday will provide insight into the health of banking. Delta Airlines reports on Wednesday. Expectations for $1.64 per share are much better than the $1.23 decline last quarter. Investors will likely focus on their forward outlook. In particular high energy costs and air traffic expectations. Consumers often reduce travel when they are concerned about the economy and/or inflation.
Future Returns Are Not Sustainable
The impact of the Federal Reserve’s monetary interventions since 2009 is apparent in the returns of the last decade compared to the long-term average. While “stocks are not the economy” in the short-term, they should, and have historically, grown with the economy since their revenue, and earnings, are derived from economic activity. The massive divergence from underlying economic growth is representative of the excesses created by repeated monetary and fiscal interventions which, as Kailash notes below, is not sustainable.
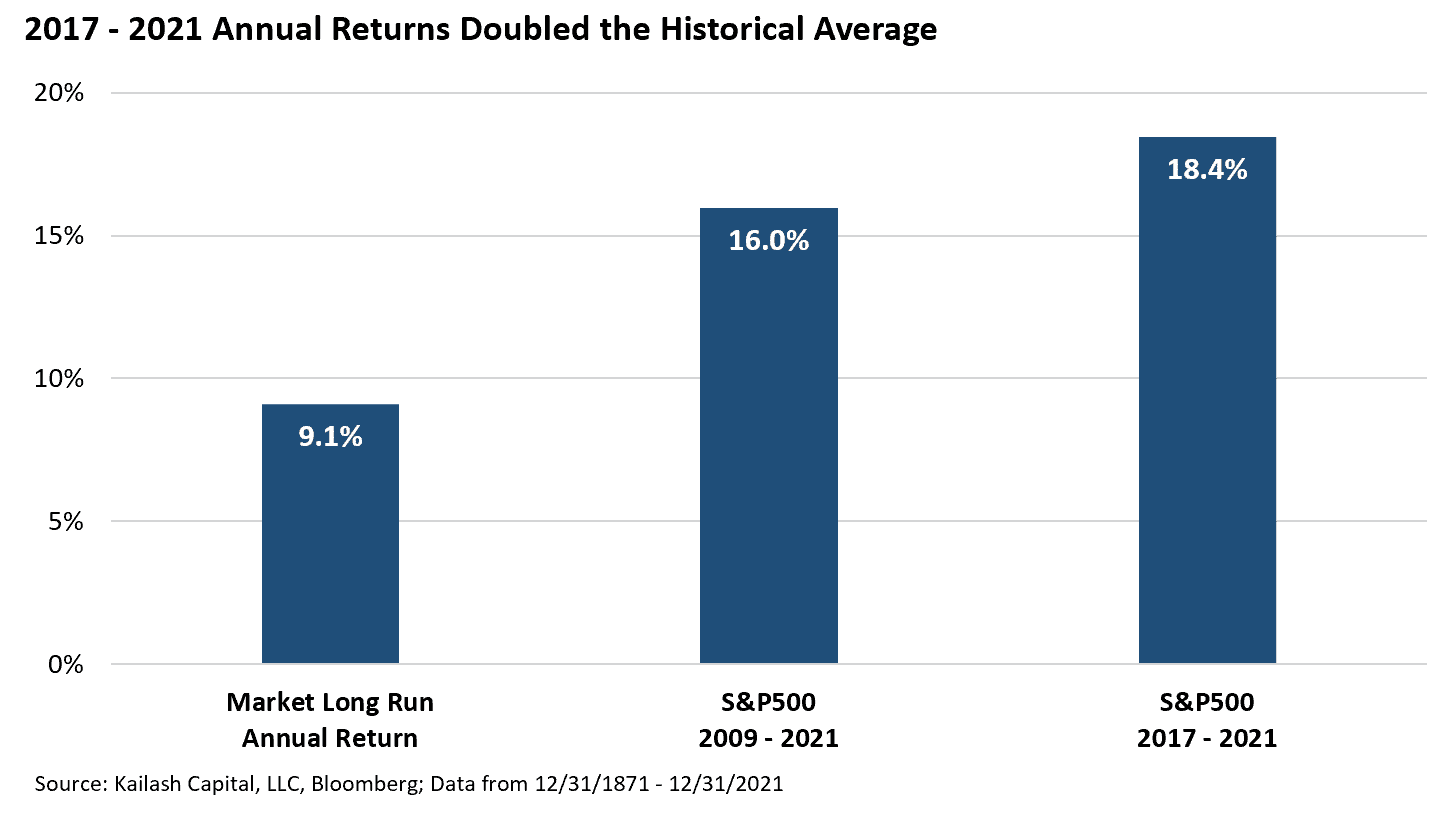
“The chart below shows the following three pieces of data:”
- First bar: the long-run annual return to the US stock market from 1871 – 2022 is 9.1%
- Second bar: shows that from 2009 – 2021, the market returned 16.0% per year for 13 years.
- Third bar: shows that in the five years from 2017 – 2021, the market averaged 18.4% per year.
“The conclusion is clear: this is not sustainable. The market has outperformed historical returns by a wide margin since 2009. Much of this outsized performance came in the 2017 – 2021 period when returns were 2x higher than long-term historical average.” – Kailash Concepts
BLS Employment Report
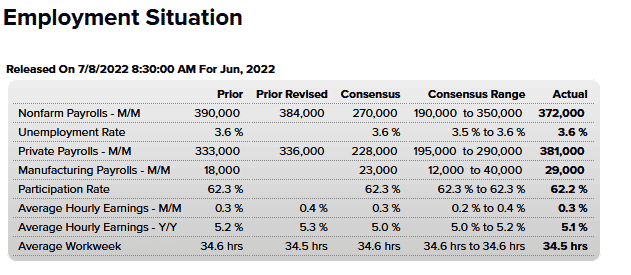
The BLS Employment report headline data was much stronger than expected, with 372k new jobs added in June. Further, per the BLS- “The number of persons employed part-time for economic reasons declined by 707,000 to 3.6 million in June and is below its February 2020 level of 4.4 million.” In other words, anyone that wants a full time job can get one.
Beneath the surface the report is not as friendly. For instance the prior two months were revised lower by 74k jobs in aggregate. Also, despite a near-record number of job openings, the number of people leaving the labor force rose by 510k. That caused the labor participation rate to fall from 62.3% to 62.2%. Lastly, average hourly earnings continue to grow at an annualized rate of 3.6% per month. Such compares poorly to CPI which is about 5% higher.
From a Fed/market perspective the headline strength provides the Fed enough justification to stay aggressive in fighting inflation. Remember its two mandates are prices and employment. Unless employment weakens materially, the Fed is likely to keep raising rates and reducing its balance sheet.
More on Inflation
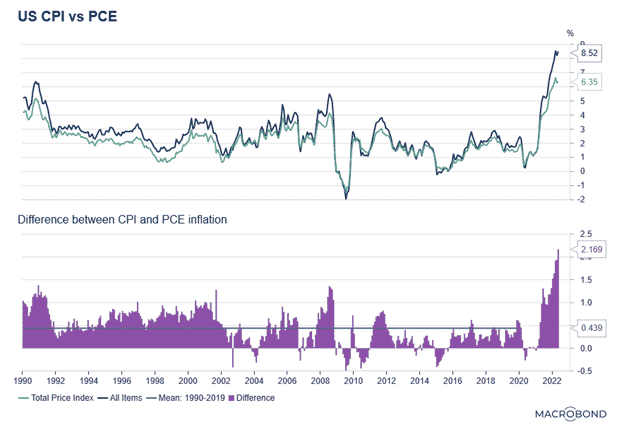
Inflation is undoubtedly a hot topic in the media. It is also the most critical issue for investors to understand given the Fed’s current policy stance in regards to public enemy number one- inflation. While we cover the topic frequently, we continually stumble upon graphs and data that help better appreciate the nuances of inflation. The two charts below from MacroBond are worth considering in this vane.
The first graph shows the difference between PCE (personal consumption expenditure) and CPI (consumer price index) has widened to a record. The Fed prefers PCE, but CPI tends to capture consumer costs more accurately. CPI puts a greater weight on shelter, food, and gas. The spread between the two averages 44bps. Over the last year it has widened to over 200bps. This may help explain why consumer sentiment is horrendous.
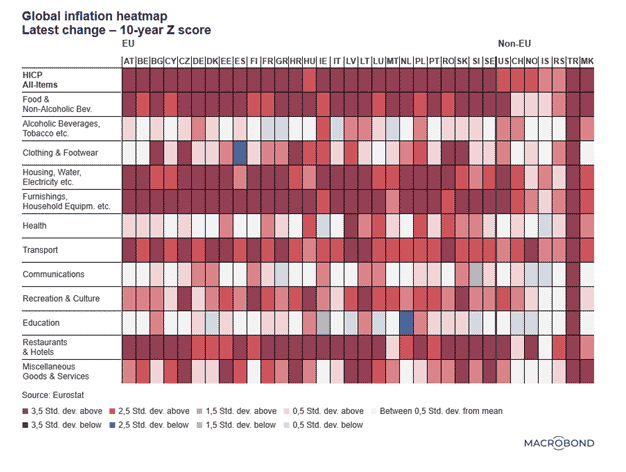
The second graph shows that high inflation rates are a global problem. The top row shows that all countries are experiencing inflation rates that are well above the average. It also shows that food, housing and transportation are driving inflation higher in most cases.
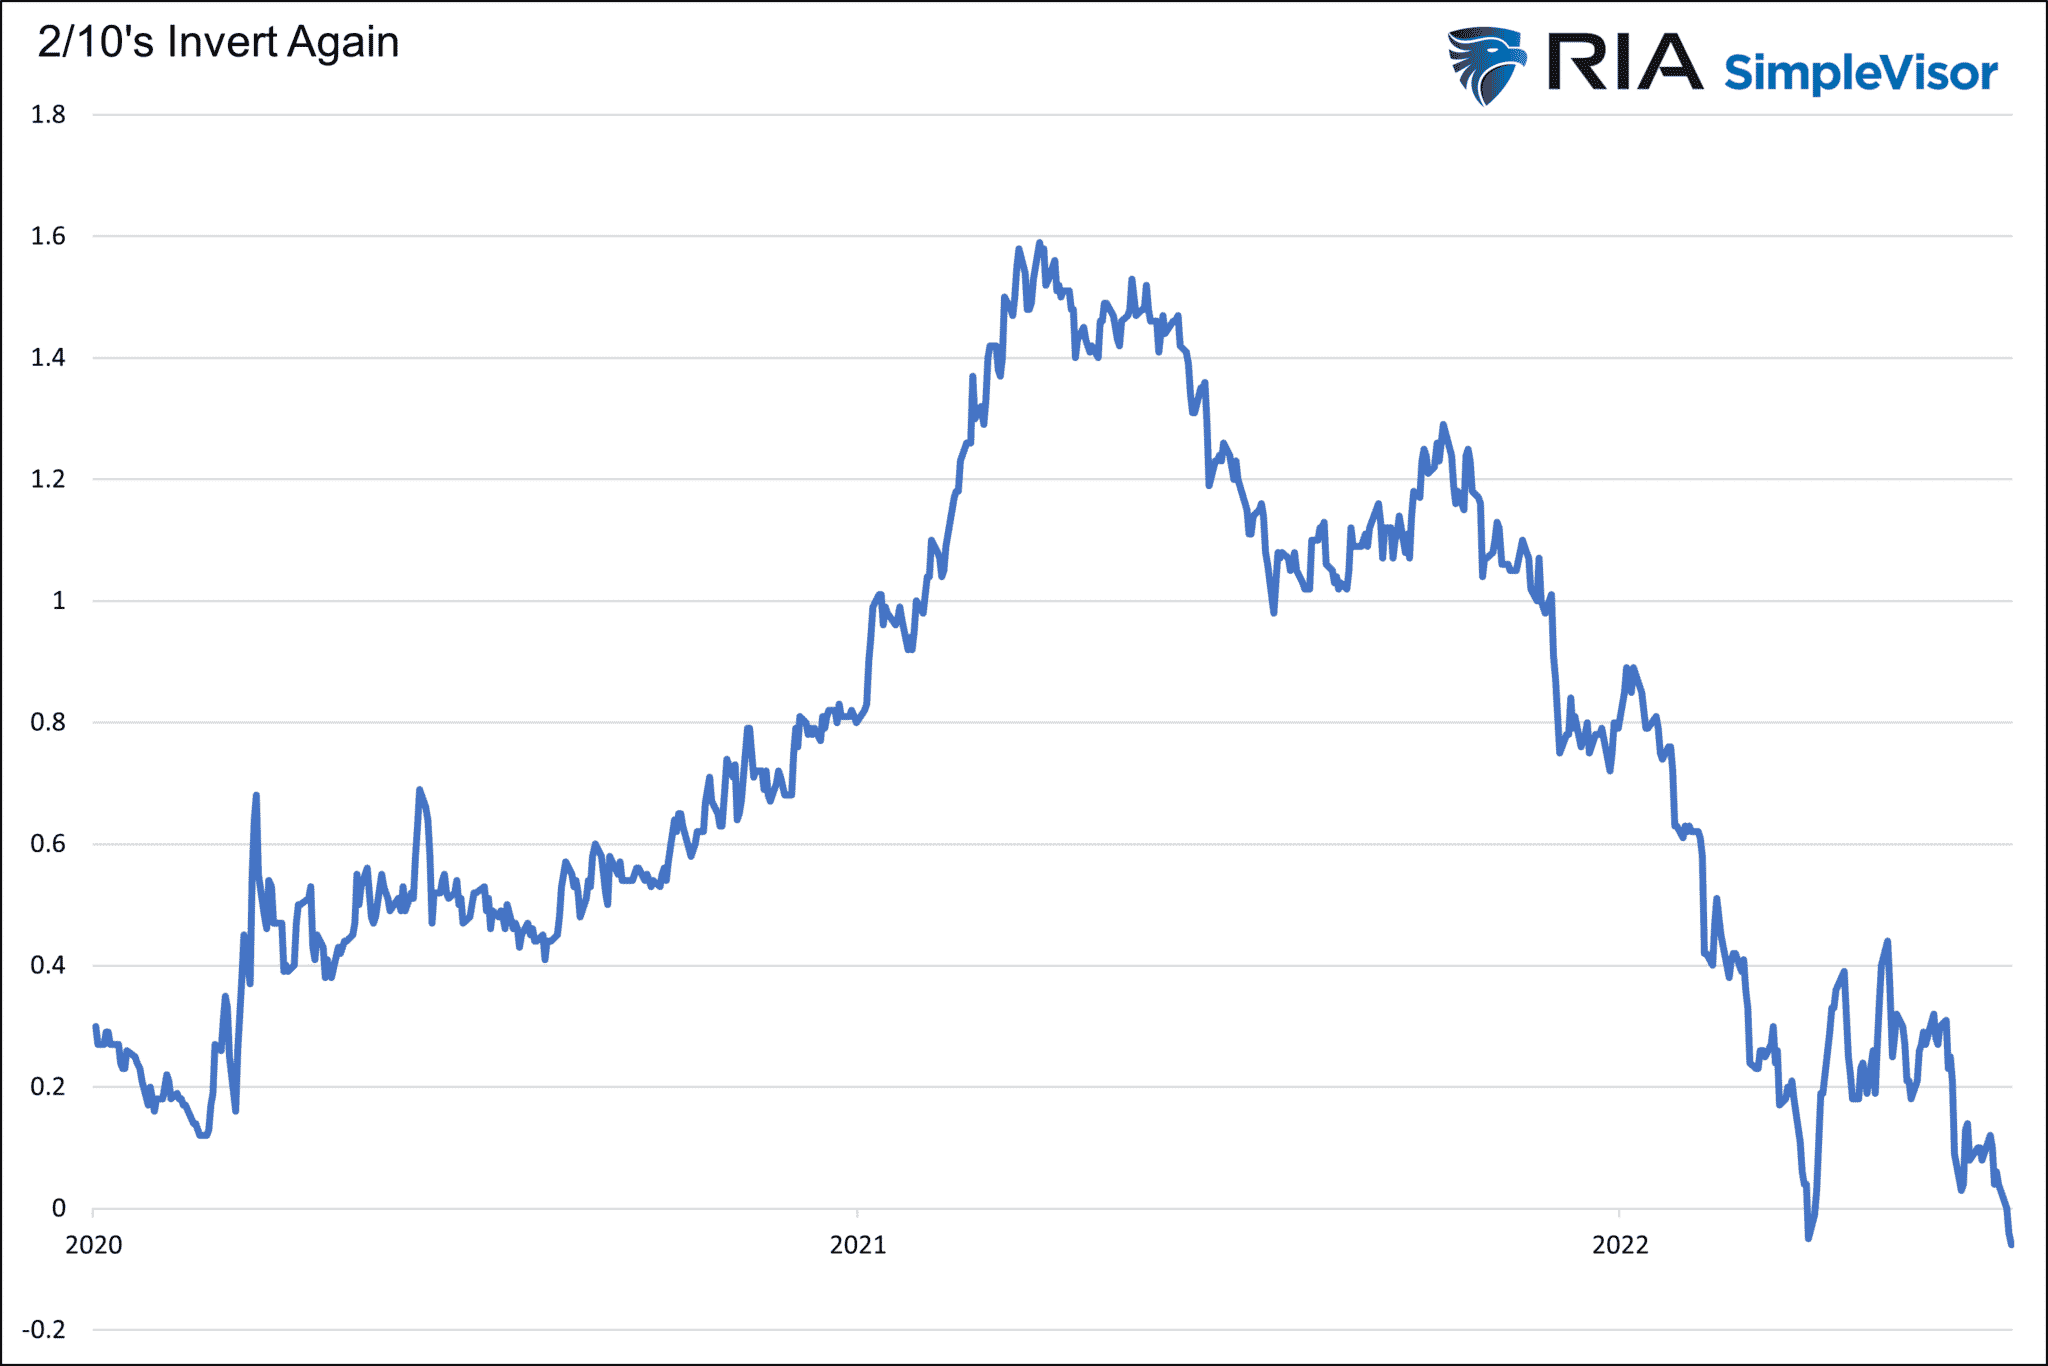
Yield Curve Inverts Again
As we show below the 10yr/2yr UST yield curve is once again inverted. Two inversions, in a short period of time is not unusual. As we have noted in the past, the inversion is a warning of a pending recession. The recession tends to come after the curve un-inverts. Stay tuned.
Please subscribe to the daily commentary to receive these updates every morning before the opening bell.
If you found this blog useful, please send it to someone else, share it on social media, or contact us to set up a meeting.
Also Read


