
Don’t fear all-time highs in the market. Such is a natural response for investors who are concerned about market risk. However, rather than fearing market exuberance, we must understand what drives it.
There is an essential concept investors should understand about markets when they are hitting “new records.”
“Record levels” of anything are “records for a reason.”
It should be remembered that when records are broken, that is the point where previous limits were reached. Just as in horse racing, sprinting, or car races, the difference between an old record and a new one is often measured in fractions of a second. Yes, while the market is currently hitting all-time highs, it is a function that, in this case, took two years to occur.
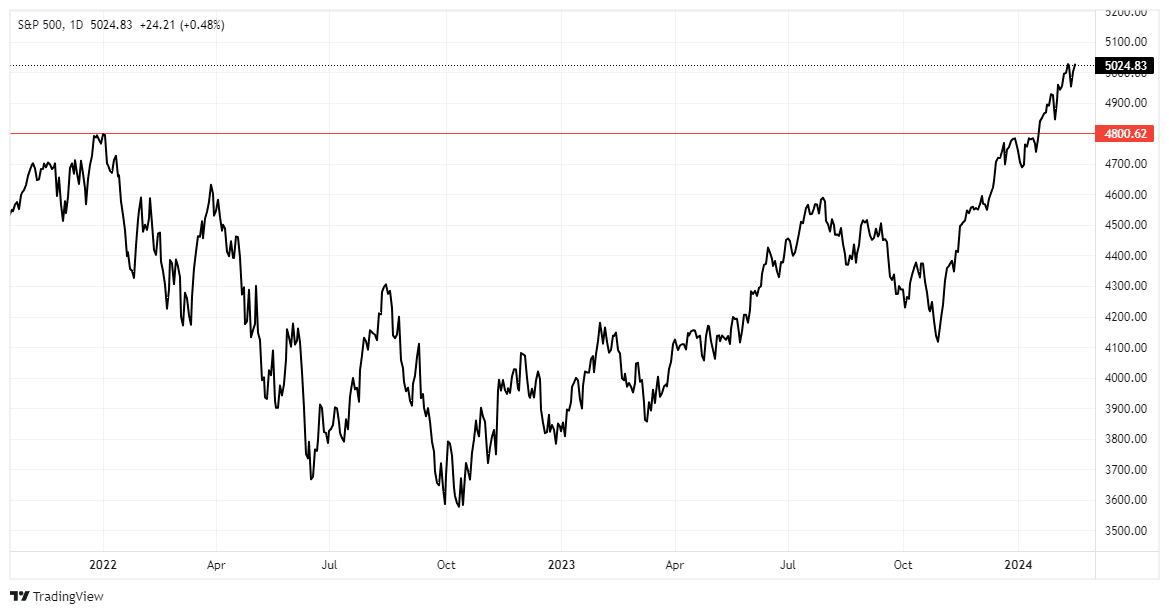
So, while the media is giddy about markets hitting all-time highs, we must remember that “record levels“ are NOT THE BEGINNING but rather an indication of a well-underway process. While the media has focused on record-low unemployment, record stock market levels, and surging confidence as signs of an ongoing economic recovery, history suggests caution. For investors, everything is always at its best at the end of a cycle rather than the beginning.
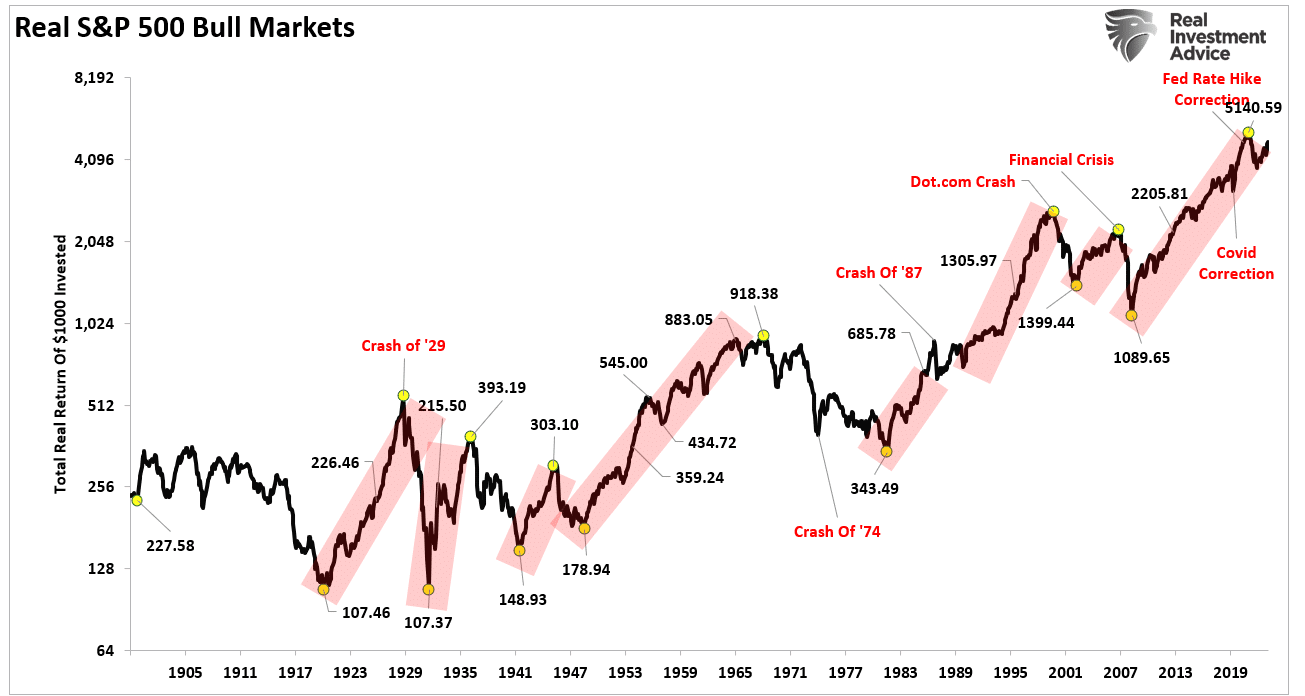
Let’s take a look at a long-term chart of the market. Since 1871, there have been FIVE very distinct bull market cycles. During those roughly 15 to 20-year periods, stock prices rose, hitting new highs. Notably, long periods of flat to declining prices follow bullish periods. In other words, 100% of the total market gains came from five distinct historical periods.
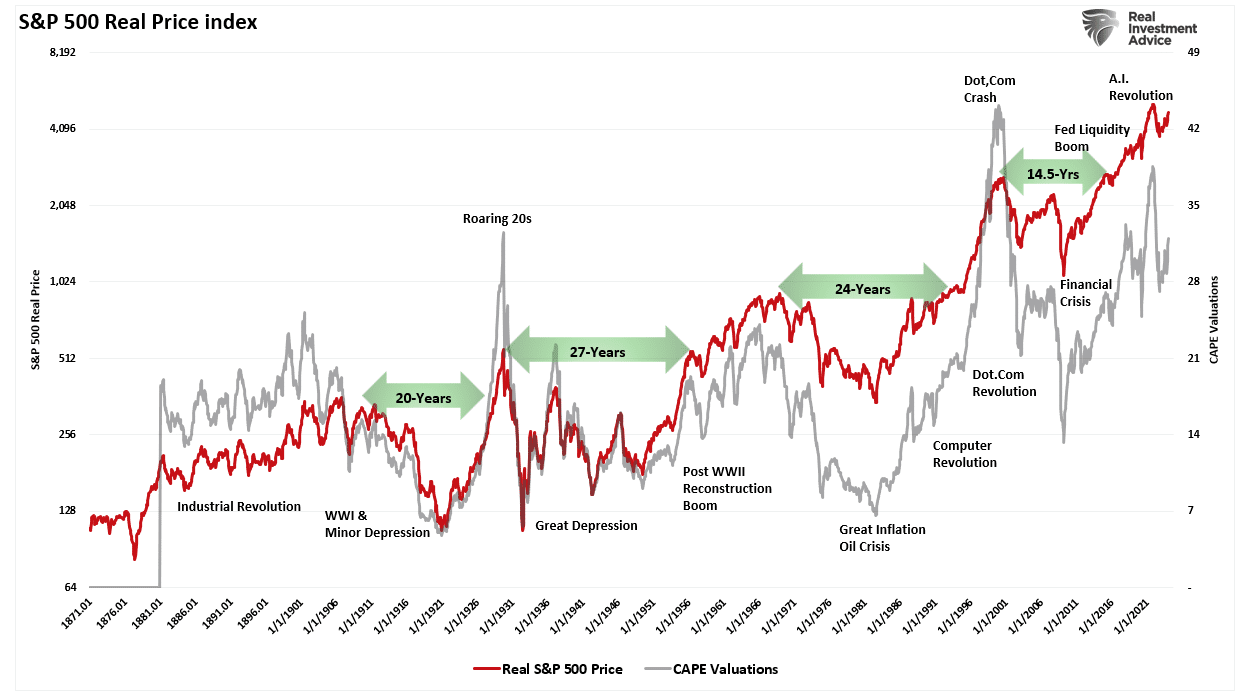
At the end of those five bullish trends, markets were at all-time highs. For those invested at those all-time highs, it took an average of 20 years before they saw all-time highs again. Note the level of valuations when those peak bull market periods occurred.
With valuations currently elevated and prices surging to all-time highs, does this mean we are in for 20 years of no returns?

What Valuations Do And Don’t Tell Us
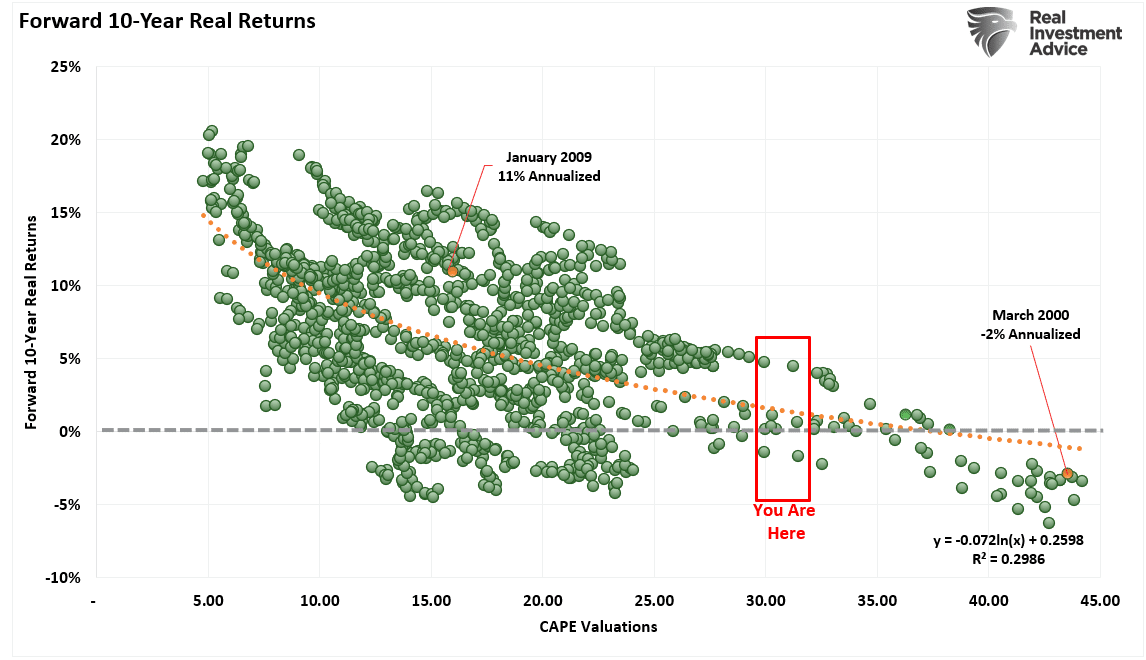
The mistake investors repeatedly make is dismissing the data in the short term because there is no immediate impact on price returns. Valuations, by their very nature, are HORRIBLE predictors of 12-month returns. As such, investors should avoid any investment strategy with such a focus. However, valuations are strong predictors of expected returns in the longer term.
While valuations suggest that returns over the next 10 years will likely be lower than the last decade, psychology drives short-term markets. Unsurprisingly, there is a high correlation between investor sentiment and asset prices. The chart below shows the 13-week moving average of net bullish sentiment (betail and institutional) versus the market. During periods of rising prices, sentiment increases, creating a buying panic for stocks.

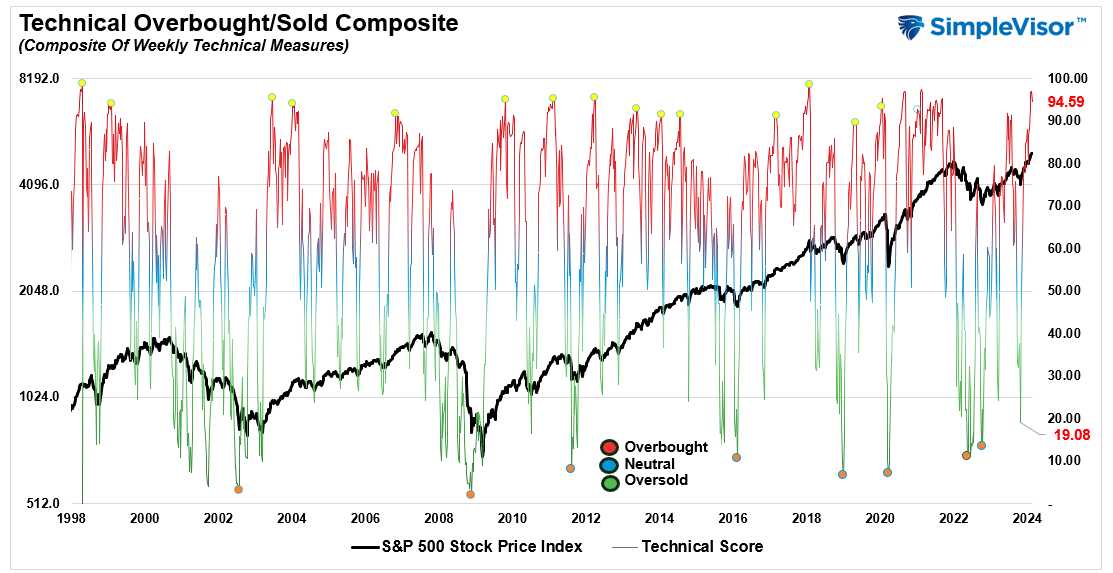
Eventually, something changes investors’ sentiment from bullish to bearish, and that creates the eventual reversion in asset prices. So, while valuations are vital in setting expectations for future rates of return, they are of little value in the short term. As such, this is why using some basic technical analysis can help investors navigate short-term market time frames to avoid excessive risk buildup in portfolios. The chart below is a composite of weekly technical indicators (price close as of the end of the week.) In October 2023, with a reading below 20, the deep oversold condition marked the bottom of the market. Such formed our call for a year-end rally. With the current reading above 90, which is exceptionally bullish, risk-taking by investors has swung wildly into bullish territory.
Of course, given the hype of “artificial intelligence” and the ongoing hopes of a reversal in monetary tightening, it is unsurprising that markets have hit all-time highs.

Don’t Fear All-Time Highs, Understand Them
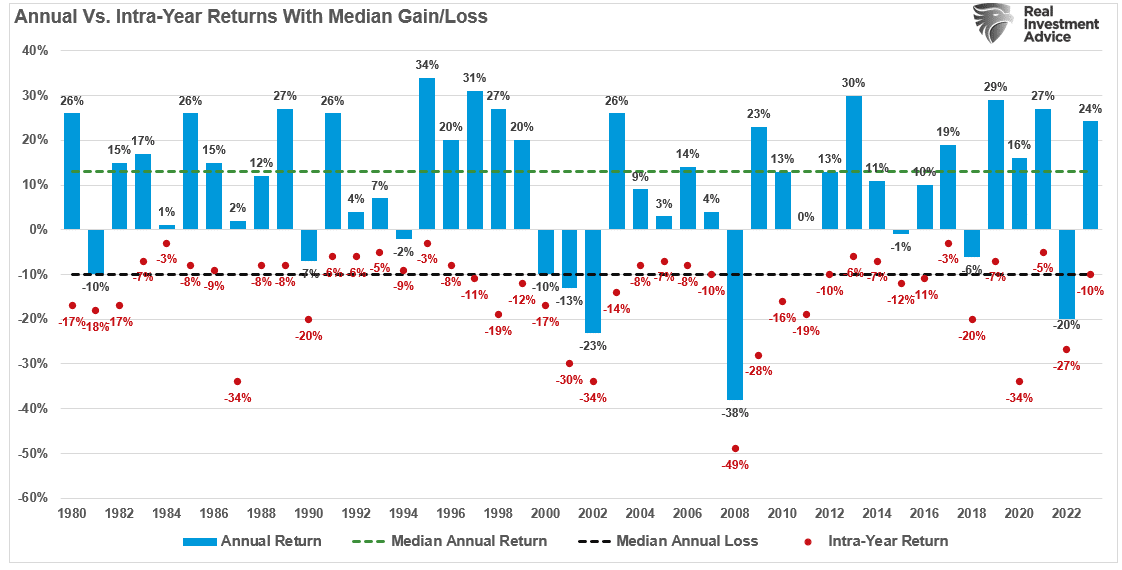
In the short term, investors should not fear all-time highs as a harbinger of impending doom. When driven by momentum and psychology, bull markets can last longer and go farther than logic would predict. But even during these momentum-driven rallies, 5-10% intrayear corrections are the norm.
History is pretty clear that when markets hit all-time highs, more will follow as investors become more “fearful of missing out.” But such exuberance will eventually give way to fundamental realities.
What will cause such a reversal is unknown. However, given the current deviation of the market from its long-term exponential growth trend, it will become more challenging for stocks to continue to grow faster than the economy. Notably, such deviations have historically led to extended periods of very low to zero rates of return.

Of course, that is what current valuations already tell us. While Wall Street analysts are very bullish on the future, some factors must be considered. The economic cycle is tied closely to demographics, debt, and deficit. If you agree with this premise and the data, then the media’s optimistic views are unlikely.
We believe rationalizing high valuations today will likely lead to disappointing future outcomes. However, bullish sentiment is becoming contagious in the short term, making continued “new all-time highs” more likely.
Don’t fear all-time highs. Just understand they are the byproduct of exuberance.

