


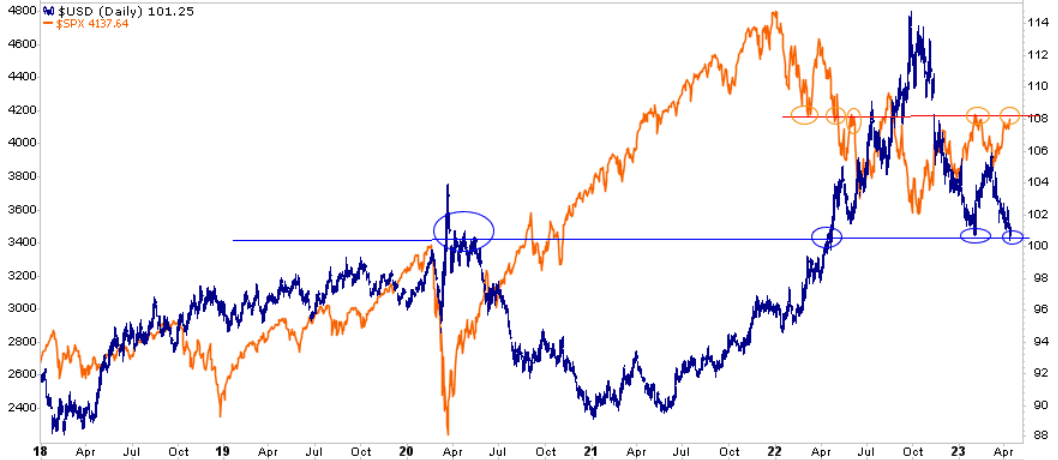
After falling about 15% from October 2022 to late January 2023, the dollar index bounced by about 6% but has since given that up and sits on what is becoming critical support. While many view this as a critical period for the future direction of the dollar index, its relationship to other assets is equally important. For example, the S&P 500 and the dollar have been mirror images of each other over the past year. The circles highlight that the S&P 500 is bumping up against its resistance as the dollar falls to its support. It’s quite likely the fate of the dollar index and the S&P 500 are in the same hands.
Some media pundits point to the recent decline as a sign that the dollar’s days as the world’s reserve currency is limited. We respond to those misplaced fears in The Dollars Death, Not So Fast, and add to the article in Part Two, due this Wednesday. We share the following quote from Part 1: For those losing sleep that the Chinese yuan, bitcoin, or some other currency will commandeer the dollar’s throne as the world’s reserve currency, sleep tight. That day is not coming anytime soon.
What To Watch Today
Economy

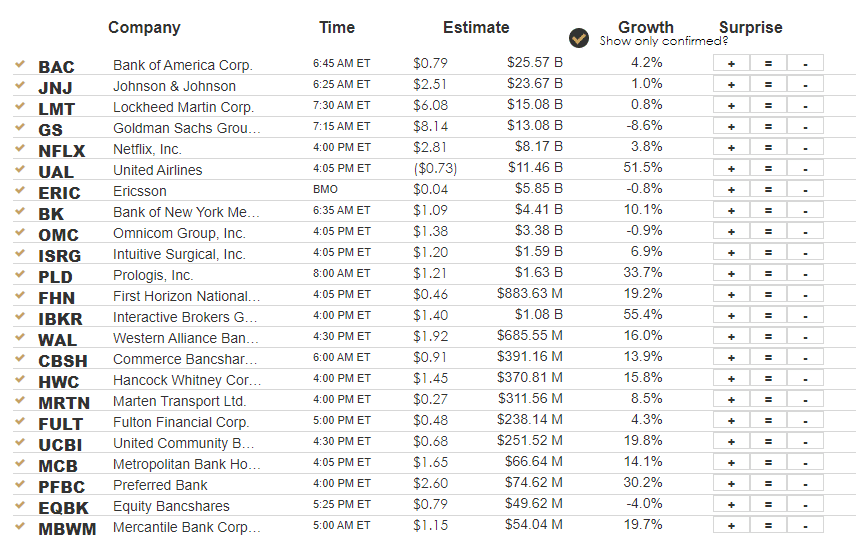
Earnings
- There are quite a few small to mid-size regional banks reporting today.
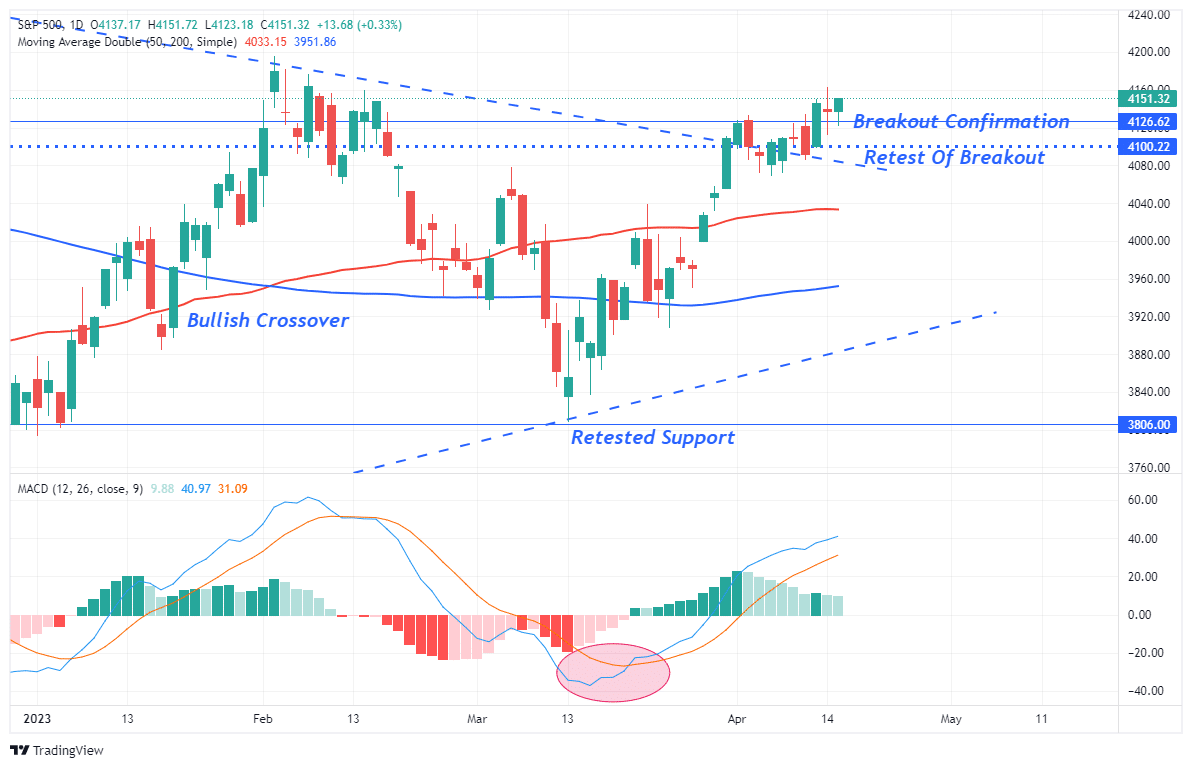
Market Trading Update
The market started out weak this morning but gained strength during the trading day closing above last week’s high. Such is further confirmation of the bullish breakout above the downtrend line. The MACD “buy signal” remains firmly intact, and while starting to weaken mildly, it is not in danger of crossing into a “sell” anytime soon.
This week, earnings season gets into full swing, and with much-lowered estimates from May of last year, expect plenty of companies to “beat” estimates, which should give a lift to stocks short-term. There is no reason to reduce exposure with upside targets for this rally running between 4200 and 4300.

1-Month Bill Signals Potential Trouble Beneath the Surface?
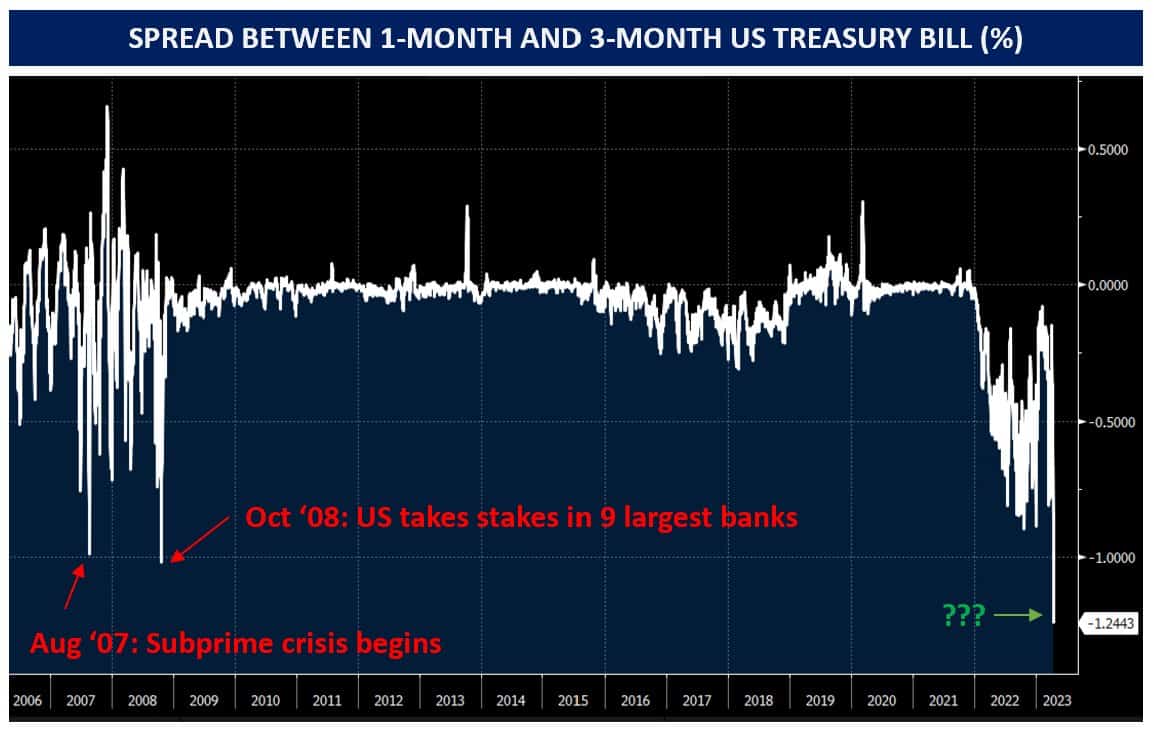
Since the end of the quarter, the yield on the 1-month Treasury bill fell from 4.70% to a low of 3.82% and back to 4.28%. Yet, Fed Funds futures are pricing in an 85% chance the Fed hikes rates on May 3rd and a 20% chance they hike again at the June meeting. The yield on the 1-month bill yield is historically closely tied to Fed Fund expectations. Further, highlighting the odd divergence is the 1-month yield is over 1% less than the 3-month bill. Lastly, banks and money market funds do not have to chase the 1-month bill. Instead, they can invest their cash in the Fed’s overnight reverse repo program (RRP) at approximately 4.80%. There has not been a run on 3-month bills or RRP despite the lower 1-month rate.
So what is going on? As the graph below shows, courtesy of Florian Kronawitter, the last time the 1 and 3-month bill rates had such large differences occurred during the financial crisis. The wide spreads in 2022 resulted from the 3-month pricing in multiple rate hikes over three months versus one month. While we do not have a definitive explanation for the divergence, the 1-month bill is probably in heavy demand for collateral underlying derivatives and leveraged positions. Given the recent banking issues, the large money center banks are possibly forcing clients to bolster collateral. We will share more as we learn more.
New York Economy Heats Up
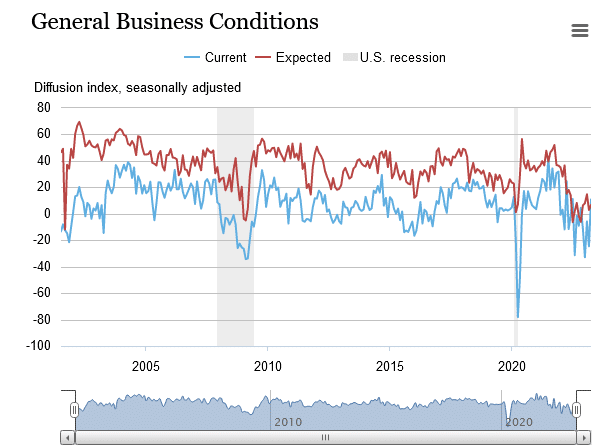
The New York Fed Empire Manufacturing Index surged to +10.8 versus estimates of -18. Leading the unexpected optimism is a jump in new orders (+25.1 from -21.7). Despite the jump in current optimism, the outlook is not as bullish. Per the report:
The index for future business conditions edged up to 6.6, suggesting that firms do not expect activity to improve much over the next six months.
Current prices paid and received continue to trend lower, but forward-looking expectations rose slightly. The number of employees and average workweek is below zero, signaling a contraction in the workforce. Interestingly, expectations for new orders barely changed despite the jump in the current new orders index.
As shown below, the data series is volatile, so do not read too much into this report.
Soft Commodities Rally
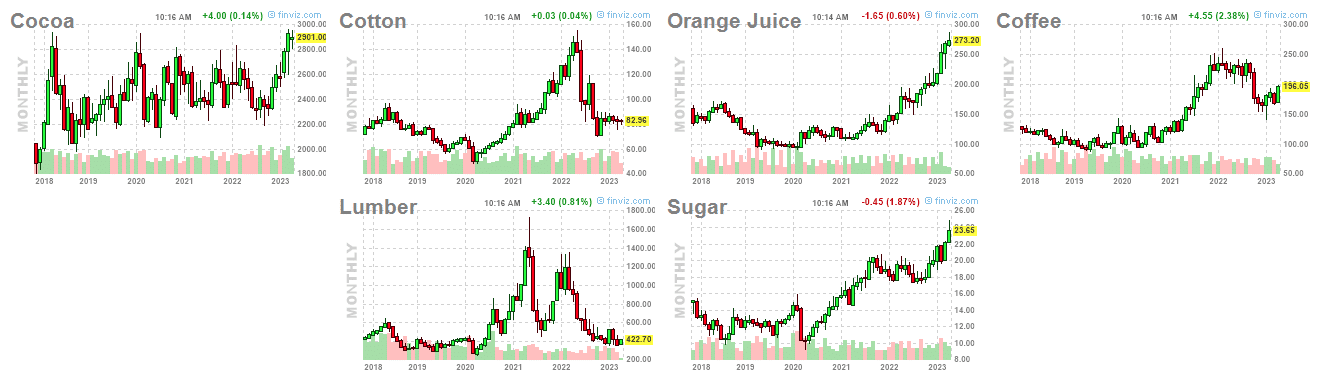
Oil and used prices have been rising lately, leading some to worry that goods prices, in general, may start increasing. Such would offset the expected decline in service prices and keep inflation sticky at high levels. MarketWatch provides another reason to worry about goods prices. In a recent ARTICLE, they note: “Orange juice futures are near a record. Sugar is at an 11-year high. And coffee is peaking too. What’s going on?
The graph below from Finviz shows that of the six commodities classified as “softs,”Cocoa, Orange Juice, and Sugar are at five-year highs. Coffee is approaching prior highs while Lumber and Cotton prices languish.
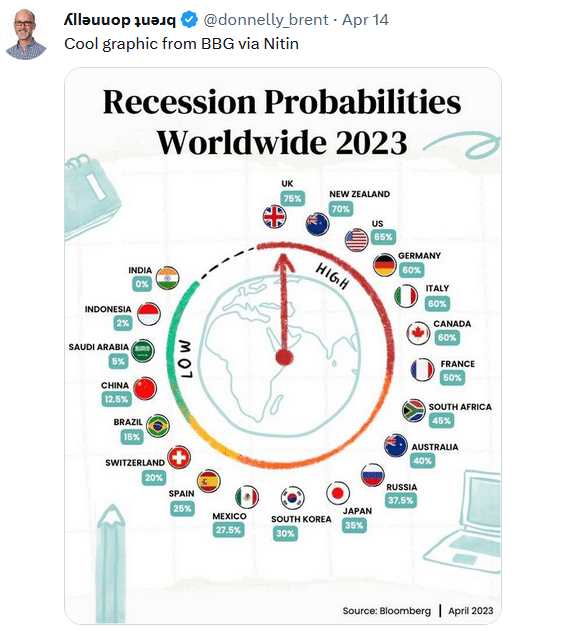
Tweet of the Day
Please subscribe to the daily commentary to receive these updates every morning before the opening bell.
If you found this blog useful, please send it to someone else, share it on social media, or contact us to set up a meeting.
Also Read


