Despite an ongoing “banking crisis,” investors continue to chase stocks triggering several bullish buy signals. As noted in this past weekend’s newsletter, two primary reasons exist for this current dichotomy. The first is psychological, and the second is purely technical.
The psychological component of the recent disregard of underlying financial and economic risk is the “Pavlovian” response to Central Bank interventions. To wit:
“Classical conditioning (also known as Pavlovian or respondent conditioning) refers to a learning procedure in which a potent stimulus (e.g., food) becomes paired with a previously neutral stimulus (e.g., a bell). Pavlov discovered that when he introduced the neutral stimulus, the dogs would begin to salivate in anticipation of the potent stimulus, even though it was not currently present. This learning process results from the psychological “pairing” of the stimuli.
Importantly, for conditioning to work, the “neutral stimulus,” when introduced, must get followed by the “potent stimulus” for the “pairing” to complete. For investors, as the Fed introduced each round of “Quantitative Easing,” the “neutral stimulus,” the stock market rose, the “potent stimulus.”
As shown, there is a high correlation between Fed balance sheet changes and the market since 2009.
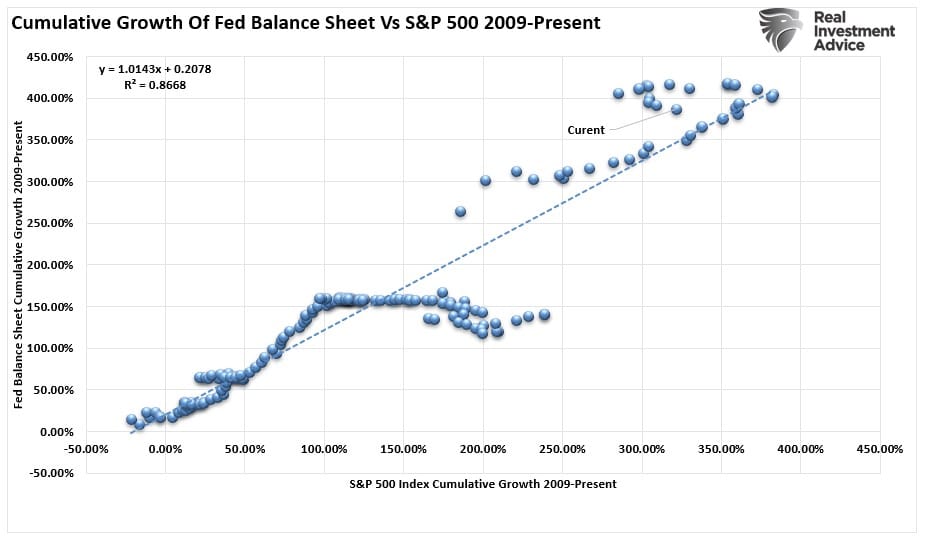
Given that correlation, it should not be surprising that investors began to “salivate” as recent interventions to offset the “banking crisis” by providing liquidity was the effective “ringing of the bell.”
As discussed in “Not QE,” these liquidity programs are not asset purchase programs but rather loans that must be repaid. However, the reversal of the Fed’s balance sheet tightening process was all that investors needed to see.
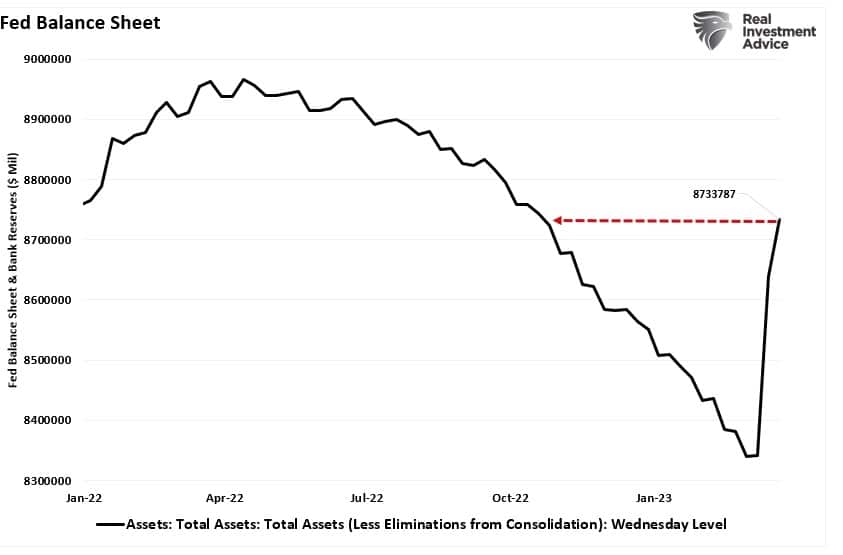
That was enough to spark a rally and trigger bullish buy signals that provided technical support for the market.

4200 Before The Next Decline
In an early February article, we discussed the “sell signals,” which led us to recommend reducing equity exposures,
“Our primary short-term ‘sell’ indicator has triggered for the first time since early December. Such has previously provided excellent signals of corrections and rallies. The chart below is courtesy of SimpleVisor.com and shows our proprietary money-flow indicator and the Moving Average Convergence Divergence (MACD) signal.
While that sell signal does NOT mean the market is about to crash, it does suggest that over the next couple of weeks to months, the market will likely consolidate or trade lower. Such is why we reduced our equity risk last week ahead of the Fed meeting.”
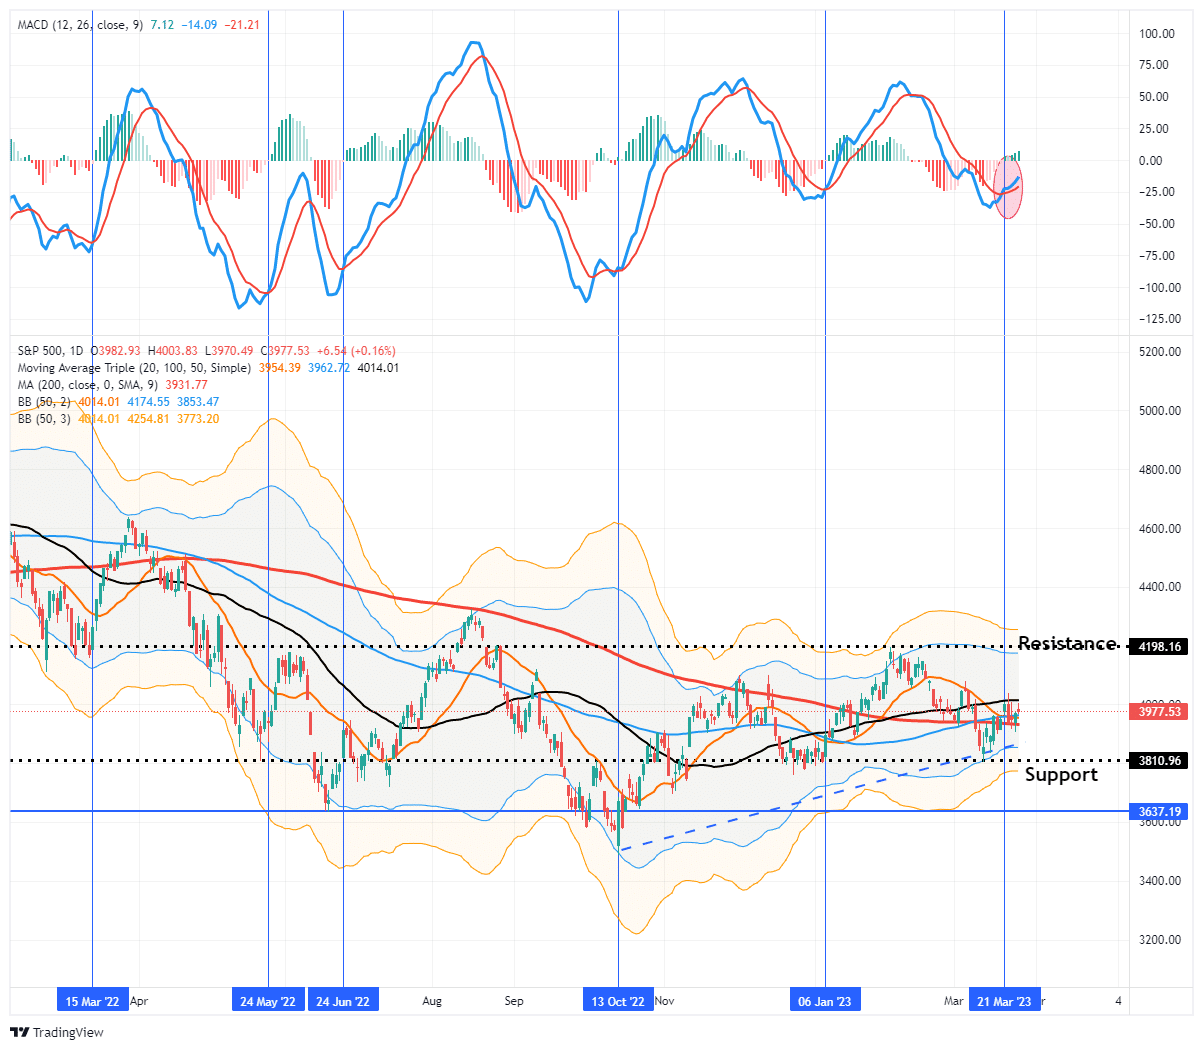
Following that article, the market declined, taking out the 200-DMA and breaking the critical uptrend support from the October lows. The market did hold support at the December lows keeping the bullish trend intact.
Those signals have now reversed, suggesting investors should cautiously increase equity risk for a short-term rally.
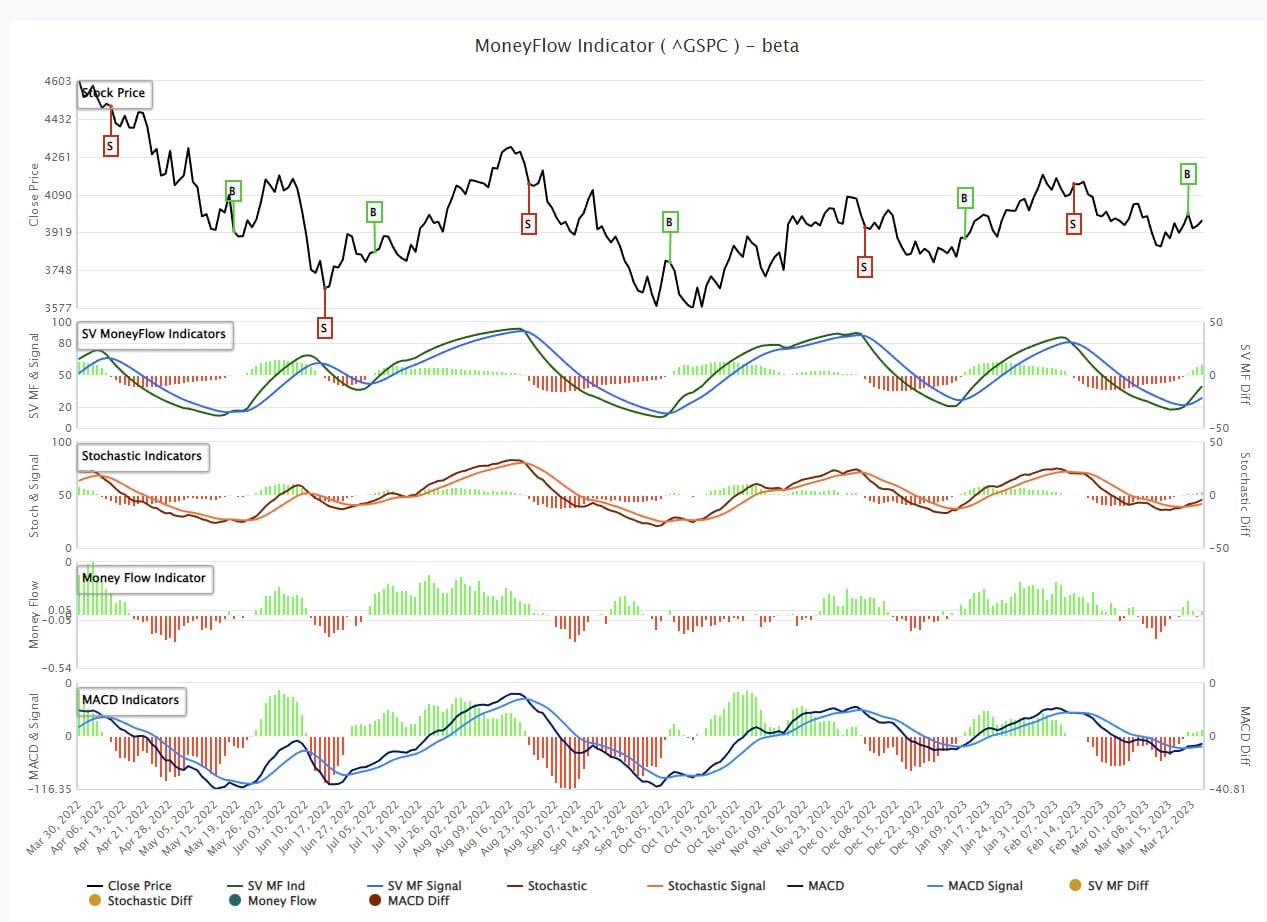
That MoneyFlow signal is also confirmed by the Moving Average Convergence Divergence indicator (MACD) “buy signal.”
As noted above, there are many reasons to remain cautious of the markets over the 6-9 months as the “lag effect” of rate hikes impacts both the economy and earnings.
However, with these buy signals in place, investors should modestly increase equity exposure, as the likely path for stock prices is higher over the next two weeks to two months. As shown, the most likely target for the S&P 500 is 4200 before serious resistance is encountered and a reasonable level to take profits and again reduce risk.

However, with the banking crisis still unfolding, such could limit the upside to equity prices near term, which could keep any rally contained between 4000 and 4100. We will watch our technical indicators for the next signal to reduce equity risk regardless of where markets are trading.

Remembering Bear Stearns
The obvious question is, “how could markets possibly trigger bullish buy signals, and rally, amid a global banking crisis?”
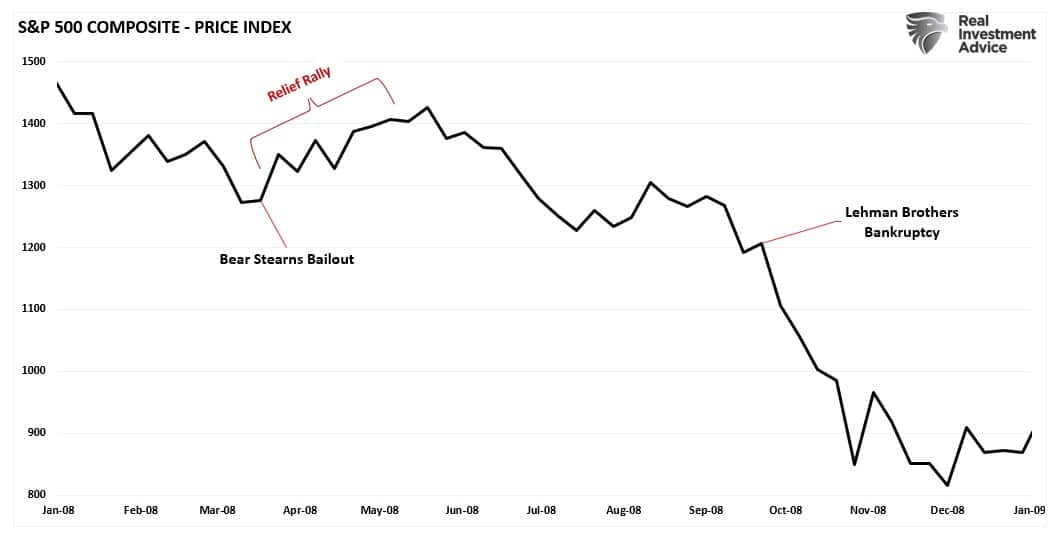
A brief history review reminds us of a similar situation amid the early stages of the “subprime mortgage crisis.” At that time, Bear Stearns had two mortgage funds, ironically called “High-Grade Structured Credit” and “High-Grade Structured Credit Enhances Leverage,” that failed as the subprime credit market imploded and liquidity evaporated. The rest, as they say, is history.
On March 14, 2008, the Federal Reserve Bank of New York (“FRBNY”) agreed to provide a $25 billion loan to Bear Stearns collateralized by unencumbered assets from Bear Stearns to provide Bear Stearns the liquidity for up to 28 days that the market was refusing to provide. Shortly thereafter, FRBNY had a change of heart and told Bear Stearns that the 28-day loan was unavailable to them.
The deal was then changed to where FRBNY would create a company (eventually becoming Maiden Lane LLC) to buy $30 billion worth of Bear Stearns’ assets, and JPMorgan Chase would purchase Bear Stearns in a stock swap worth $2 a share, or less than 7 percent of Bear Stearns’ market value just two days before.” – Wikipedia
The market had been under pressure since the beginning of the year as the Bear Stearns drama unfolded. The subsequent bailout and reassurances of “financial stability” catalyzed a relief rally into June.
Conclusion
As noted above, we have a similar setup in the markets currently with negative investor sentiment and reassurances from the Federal Reserve that the “banking system is sound and resilient.”
Whether it is or not remains to be seen, and Powell’s statement reminded me of Ben Bernanke’s infamous declaration before Congress in 2007:
“We do not expect significant spillovers from the subprime market to the rest of the economy or to the financial system.”
While I am not saying we are about to have a financial crisis, I do suggest there is an elevated level of risk to the markets.
- Extracting cash from the markets into 4%-plus money market funds reduces buying power.
- The economy is slowing, which will reduce earnings growth.
- The Fed’s previous rate hikes are only now beginning to impact the economy.
- Bank lending standards are rapidly tightening, putting further restraints on economic growth.
- Inflation is slowing down, reducing corporations’ pricing power and squeezing margins.
- Unemployment will rise in the months ahead.
Just as in 2008, the economy was in a recession; we didn’t realize it yet as the economic data didn’t fully reflect it. However, in hindsight, the Bear Stearns debacle was a vital clue something in the system had broken.
While we see many similarities in the financial system today, that doesn’t mean markets can’t rally based solely on “hope” and “optimism.”
A rally toward 4200 is possible, as investor psychology is not always logical.
However, we will use that rally to reduce risk and rebalance portfolios to protect against the final bearish leg of this market as the realization of the economic recession becomes visible.

