Blog Worried Consumers Keep Spending: Here’s Why Daily Market Commentary An Incalculable Concept That Is Misleading The Fed Daily Market Commentary A Rising Dollar Becomes A Headwind Daily Market Commentary Jobs Recovery Or One-Off Blip? Blog Sequence Of Return Risk: The Math That Breaks Retirements Bull Bear Report Q4 Market Outlook: Strong Years Usually Finish Strong Daily Market Commentary Can Anthropic Outearn Its Obligations? Blog Price Of Happiness: Missing The Things That Matter Daily Market Commentary The Swap Market Says Treasury And AI Debt Is Not A Problem Blog From TINA To TIGA: Diversification Pays Again
Vol. XXVII · No. 134
Wednesday — October 7, 2026
Houston, Texas

Category: PRO BLOG

Sector Buy/Sell Review: 03-17-20

Sector Buy/Sell Review: 03-17-20

By Lance Roberts, Mar 18, 2020

Each week we produce a chart book of the S&P 500 sectors to review where money is flowing within the market as whole. This helps refine not only decision making about what to own and when, but what sectors to overweight or underweight to achieve better performance. HOW TO READ THE CHARTS There are three […]
RIA PRO: Risk Limits Hit

RIA PRO: Risk Limits Hit

By Lance Roberts, Mar 16, 2020

With a global recession underway, there are too many uncontrollable risks currently to maintain high levels of equity exposures. With the long-term bull trend now broken, cash is king.

Major Market Buy/Sell Review: 03-16-20

Major Market Buy/Sell Review: 03-16-20

By Lance Roberts, Mar 16, 2020

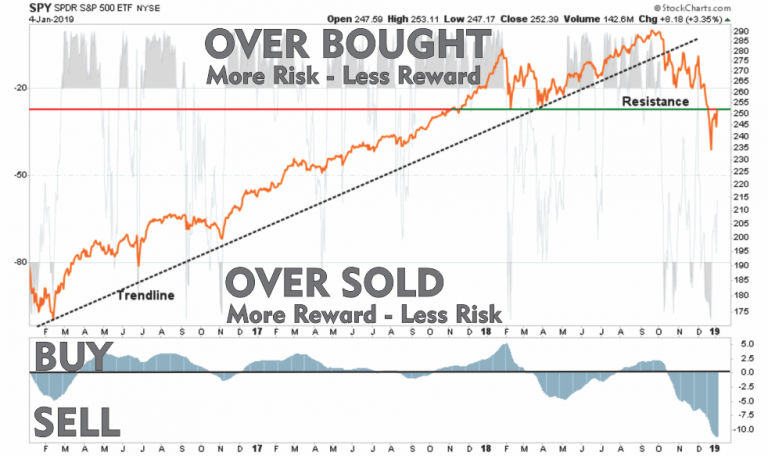
HOW TO READ THE CHARTS There are three primary components to each chart: The price chart is in orange The Over Bought/Over Sold indicator is in gray The Buy / Sell indicator is in blue. When the gray indicator is at the TOP of the chart, there is typically more risk and less reward available […]

How Far Can Stocks Fall?

How Far Can Stocks Fall?

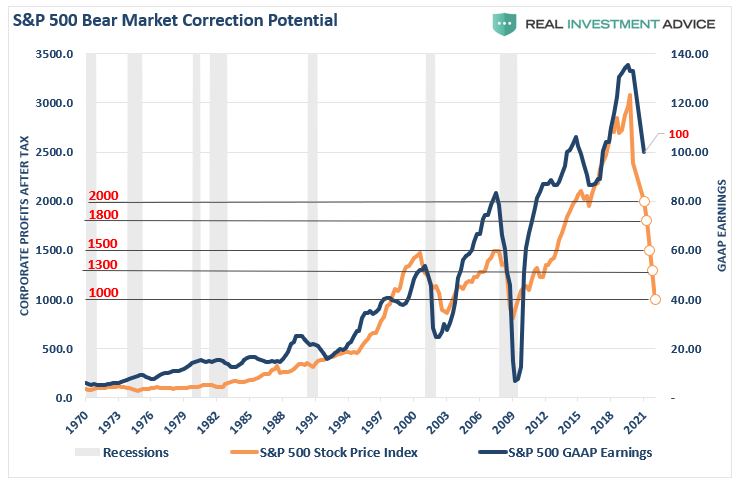
By Michael Lebowitz, Mar 14, 2020

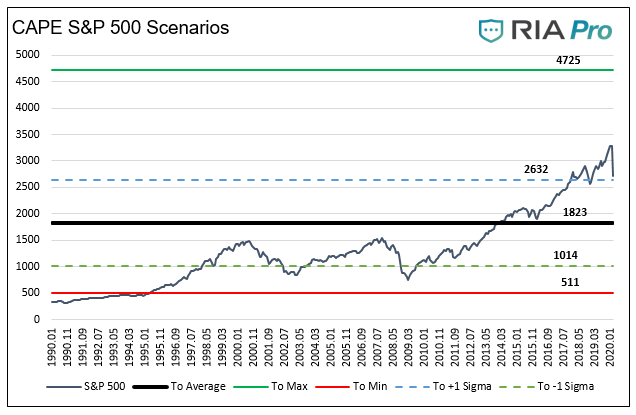
Using CAPE to better assess how far stock prices can rise or fall.

Market Crash. Is It Over, Or Is It The “Revenant”

Market Crash. Is It Over, Or Is It The “Revenant”

By Lance Roberts, Mar 14, 2020

The #RealInvestmentReport is our weekly newsletter which covers our thoughts on the current market environment, the risk to capital relative to the market, and how we are positioned currently. It includes our MacroView, analysis on markets and sectors, financial planning, and our 401k plan manager.

Special Report: Fed Launches A Bazooka As Markets Hit Our Line In The Sand

Special Report: Fed Launches A Bazooka As Markets Hit Our Line In The Sand

By Lance Roberts, Mar 12, 2020

The severity of the recent market rout has been quite astonishing. As shown below, in just three very short weeks, the market has reversed almost the entirety of the “Trump Stock Market” gains. The decline has been unrelenting, and despite the Fed cutting rates last week, and President Trump discussing fiscal stimulus, the markets haven’t […]

Special Report: S&P 500 – Bounce Or Bull Market

Special Report: S&P 500 – Bounce Or Bull Market

By Lance Roberts, Mar 11, 2020

Headlines from the past two days: Dow sinks 2,000 points in worst day since 2008, S&P 500 drops more than 7% Dow rallies more than 1,100 points in a wild session, halves losses from Monday’s sell-off Actually its been a heck of a couple of weeks for the market with daily point swings running 1000, […]

Sector Buy/Sell Review: 03-10-20

Sector Buy/Sell Review: 03-10-20

By Lance Roberts, Mar 10, 2020

Each week we produce a chart book of the S&P 500 sectors to review where money is flowing within the market as whole. This helps refine not only decision making about what to own and when, but what sectors to overweight or underweight to achieve better performance. HOW TO READ THE CHARTS There are three […]
Major Market Buy/Sell Review: 03-09-20

Major Market Buy/Sell Review: 03-09-20

By Lance Roberts, Mar 9, 2020

HOW TO READ THE CHARTS There are three primary components to each chart: The price chart is in orange The Over Bought/Over Sold indicator is in gray The Buy / Sell indicator is in blue. When the gray indicator is at the TOP of the chart, there is typically more risk and less reward available […]