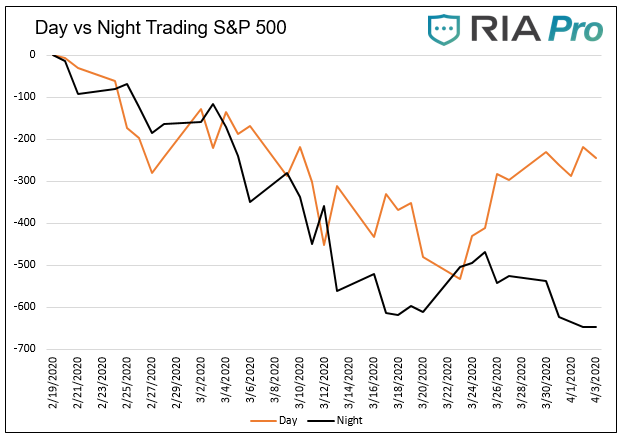
How To Use S&P 500 Futures to Indicate the Market Open
Showing users the calculation to assess how the stock market might open the next morning
Showing users the calculation to assess how the stock market might open the next morning

no more easy buying on every decline and watching the longs go higher. This is tough stuff; with Covid-19 cases continuing to grow, governments enacting measures to stop the spread, which will hurt economies, and markets discounting future bad news.
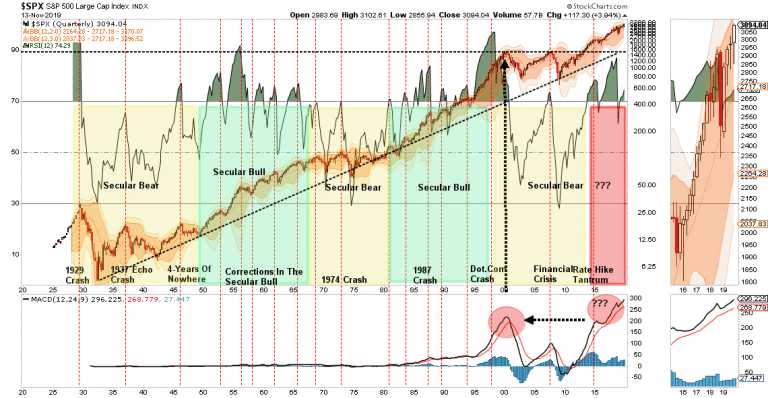
A technical review of the S&P 500 using daily, weekly and monthly charts to determine overbought, oversold, and risk/reward scenarios for carrying equity exposure. Is the “bear market” over? The media headlines certainly suggest that is the case. Has the Federal Reserve liquidity “nuclear bomb” arrested the sell off permanently? This is what investors have […]
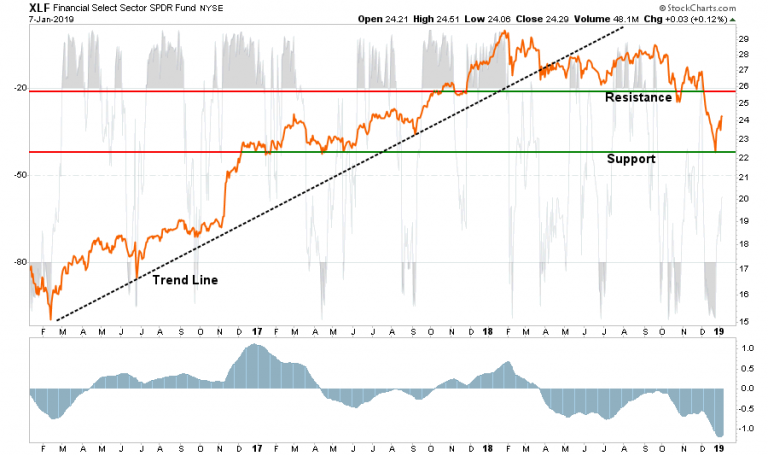
Each week we produce a chart book of the S&P 500 sectors to review where money is flowing within the market as whole. This helps refine not only decision making about what to own and when, but what sectors to overweight or underweight to achieve better performance. HOW TO READ THE CHARTS There are three […]
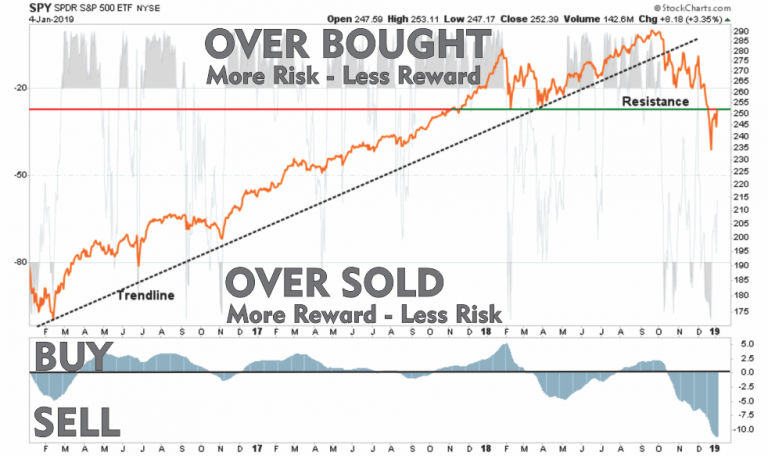
HOW TO READ THE CHARTS There are three primary components to each chart: The price chart is in orange The Over Bought/Over Sold indicator is in gray The Buy / Sell indicator is in blue. When the gray indicator is at the TOP of the chart, there is typically more risk and less reward available […]

The #RealInvestmentReport is our weekly newsletter which covers our thoughts on the current market environment, the risk to capital relative to the market, and how we are positioned currently. It includes our MacroView, analysis on markets and sectors, financial planning, and our 401k plan manager.

RIA Advisors is proud to present the 2020 Investment Summit. Hosted By: Lance Roberts, CIO RIA Advisors. Featuring:Michael Lebowitz, CFA - RIA Portfolio Manager, Teddy Valle - Pervalle Global, Thomas Thornton - HedgeFund Telemetry, and Jeffery Marcus - TP Analytics

According to the Statistical Crash Probability Analysis (SCPA) forecast the probability is 100% that the relief rally high has either already occurred or will occur by April 8, 2020. The probability is the same for the markets of the six countries to make new lows by April 30, 2020.
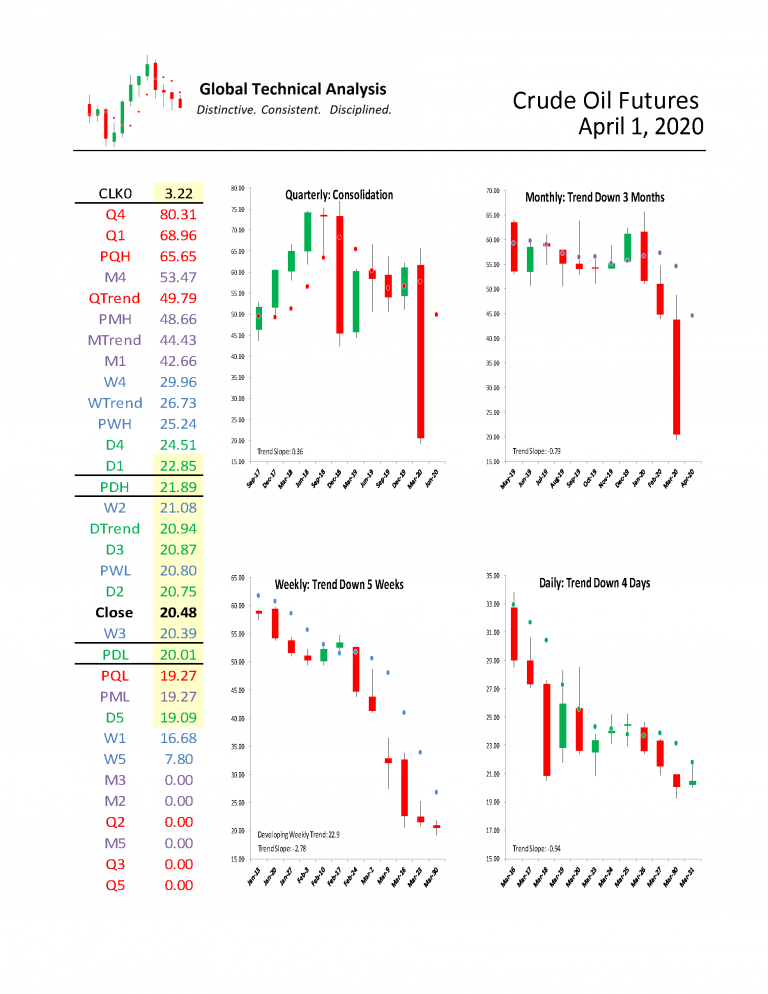
J. Brett Freeze and his firm Global Technical Analysis (GTA) provides RIA Pro subscribers Cartography Corner on a monthly basis. Brett’s analysis offers readers a truly unique brand of technical insight and risk framework. We personally rely on Brett’s research to help better gauge market trends, their durability, and support and resistance price levels. GTA […]