
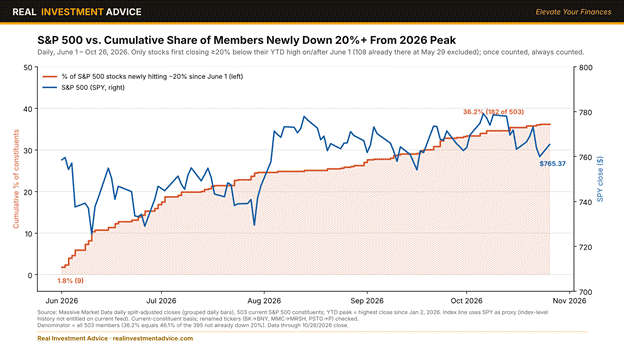
The S&P 500 has gone nowhere since June 1, but beneath the surface, a stealth bear market, driven by a series of significant value vs. growth rotations, has significantly impacted many S&P 500 members. Over the last five months, the S&P 500 is up about 1%, yet at some point during the period, 182 S&P 500 stocks, or 36% of the index, fell 20% or more from their 2026 highs. Furthermore, 108 stocks were already down 20% from their respective 2026 peaks before June. All in all, nearly 58% of the index has fallen at least 20% from peak to trough this year, which many consider bear-market territory. Market breadth like that usually signifies a declining market, not a flat one.
The relatively flat index reflects massive rotations, not a calm environment. The S&P 500 Growth ETF (IVW) is down 2.6% since June 1, while the Value ETF (IVE) is up 5.4%. That doesn’t nearly tell the whole story. Consider that the ratio of growth-to-value (IVW:IVE) fell 11% into late July, rallied 14% into early October, and has since given back 9%. Each swing of that ratio pushed one group of stocks lower while the other rose and compensated, keeping the S&P 500 relatively flat.
This churning could have a constructive outcome. A series of rolling corrections, as we have had, unwinds excesses stock by stock, leaving the S&P 500 with less need to correct. However, none of this heavy rotational activity means the S&P 500 is immune from a correction. But doing so would likely require both growth and value to decline at the same time.
What To Watch Today
Earnings
Thursday, October 29, 2026. Q3 reports from market-moving names.
| Company (Ticker) | Timing | EPS Est. | Rev. Est. |
|---|---|---|---|
| Eli Lilly (LLY) | Before open | $6.61 | $22.62B |
| Mastercard (MA) | Before open | $5.17 | $9.66B |
| Caterpillar (CAT) | Before open | $7.03 | $20.69B |
| Merck (MRK) | Before open | $2.09 | $17.34B |
| Quanta Services (PWR) | Before open | $5.03 | $10.98B |
| Amazon (AMZN) | After close | $1.96 | $202.24B |
| Intel (INTC) | After close | $0.40 | $16.49B |
| Sandisk (SNDK) | After close | $46.41 | $10.70B |
Source: Yahoo Finance consensus estimates, with dates and timing confirmed against the Nasdaq earnings calendar. As of October 28, 2026.
Economy
Thursday, October 29, 2026. GDP and PCE land together. All times ET.
| Time (ET) | Release (Period) | Prior | Consensus | Forecast |
|---|---|---|---|---|
| 8:30 AM | GDP Growth Rate QoQ, Advance (Q3) | 2.2% | 3.2% | 3.1% |
| 8:30 AM | GDP Price Index QoQ, Advance (Q3) | 6.1% | 3.2% | 3.6% |
| 8:30 AM | PCE Price Index YoY (Sep) | 3.4% | 3.6% | 3.6% |
| 8:30 AM | Core PCE Price Index MoM (Sep) | 0.2% | 0.3% | 0.3% |
| 8:30 AM | Core PCE Price Index YoY (Sep) | 3.0% | 3.1% | 3.1% |
| 8:30 AM | Personal Income MoM (Sep) | 0.2% | 0.3% | 0.3% |
| 8:30 AM | Personal Spending MoM (Sep) | 0.9% | 0.6% | 0.3% |
| 8:30 AM | Initial Jobless Claims (wk Oct 24) | 194K | 199K | 196K |
| 1:00 PM | 7-Year Note Auction | 5.085% | n/a | n/a |
Fed speakers: None scheduled. The first post-meeting remarks come Friday, when St. Louis Fed President Alberto Musalem speaks at 12:30 p.m. ET.
Source: Trading Economics (primary), confirmed against the BEA release schedule. As of October 28, 2026.
Market Trading Update
Yesterday, we discussed how AI concentration now sets the margin of error for the entire portfolio. Today, let’s take on the question filling our inbox. Is it time to trim value and buy beaten-down tech stocks?
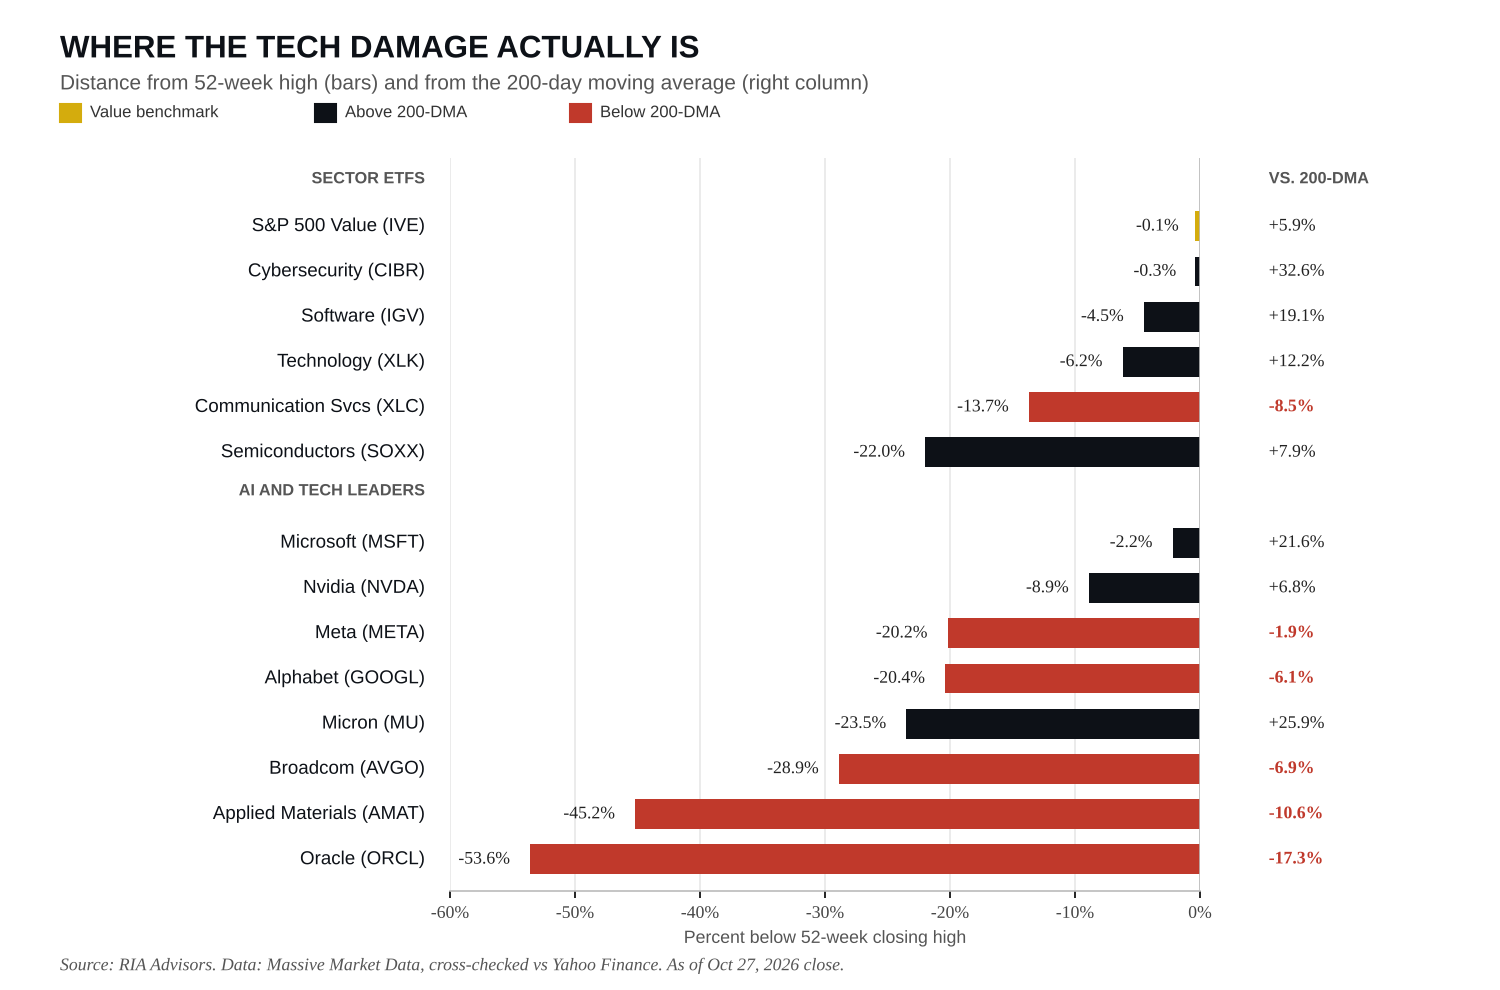
Start with the scoreboard. As of Tuesday’s close, the S&P 500 Value ETF (IVE) sat within 0.1% of its 52-week high. The iShares Semiconductor ETF (SOXX), meanwhile, closed at $511.06, 22% below its June 22 peak. Notice in the chart below that the ratio of semis to value remains 26 percentage points below its peak. On October 22, it closed under its lower 2-standard-deviation band as its RSI fell to 28.7. That was the first oversold reading since the April 2025 tariff panic, and the ratio has since climbed back above its 200-day average.

So my answer is yes, but as a rebalance and NOT a wholesale rotation. Bob Farrell’s Rule #1 says markets return to the mean over time. Value has run to the top of its range while semis sit near the bottom of theirs. Value isn’t broken. It’s simply where the gains are parked.
The cynic in the room will call this buying “cheap” for the sake of cheap. Fair enough, which is why beaten-down tech is not one trade. As the next chart shows, software (IGV) and cybersecurity (CIBR) trade near their highs. That’s where money hid while hedge funds dumped tech at the fastest pace since 2016. The real damage sits in chip equipment, custom silicon, and the platforms. Applied Materials is 45% below its high, and Broadcom is down 29%. Alphabet and Meta are each about 20% off their highs and below their 200-day averages.
Here’s where I would focus:
- The cash-rich platforms come first. Alphabet and Meta have enough non-AI revenue to sustain their spending despite slower payoff.
- Quality semis with pricing power come next. Nvidia and Broadcom remain the toll collectors of the buildout.
- Equipment gets the smallest dose. Applied Materials offers the most upside and the most risk until order books stabilize.
Avoid anything funding the buildout with borrowed money, from Oracle to the neoclouds.
Execution matters more than the call. Trim value holdings back to target weight, not below it, then add to tech in thirds. Microsoft and Alphabet reported last night, and Amazon reports tonight. Put the first third to work now. Add the second if the ratio holds its 200-day average near 2.09 through earnings, and the third on a reclaim of its 50-day near 2.26. A close below the October 22 low near 1.99 ends the trade.
Such is the nature of rebalancing. It always feels early, and it usually is. The bargain bin is full of stocks that looked cheap all the way down.

Reader Question: 20 Year Treasury Bonds
A reader sent us the following question:
I am contemplating buying a longer Treasury Bond. I see that the 20-year has a higher yield than the 10- and 30-year. Why wouldn’t I buy the 20-year?
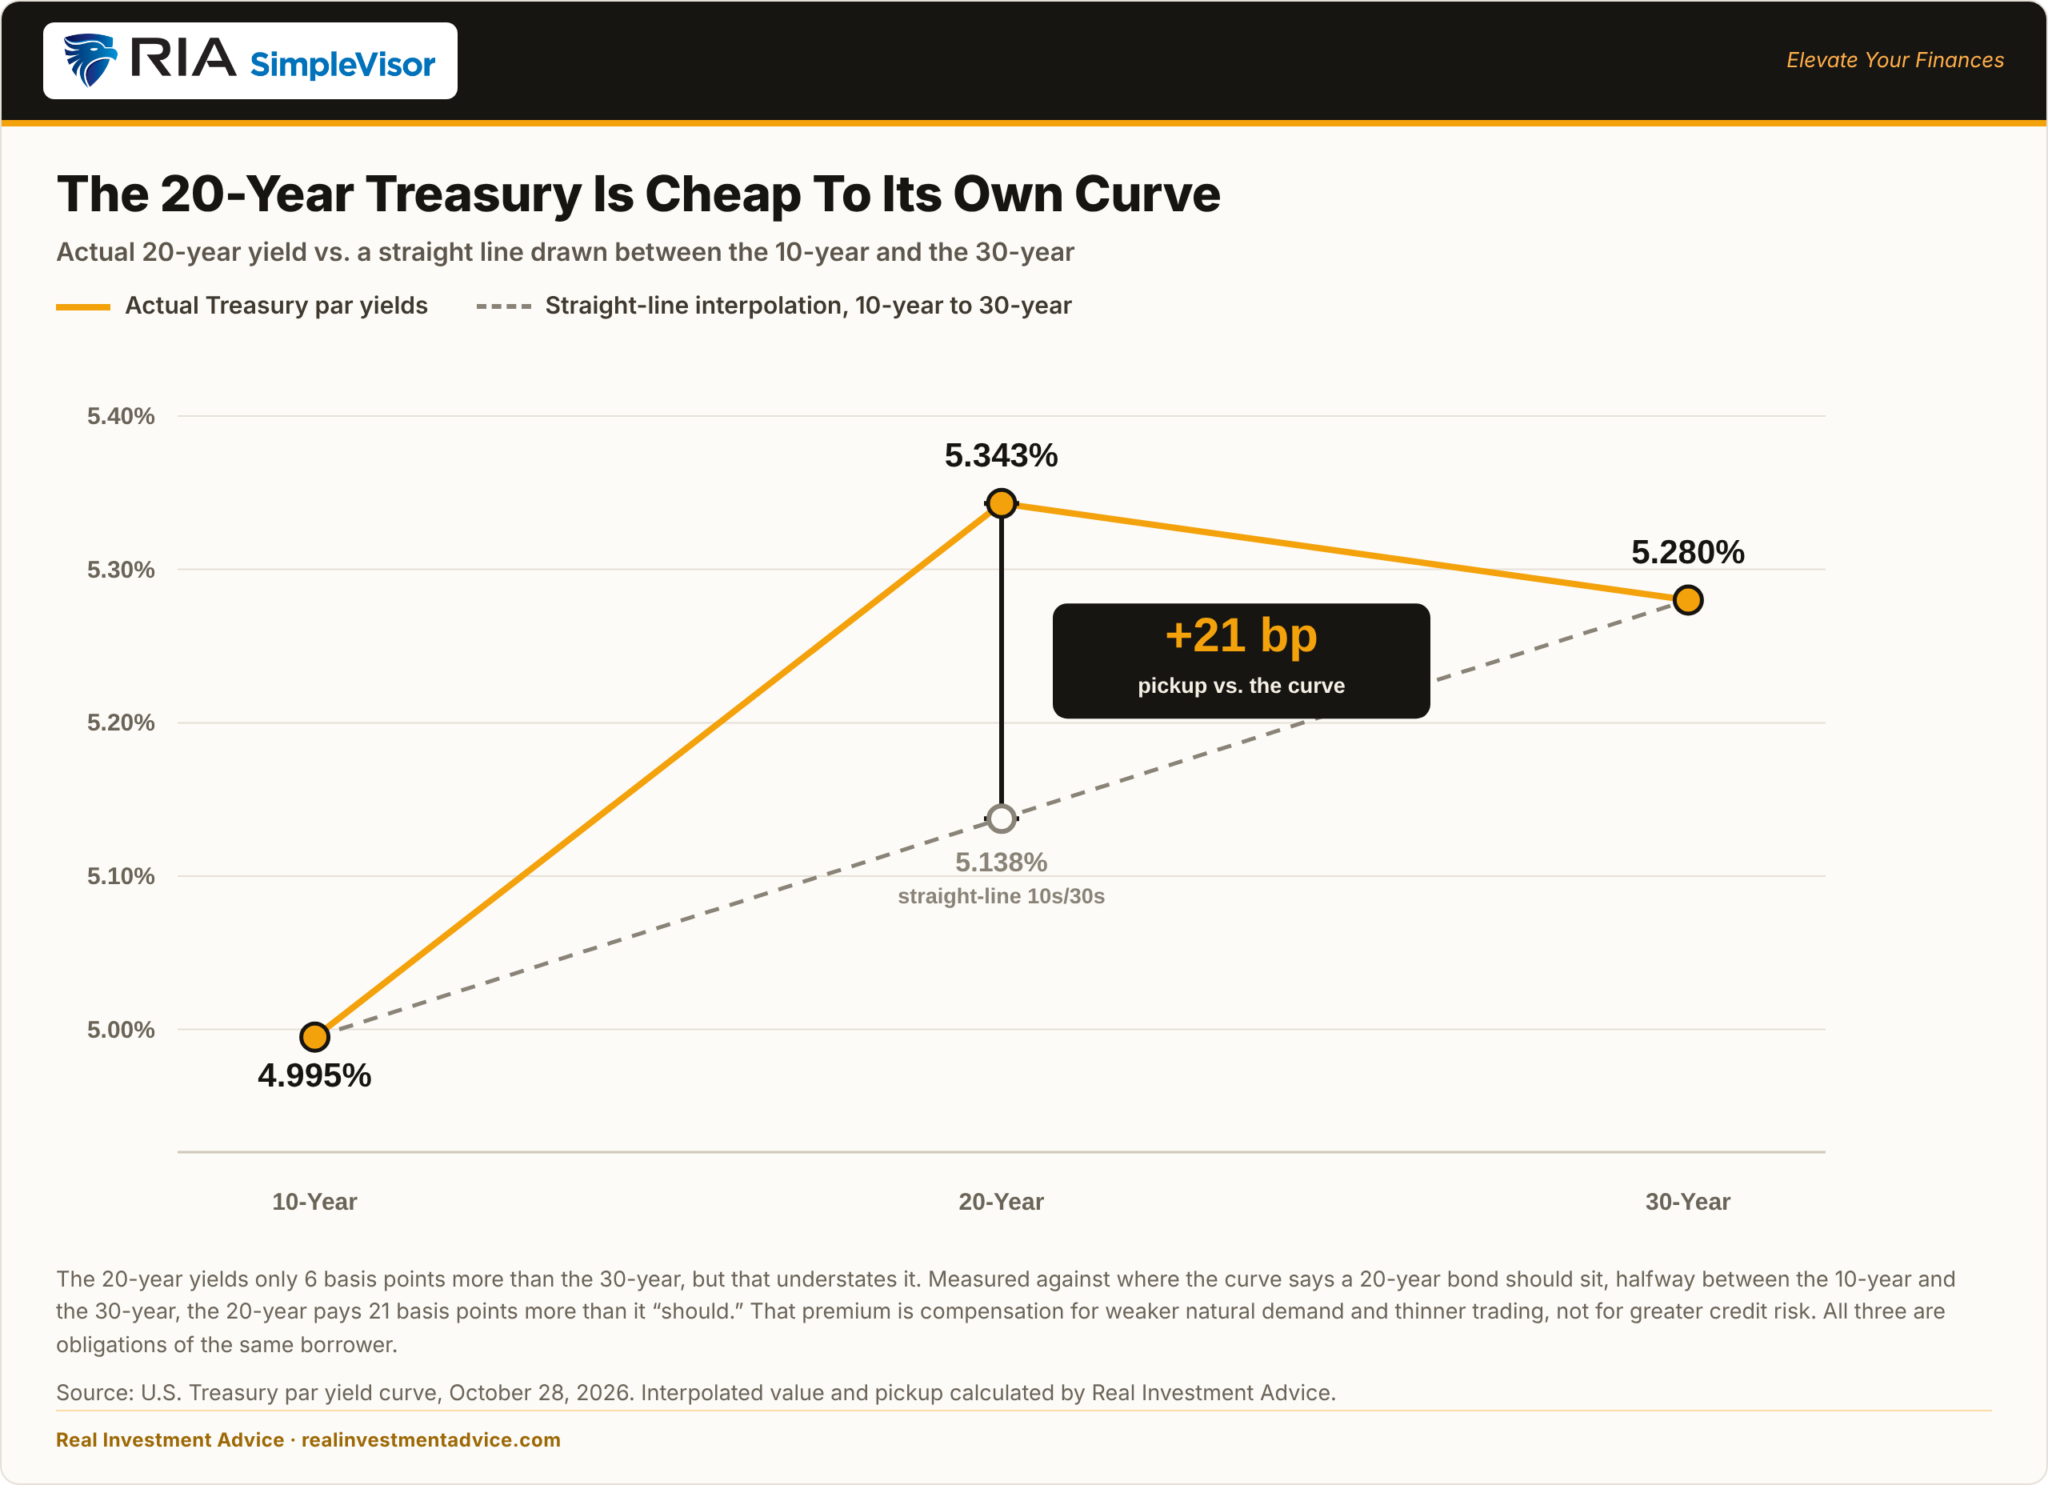
As we wrote our response, the 20-year Treasury yield was 5.343%, versus 5.280% on the 30-year and 4.995% on the 10-year. The curve humps in the middle of the long end, which, as our reader alludes to, is extra yield.
The reason for the premium yield has nothing to do with credit risk, since all 3 options are obligations of the US Treasury. It is a function of demand. Pension funds and insurance companies tend to buy 30-year bonds to match their long 30+ year liabilities. Second, the 30-year is one of the most actively traded across the curve; thus, liquidity is robust. Unlike the 30-year or 10-year, the 20-year doesn’t have an active natural buyer base. To wit, the Treasury stopped issuing it in 1986, brought it back in May 2020, and auction sizes are much smaller than 10- and 30-year auctions. The bottom line: the extra yield compensates the buyer for owning something slightly less liquid, not something riskier.
Three considerations for our reader:
- As we show below, the 20-year bond yields about 21 bps more than it should on interpolated levels, but only 6bps more than the 30-year.
- Given our reader is likely buying small amounts compared to institutions, the liquidity differences between 10-, 20-, and 30-year bonds for a retail investor should be minimal.
- Duration matters. At 12.2 years of modified duration, a 47-basis-point rise in yields erases a full year of coupon. Alternatively, a five-year Treasury note yielding 5% can rise over 1% before it offsets the coupon payment.
The Fed Risks Policy Error Fighting Oil Prices
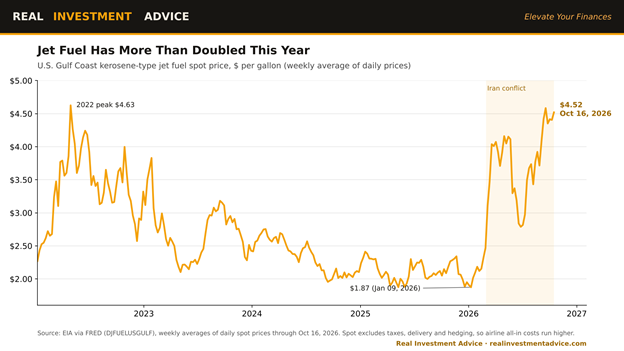
We got rebuked by some and applauded by others for asking, Are Bonds Pricing In A Fed Policy Mistake? Given the strong feelings for the topic, we think it is worth digging into our question a little deeper. To help us, United Airlines’ recent earnings report offers a timely illustration of inflation mechanics and one that supports our growing concern that the Fed, by raising rates, risks making a policy error.
United reported that its fuel expenses jumped 62% from a year ago as the average price it paid for jet fuel rose to $3.90 a gallon. Importantly, United’s CEO Scott Kirby said the company “will not recapture 100% of fuel costs in Q4.” Not “recapturing 100% of fuel costs” means United raised fares to offset jet fuel costs. Whether they raised fares enough to cover higher energy costs is irrelevant to this article. What matters is that higher energy costs are being passed through to consumers via airline fare inflation.

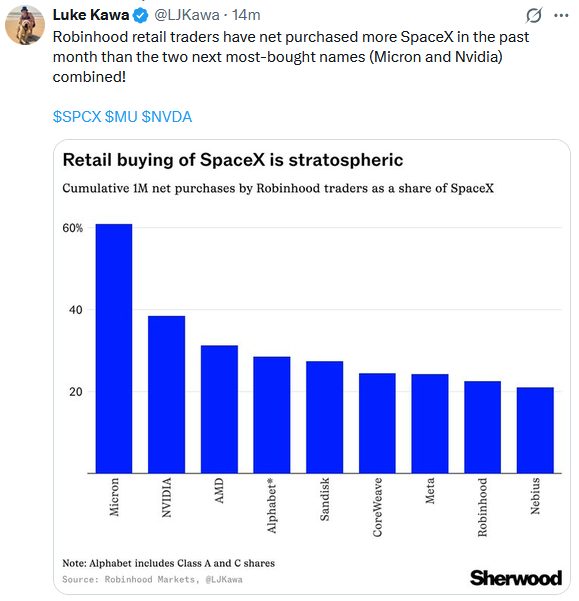
Tweet of the Day
Trading Rules With Desktop Printout
“Want to achieve better long-term success in managing your portfolio? Here are our 15-trading rules for managing market risks.”
Please subscribe to the daily commentary to receive these updates every morning before the opening bell.
If you found this blog useful, please send it to someone else, share it on social media, or contact us to set up a meeting.