We got rebuked by some and applauded by others for asking, Are Bonds Pricing In A Fed Policy Mistake? Given the strong feelings for the topic, we think it is worth digging into our question a little deeper. To help us, United Airlines’ recent earnings report offers a timely illustration of inflation mechanics and one that supports our growing concern that the Fed, by raising rates, risks making a policy error.
United reported that its fuel expenses jumped 62% from a year ago as the average price it paid for jet fuel rose to $3.90 a gallon. Importantly, United’s CEO Scott Kirby said the company “will not recapture 100% of fuel costs in Q4.“
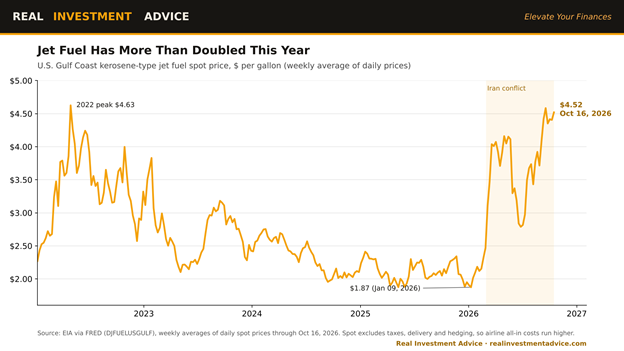
Not “recapturing 100% of fuel costs” means United raised fares to offset jet fuel costs. Whether they raised fares enough to cover higher energy costs is irrelevant to this article. What matters is that higher energy costs are being passed through to consumers via airline fare inflation.
Jet Fuel Is Fueling Inflation
The CPI data confirms that higher fuel costs are fueling airfare prices. To wit, airline fares rose 22.4% over the last year. While airline fares rose mainly because of higher energy costs, those increases still factor into core CPI, even though core CPI excludes energy prices. The BLS classifies airfares as a transportation service, not energy.
With a weight of roughly 1.1% of the BLS core CPI figure, airfares alone added about a quarter point to the 2.56% core CPI annual reading for September. In other words, the Iran-driven oil shock and recent events in the Ukraine-Russia war are leaking into the inflation measure the Fed believes excludes energy prices.
From an investment perspective, this wonky CPI discussion could matter for financial markets if the takeaway is that the Fed is misgauging core inflation. A false reading of oil’s impact on CPI, given its transitory nature, makes the Fed more prone to policy error with negative implications for the economy and ultimately the stock market.

Oil Exposure In The CPI Figure
Airfares are not the only CPI items sensitive to oil prices and contributing to core CPI. Accordingly, we looked for other CPI items whose prices strongly correlate with oil. We weren’t just looking for a strong correlation; we also considered the time lag between energy price changes and when those changes affected selected goods. With this logic, we built our own version of core CPI that strips out energy and energy-related items with high correlations and short lag times.
The model tests the correlation of CPI components against WTI crude prices since 2008. The table below shows the results. We grouped candidates for exclusion into 3 tiers:
- Tier 1, direct petroleum fuels: gasoline, diesel, and other motor fuels, fuel oil, propane, and kerosene. These products have the tightest link to crude oil, and the BLS excludes them from the core CPI, as do we.
- Tier 2, fuel-intensive transportation: airline fares, other intercity transportation (bus, rail, and ship fares), and delivery services. Jet fuel is a large share of airline operating costs, and parcel carriers add fuel surcharges. Delivery services are the closest the CPI comes to measuring trucking costs affected by diesel prices. We exclude these from our core CPI while the BLS includes them.
- Tier 3, weak or lagged: car rental, moving and freight, local transit, tires, and vehicle accessories. These prices are linked to oil, but the data show a delayed relationship. We keep them in our core CPI measure.
Interestingly, moving, storage, and freight- the item that sounds most like trucking- have a correlation of only 0.14. Pricing for those services is much more dominated by labor costs.
We placed electricity and natural gas in Tier 1 as the BLS already removes both from core CPI. Combined, Tiers 1 and 2 account for 7.51% of the CPI.
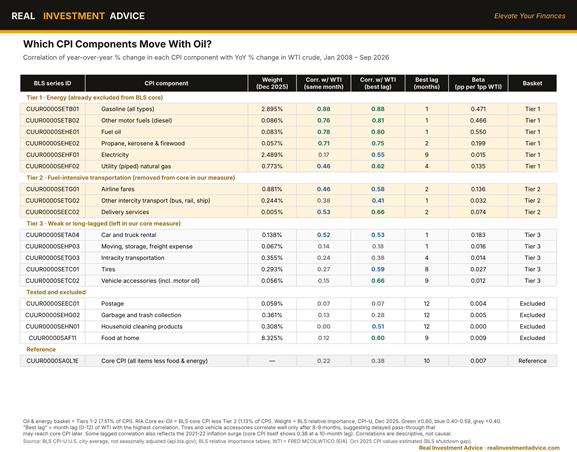
Tier 3 is interesting. It includes tires and vehicle accessories, including motor oil, which show little relationship with oil prices in the same month, with correlations of 0.27 and 0.15. However, their correlations jump to 0.59 and 0.66 when compared to oil prices nine months earlier. Synthetic rubber, carbon black, and lubricants are petroleum-based, but manufacturers and retailers pass those costs through slowly. Car rental has a modest 0.52 correlation, but renters buy their own fuel.
Tier 3 prices are affected by oil, but with a long enough lag that we thought it best to exclude them to give us a more current assessment of inflation. However, because oil prices started rising in March, the impact on Tier 3 prices is starting to reach core CPI. Thus, our core CPI is slightly higher than reality.

Oil Explains The Inflation Rebound
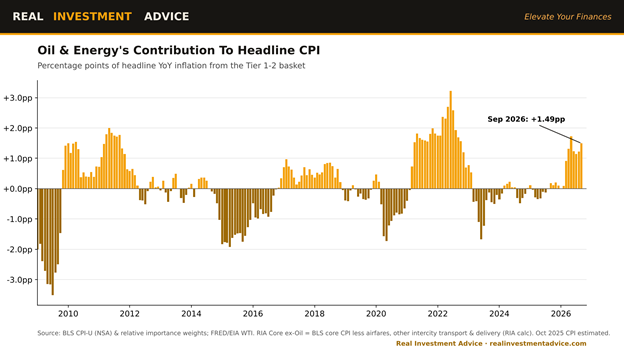
The first graph shows that our Tier 1 and 2 basket tracks crude closely, with a 0.83 correlation over the last 25 years.
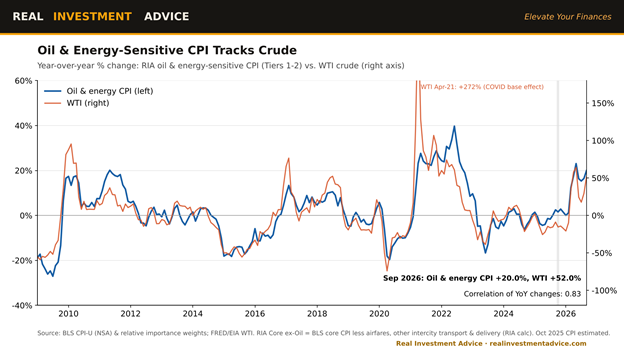
As shown below, oil and energy-related items added 1.49 percentage points to headline CPI. That is large but not unprecedented. They added 3.23 points in June 2022 and subtracted 3.51 points in July 2009.
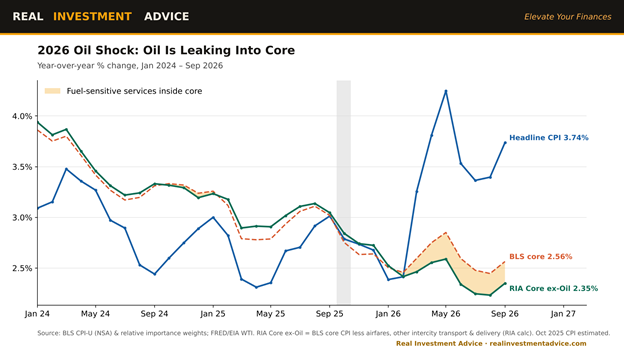
The next graph shows how high oil prices impact the BLS headline CPI and its core CPI, as well as our core CPI model. In January, BLS core CPI and our core ex-Oil were nearly identical at about 2.5%. As oil rose, the BLS core climbed to 2.85% in May, while our measure peaked at 2.59%. Most recently, the BLS core was 2.56%, versus 2.35% for our Core. The gold shading represents the impact of fuel-sensitive services inside core CPI.
Over the longer term, our core reading and the BLS core CPI are very similar. That makes sense, as Tier 2 is a small share of core prices. The two diverge only during oil shocks, like today.
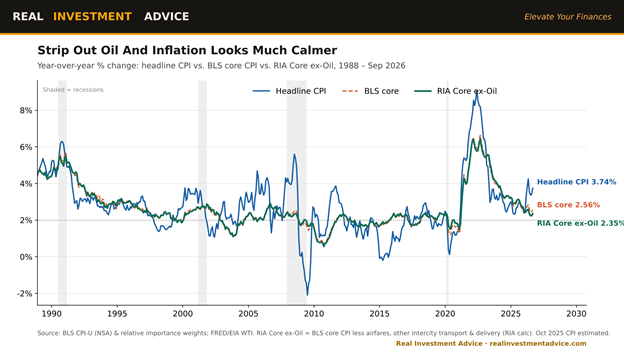
While the 20-30 bps differential between our model and the BLS gauge is relatively small, we think our model overestimates core inflation and the differential is likely larger. As we discussed, we didn’t exclude some of the tier 3 items whose prices are rising with oil prices. We also didn’t exclude other items whose prices are partially affected by higher oil prices. All in all, a more exhaustive analysis using our model would likely render a core CPI reading much closer to the Fed’s 2% inflation target.
Policy Is Already Restrictive
The Fed raised rates by 25 basis points in September to a range of 3.75% to 4.00%. According to the minutes:
Most judged that another rate increase would likely be appropriate by year-end.
The median Fed projection now puts the Fed Funds rate at 4.1% at year-end. As we wrote recently, Dallas Fed President Lorie Logan thinks another 50 basis points may be needed, and other members have echoed her sentiment.
The Fed gauges how restrictive policy is by comparing Fed Funds to inflation. Using BLS headline CPI, the real Fed Funds rate is roughly zero, which supports the hawks’ argument that policy is not restrictive. Using our Core CPI, the real rate is 1.40%.
The Fed’s quarterly economic projections (SEP) provide some context for gauging whether policy is restrictive or easy. Its longer-run Fed Funds estimate is 3.2%, alongside a 2% inflation target. That implies the Fed views a real rate of about 1.2% as neutral. Using our core figure, Fed policy is already .20% above the Fed’s neutral rate. If the Fed hikes in October or December, that number will rise.

Long-Term Rates Make Policy Tighter
Consumers and businesses do not borrow at the Fed Funds rate. Mortgages, corporate bonds, and many bank loans are priced off longer-term Treasury yields. The 10-year Treasury sits around 5%. Subtracting our core CPI, the real 10-year yield is 2.64%, the highest since 2010. The average since 2008 is just 0.26%, as we share below.
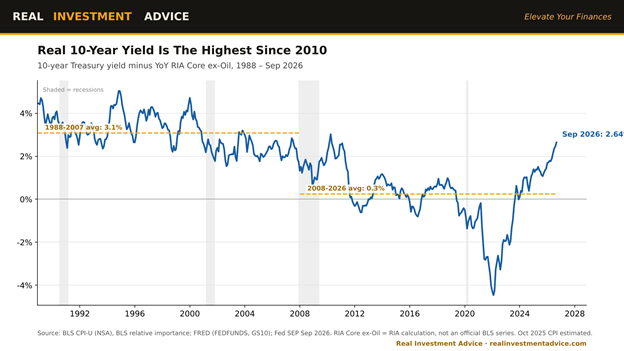
Borrowing costs this far above inflation weigh on housing, capital spending, and credit-sensitive sectors. In other words, the bond market is doing much of the Fed’s tightening for it.
Is The Fed Overreacting To Oil?
Oil prices did not rise because the economy overheated. WTI averaged $58 in December 2025 and has oscillated between $80 and $105 as the conflict with Iran and the threat to shipping through the Strait of Hormuz disrupted supply.
Higher interest rates will not reopen shipping lanes or pump a barrel of oil. Rate hikes work by slowing demand, and their full effects can take a year or more to show up. If the Fed tightens further in response to oil-driven inflation, it risks slowing the economy. The prolonged impact of raising the Fed Funds rate, coupled with the recent surge in long-term bond yields, is exactly the kind of over-restrictive policy mistake the bond market may be worried about, helping explain the recent decline in long-term yields.
Summary
Our core CPI is about 20 to 30 bps below the BLS version, with both trending flat to lower. As we showed, unlike the headline CPI number, they are not overly concerning, though they are above the Fed’s 2% target.
This suggests the Fed may be fighting higher oil prices with a policy designed to slow economic growth and tighten financial conditions. If the BLS core CPI and our core CPI continue to drift toward 2% or fall below it, the risk of policy increases with each Fed Funds hike and each tick higher in longer-term yields.