


“Bears are like broken clocks, they are only right twice a day.”
This is a statement that is often thrown out during rising bull markets by the inherently optimistic crowd. However, such a statement really points to the ignorance of those that make such a claim. Why? Because if the “bears” are right twice a day, then the “bulls,” logically speaking, are wrong twice a day as well. In the game of investing, it is the timing of being “wrong” that is the most critical.
The chart below shows the bullish and bearish cycles, in terms of “real,” inflation-adjusted price, for the S&P 500 from 1871-present.

Throughout history, bull market cycles are only one-half of the “full market” cycle. This is because during every “bull market” cycle the markets and economy build up excesses that are then “reverted” during the following “bear market.” In the other words, as Sir Issac Newton once stated:
“What goes up, must come down.”
The next chart shows the full market cycles over time. Since the current “full market” cycle is yet to be completed I have drawn a long-term trend line with the most logical completion point of the current cycle.
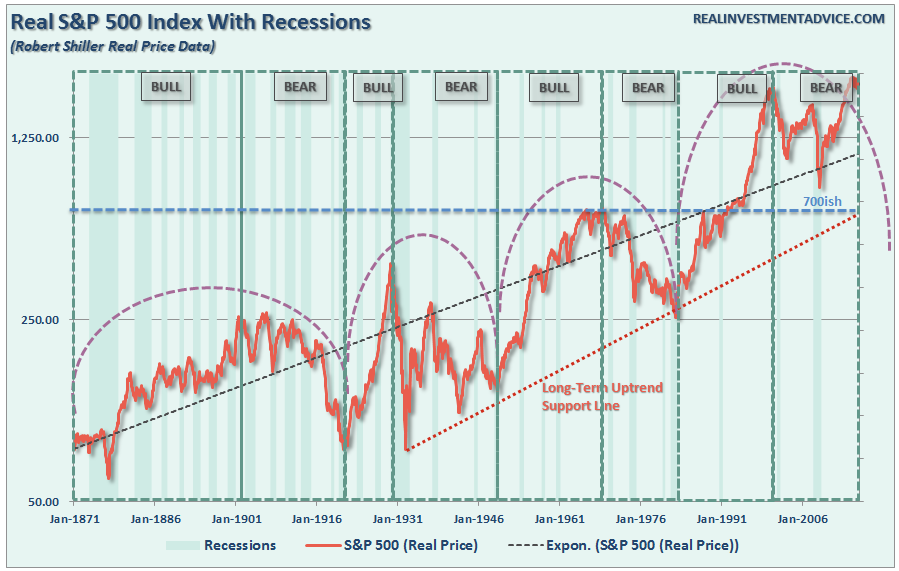
[Note: I am not stating that I “believe” the markets are about to crash to the 700 level on the S&P 500. I am simply showing where the current uptrend line intersects with the price. The longer that it takes for the markets to mean revert the higher the intersection point will be. Furthermore, the 700 level is not out of the question either. Famed investor Jack Bogle stated that over the next decade we are likely to see two more 50% declines. A 50% decline from current levels would put the market below 1000 which would likely be in the “ballpark” of completing the current full market cycle.)
The Problem Of Time
The biggest fallacy perpetrated on investors today is how long-term investing is promoted. A quick glimpse at the chart above tells you that if you had just invested in stocks in 1871, and held them, that you would be wealthy beyond imagination today. Unfortunately, you died long before you ever realized such wealth.
During my morning routine of caffeine supported information injections, I ran across several articles that just contained generally bad investment advice and poorly formed analysis. Each argument was hinged on the belief that bull markets last indefinitely, bear markets are simply an opportunity to “buy” more, and investing for the long term always works.
This got me to thinking about the how we are told to invest in the markets. When markets are rising, and valuations are increasing, individuals are berated by financial media and Wall Street into shoving their hard earned “savings” into a rising risk environment. They are always told to “buy” but never to “sell.” When markets invariably revert, they are told to “hold on,” “average down,” or “buy more.” After all, you are investing for the long term, right?
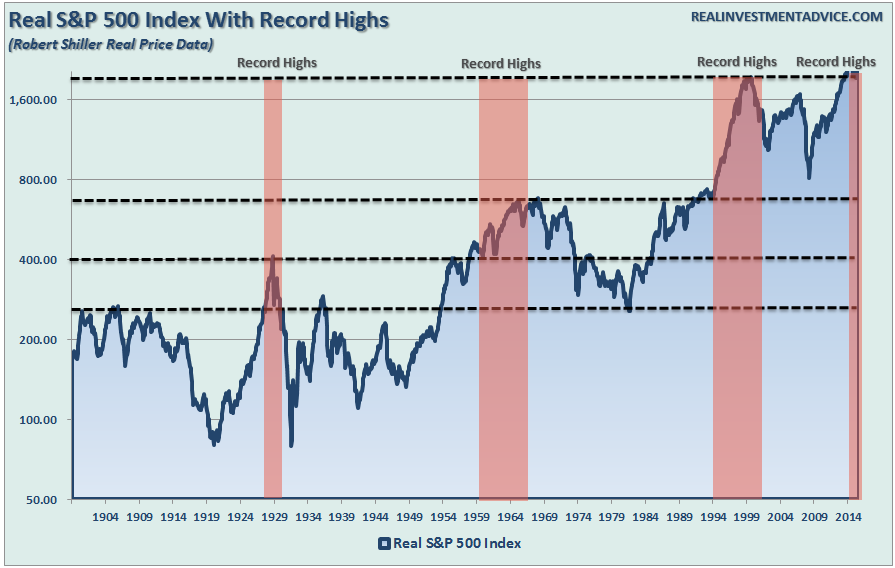
There are several problems which need to be addressed. First, while markets have indeed risen over long-term time frames, the markets have spent roughly 95% of their time making up for previous losses. The chart below shows this fairly clearly.
Secondly, exactly how much time do individuals really have? While it certainly sounds charming “youngsters” should throw their money into the Wall Street casino, the reality is this is hardly the case. Youngsters rarely have sufficient levels of investible savings to actually invest. Between starting a career, raising a family and maintaining their specific standard of living there is rarely little remaining to be “saved.” For most, it is not until the late 30’s or early 40’s that individuals are earning enough money to begin to save aggressively for retirement and have enough investable capital to actually make investing work for them after fees, expenses and taxes. Therefore, by the time most achieve a level of income and stability to begin actually saving and investing for retirement – they have, on average, about 40 years of investable time horizon before they expire.
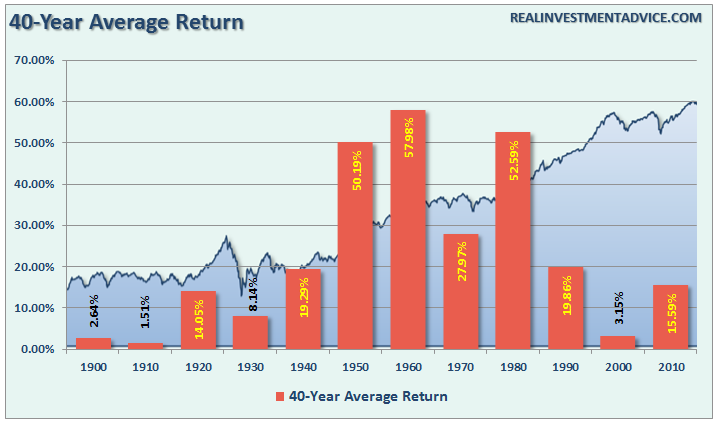
I have prepared two different charts to show you the impact of investing over 40-year time spans. I used an initial investment of $1000 at the beginning of each decade and analyzed the capital appreciation for the ensuing 40-year period. In this regard, we can garner a clearer picture about the impact of both secular bull and bear market cycles on the total investment returns. [Note: The data below uses Shiller’s price data on a nominal basis and is based on monthly capital appreciation only.]
The first chart shows the average annual return for each starting decade.
The next chart shows the capital appreciation of a $1000 initial investment.
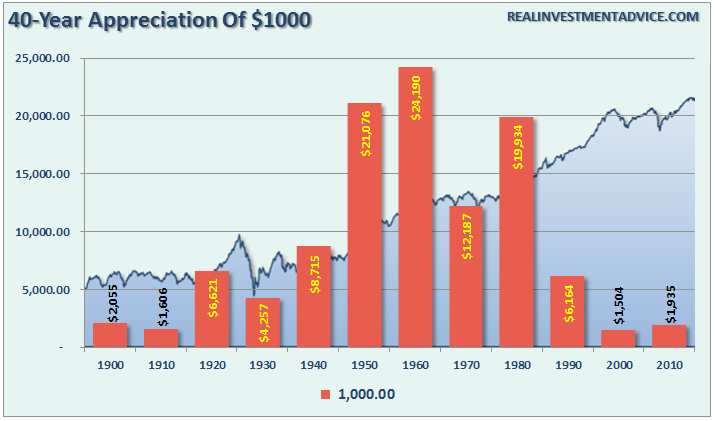
“Importantly, the major difference on the ending result depends greatly on ‘WHEN’ you start investing. If you started investing during the 50’s and 60’s, then you were lucky enough to capture the raging ‘bull market’ of the 80’s and 90’s which offset the secular bear market of the 70’s. However, if you started in 1990, so far, results haven’t been all that great as the secular bear market of the 21st century has slowly chipped away at the gains of the 90’s.”
The problem for most is time. While we can manufacture more “money,” we can not create more “time.”
The reality is that no one has 100 years to invest to achieve the long-term investment returns often touted on Wall Street. What all investors do face is the reality of the incredible time crunch between the beginning and end of the “accumulation phase.” The problem is that the “accumulation phase” is generally much shorter than the “distribution” phase particularly as life expectancy creeps ever closer to 100 years of age. Therefore, investing mistakes made early on have a tremendous impact on the end result due to the lack of “time.”
Psychological Failure
In reality, the problem is far worse than what is shown. Dalbar Research produces an annual report on investor behavior that clearly shows investors compound their investment problems by “buying high and selling low.” The growth of the markets, as shown in the charts above, has NEVER been achieved by investors when including the impact of fees, expenses, taxes and emotional mistakes.
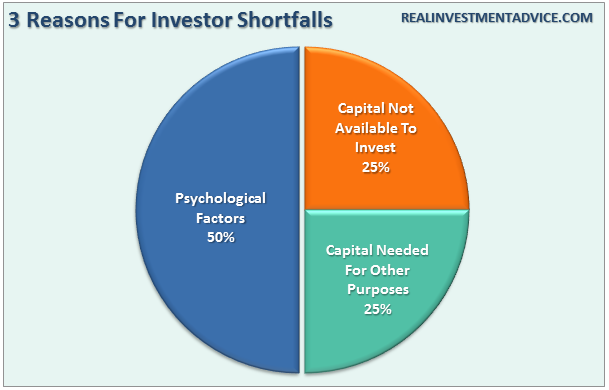
Despite the media’s commentary that ‘if an investor had ‘bought’ the bottom of the market…’ the reality is that few, if any, actually did. The biggest drag on investor performance over time is allowing ‘emotions’ to dictate investment decisions. Investor studies show “psychological factors” account for between 45-55% of underperformance. From Dalbar:
“Analysis of investor fund flows compared to market performance further supports the argument that investors are unsuccessful at timing the market. Market upswings rarely coincide with mutual fund inflows while market downturns do not coincide with mutual fund outflows.”
In other words, investors consistently bought the ‘tops’ and sold the ‘bottoms.’ The other two primary reasons of underperformance from the study related to a lack of capital to invest. This is also not surprising given the current economic environment where roughly 80% of Americans lack sufficient savings to meet a $500 emergency.
These psychological investment mistakes are never discussed by the mainstream media, but they are real and extremely destructive to long-term returns. What is interesting is that these investment mistakes are generally made during the first half of the full-market cycle as “greed” overtakes a logical and disciplined investment process. Those mistakes, however, are only recognized during the second half of the cycle as the “panic to sell” overwhelms individuals.
The Fallacy Of The “Broken Clock”
In this past weekend’s newsletter, I quoted John Hussman who put a very fine point on the importance of understanding the “full market cycle:”
“Put simply, most apparent “opportunities” to obtain investment returns above zero in conventional assets over the coming decade are based on a misunderstanding of valuations, total returns, and historical yield relationships. At current valuations, virtually everything is priced for a decade of zero. The unwinding of these speculative extremes is likely to be chaotic, and will likely occur over a shorter horizon than investors imagine. That chaos, driven not by central bank tightening but by an emerging default cycle, will usher in fresh investment opportunities in conventional assets, where presently there are none.
Looking beyond the near-term, my view is that a ‘permanently high plateau’ is unlikely, and we will instead see a violent unwinding of recent speculative extremes over the completion of the current market cycle, even if central banks ease aggressively, as they did throughout the 2000-2002 and 2007-2009 collapses. Corporate income growth and profit margins have already begun to narrow from their extremes, and the default cycle has already turned higher. The completion of this cycle won’t arrive because central banks suddenly become enlightened enough to abandon their recklessness. It will arrive precisely because they have sustained yield-seeking speculation for too long already; because they have amplified the vulnerability of the debt and equity markets to normal economic fluctuations; and because the consequences of this fragility are now fully baked in the cake.”
While John is absolutely correct, he is often dismissed because of his bearish overtone. In my opinion, this is a mistake. However, it is exactly that dismissal which is indicative of the willful blindness to the underlying problems and the inherent disaster to long-term goals that awaits many unwary individuals in the markets currently.
As I have often stated, I am not bullish or bearish. My job as a portfolio manager is simple; invest money in a manner that creates returns on a short-term basis but reduces the possibility of catastrophic losses which wipe out years of growth.
In the end, it does not matter IF you are “bullish” or “bearish.” The reality is that both “bulls” and “bears” are owned by the “broken clock” syndrome during the full-market cycle. However, what is grossly important in achieving long-term investment success is not necessarily being “right” during the first half of the cycle, but by not being “wrong” during the second half.
Lance Roberts

Lance Roberts is a Chief Portfolio Strategist/Economist for Clarity Financial. He is also the host of “The Lance Roberts Show” and Chief Editor of the “Real Investment Advice” website and author of “Real Investment Daily” blog and “Real Investment Report“. Follow Lance on Facebook, Twitter, and Linked-In

Lance Roberts is a Chief Portfolio Strategist/Economist for RIA Advisors. He is also the host of “The Lance Roberts Podcast” and Chief Editor of the “Real Investment Advice” website and author of “Real Investment Daily” blog and “Real Investment Report“. Follow Lance on Facebook, Twitter, Linked-In and YouTube
Customer Relationship Summary (Form CRS)
Also Read


