
Is the recent correction a “bear trap?” Or is the bounce just a selling opportunity for a return of the bear market?
“A bear trap occurs when there is a bearish correction or reversal amid an overall uptrend. A downward correction sees shorting temporarily overcoming buying pressure, leading to a short-term price fall. The decline may be small or large, potentially failing at recent price highs in the uptrend.
The downward correction may last several trading sessions, giving a false impression that the market has indeed reversed. Traders might take short positions to profit on falling stock prices, but when buyers begin seeing prices drop and increase their buying activity, the market won’t support prices falling further. It then rapidly resumes its uptrend.” – Investopedia
Such will be the center of the debate after the recent market correction that tested support at the 200-DMA. However, as we discussed at the beginning of February, a correction was needed if the bull market was going to continue. To wit:
“If the “bear market” is “canceled,” we will know relatively soon. To confirm whether the breakout is sustainable, thereby canceling the bear market, a pullback to the previous downtrend line that holds is crucial. Such a correction would accomplish several things, from working off the overbought conditions, turning previous resistance into support, and reloading market shorts to support a move higher. The final piece of the puzzle, if the pullback to support holds, will be a break above the highs of this past week, confirming the next leg higher. Such would put 4300-4400 as a target in place.”
Such is precisely what happened with the market testing, and holding, the rising trend channel from the October lows. The market also held the 200-DMA, which, as noted, confirmed the bullish breakout above a level that proved to be resistance in 2022.
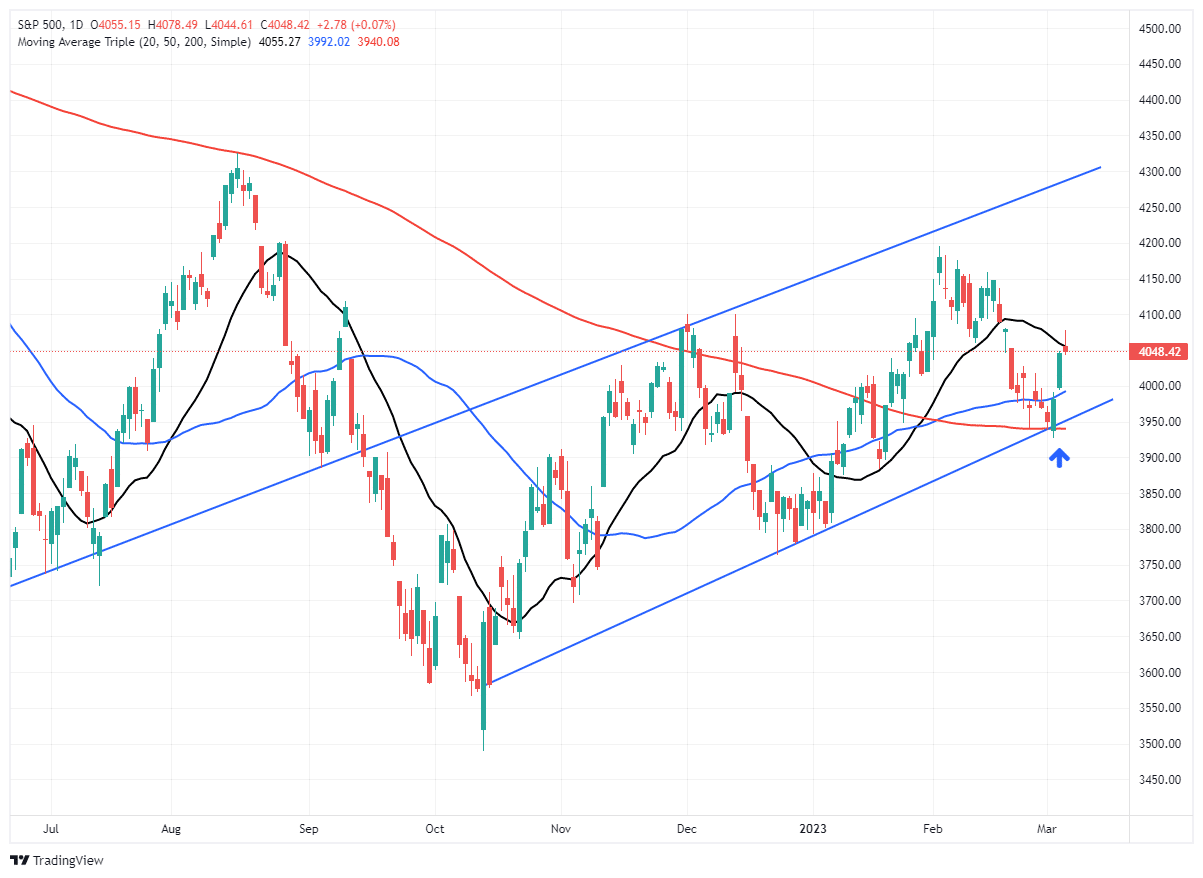
Furthermore, as discussed in the past weekend’s newsletter, the MACD “sell signal” is close to reversing to a buy signal.
“Importantly the MACD ‘sell signal,’ which warned of the recent correction, is beginning to reverse. However, that reversal occurs midway through regular oscillation, suggesting that the upside is somewhat limited.”
The chart below is longer-term than what we showed in the newsletter but better indicates the validity of the “sell signal.” The “buy signals” were also good opportunities to trade rallies during last year’s decline.

While there are certainly many fundamental reasons to remain “bearish” on the markets, The technical backdrop continues to confirm and reaffirm a more bullish trend developing.
If this is a “bear trap,” then Jim Cramer may be correct when he says:
“If we’re in a bull market, and I think we are, you have to prepare yourself,” he said, adding, “We have to prepare for the down days now because in a bull market, they’re buying opportunities.” – CNBC
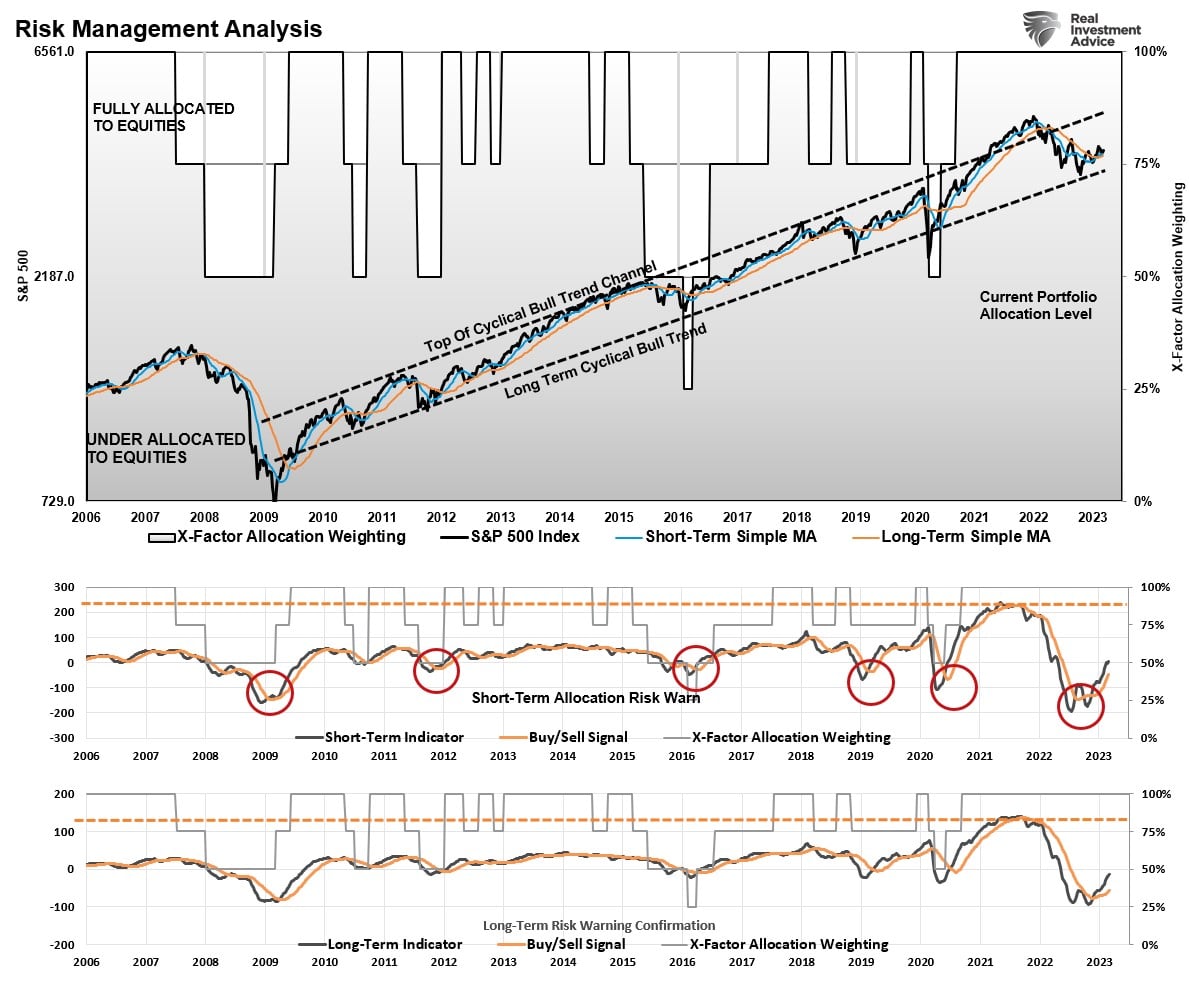
While the short-term technicals are bullish, the longer-term technicals also remain bullishly biased.

Long-Term Technicals Remain Bullish
Daily price charts can provide a short-term view of market psychology from days to weeks. The problem with daily price analysis is volatility can cause short-term swings in the market that can disconnect from the market’s underlying trend or fundamental data.
If we slow that price action by examining weekly pricing data, the volatility gets smoothed out. Such reveals a clearer picture of the market delivering a more bullish message.
The S&P 500 has scored seven weekly closes above its 40-week moving average, which is a positive sign. In addition, the market has cleared the 40-week DMA downtrend line from January and December 2022, suggesting a potential bullish turn in the trend. Assuming supports hold, the next major resistance beyond the post-FOMC peak at 4195 is the August 2022 peak at 4325 (orange dashed line).
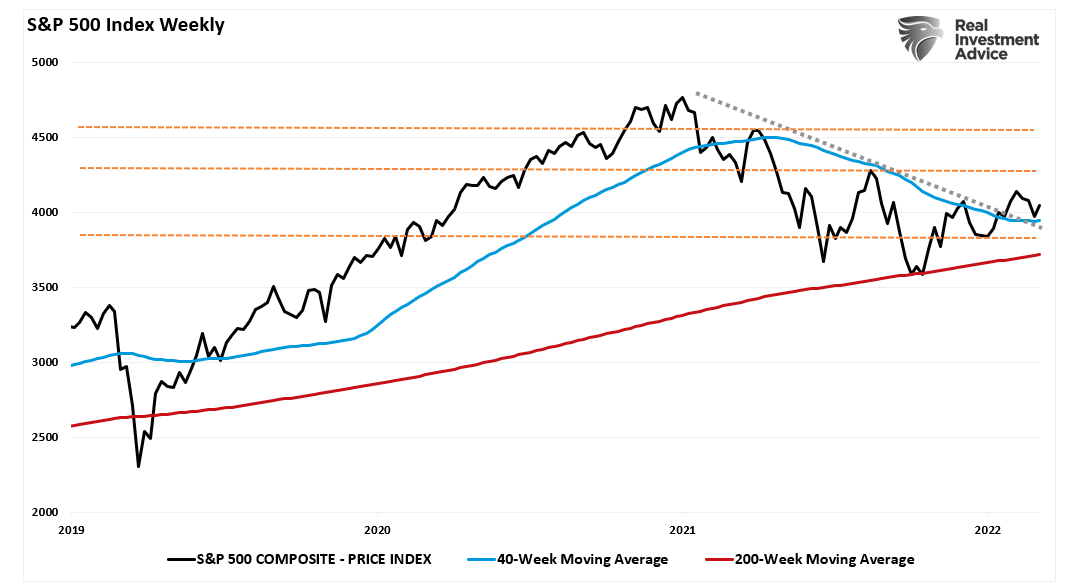
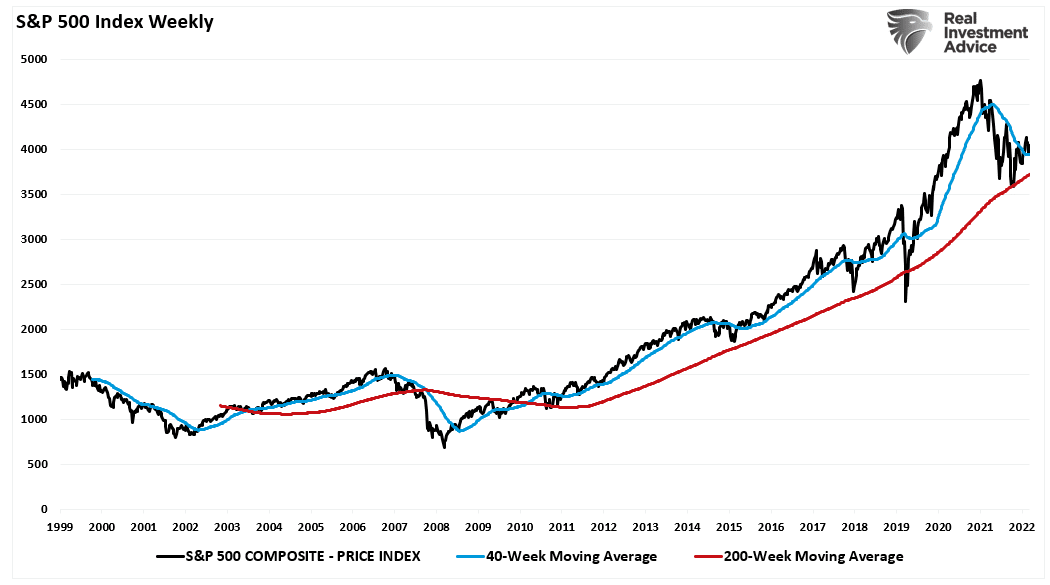
Furthermore, the October low held support at the 200-week moving average, which remains support for the market since the 2009 lows.
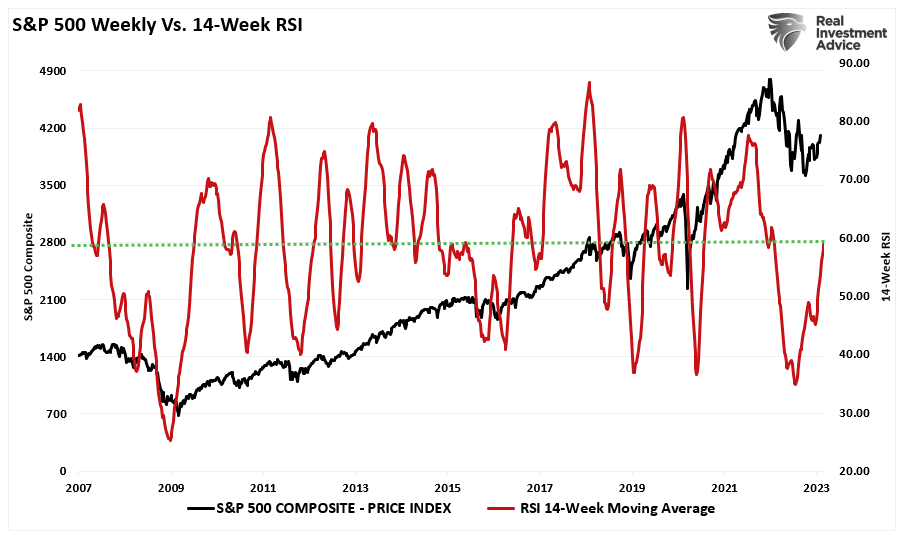
The weekly 14-period relative strength index (RSI) has also turned sharply positive and is above 50, suggesting markets are back in a bullish trend. That index broke above resistances that capped bear market rallies in April, August, and December 2022.
Lastly, our most critical bullish signals are the short- and intermediate-term Moving Average Convergence Divergence (MACD) indicators. We post this weekly chart in our website’s 401k plan management section. Both sets of weekly MACD indicators have registered buy signals from levels lower than during the financial crisis. The market has also broken above both weekly moving averages and, as noted above, held the long-term bullish trend line.

Bull Now, Bear Later
Given the abundance of bullish signals, we must give some credence to the message and invest accordingly. However, ample fundamental evidence supports the argument that the “bear market” is not yet dead.
The markets have grown “manic,” quickly swinging wildly from extreme pessimism to optimism. Such is not the basis on which investing activity resides but rather where speculation abounds in its purest form.
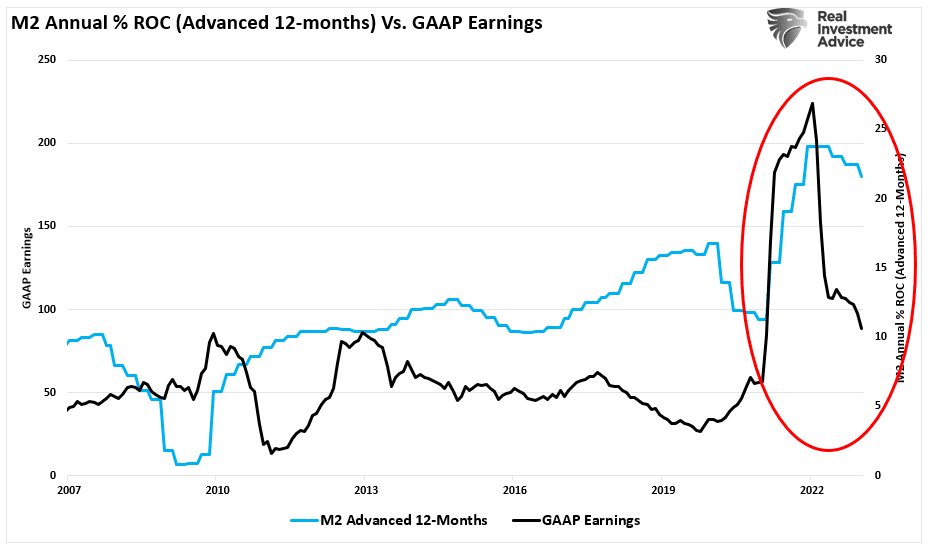
Over the next 12 months, the “bear market is over” thesis will depend much on the Federal Reserve, Government policies, and inflation. The recent passage of the “Inflation Reduction Act” will increase taxes on corporations and households. Such will reduce growth and profit margins along with stubbornly high inflation. Furthermore, the surge in the money supply will continue to reverse, reducing earnings growth rates further.
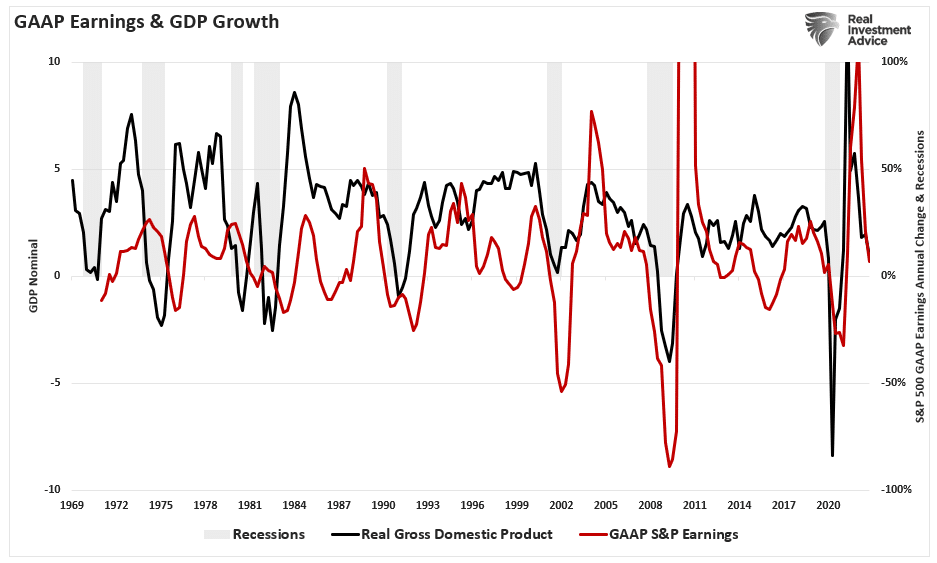
Of course, tighter monetary from the Federal Reserve is weighing on economic growth, which will continue later into the year, with a recession become more likely with each rate hike. Notably, there is a high correlation between economic growth and earnings.
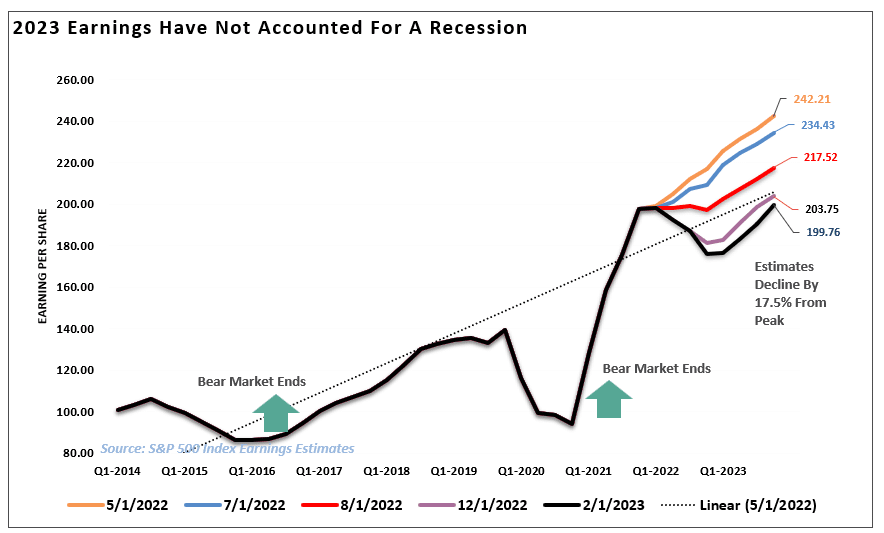
Such is an important backdrop. The markets are pricing earnings of roughly $199 per share by the end of 2023, down from $242 in July. However, if the Fed continues its fight against inflation and triggers a recession, earnings could drop to $170/share. At a generous forward multiple of 18x those earnings, you are looking at a fair market calculation closer to 3000 on the S&P 500 index.

Conclusion
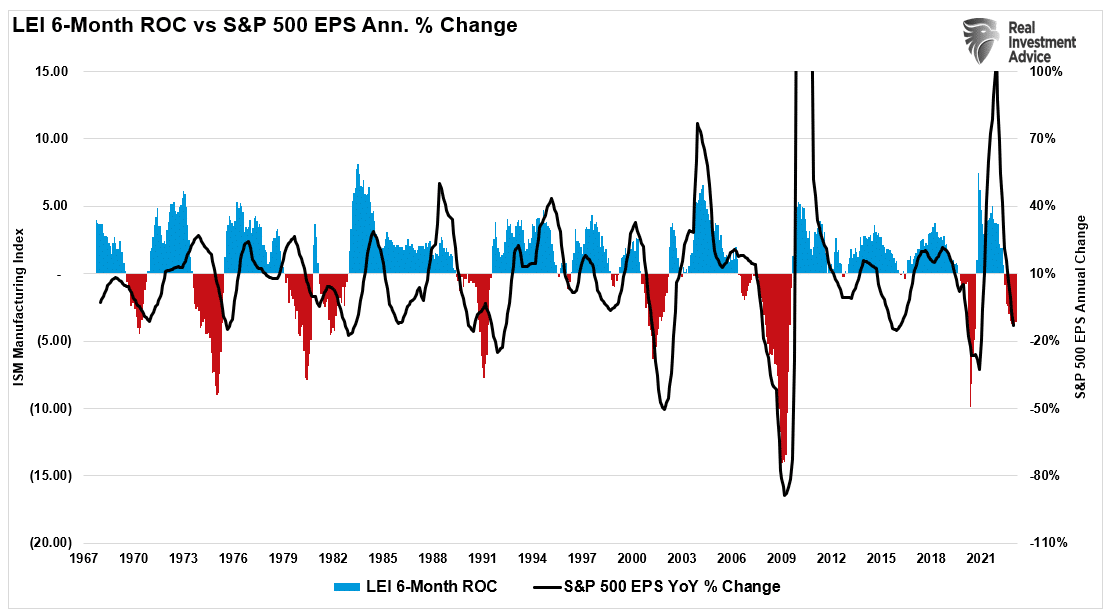
While the technicals suggest this is a “bear trap,” the fundamentals do not support that argument. When it comes to equity risk, it is corporate earnings that will drive equity prices. As the Fed hikes rates to slow economic activity and potentially cause a recession, such will translate into slower earnings growth and reduced profit margins. Given that valuations are near 29x earnings currently, such suggests that stocks must reprice lower. The 6-month annual rate of change of the Leading Economic Index (LEI) supports that thesis, meaning earnings will decline over the next two quarters.
Whether the bull or bear trap view wins will only become known in time. However, as noted, while the bulls currently control the technical picture, the Fed still has control of the macro environment. While we will continue to trade the markets tactically in the short term, in our view, there is still a risk of a more profound decline unless the Fed changes course in short order.
We must wait and see who wins the “bull market is over” debate.

