As noted in this past weekend’s newsletter, following the “Yen Carry Trade” blowup just three weeks ago, the market has quickly reverted to more extreme short-term overbought conditions.
Note: We wrote this article on Saturday, so all data and analysis is as of Friday’s market close.
For example, three weeks ago, the growth sectors of the market were highly oversold, while the previous lagging defensive sectors were overbought. That was not surprising, as the growth sectors of the market were the most exposed to the “Yen Carry Trade. “
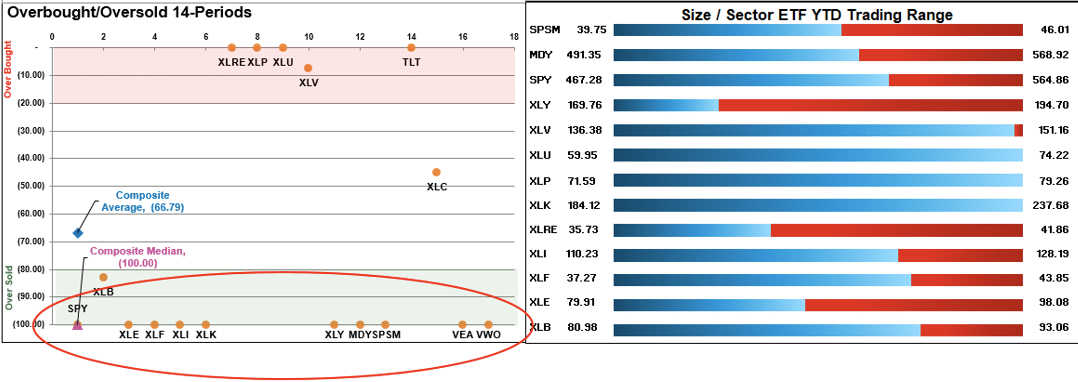
We saw much the same in the Risk Range Analysis (Note: both sets of analysis presented are published weekly in the Bull Bear Report).
As explained in the weekly report:
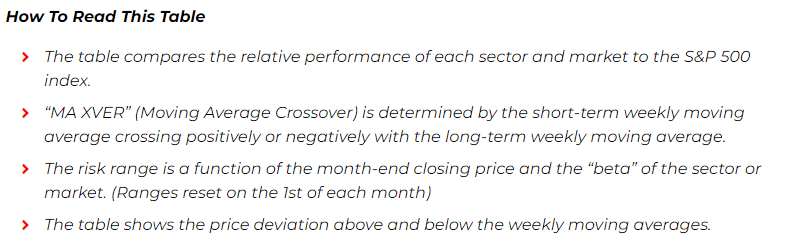
Two critical points. First, three weeks ago, many sectors and markets were well below their historical risk ranges. The second is that all but three sectors or markets are on long-term bullish “buy signals.” When most markets are on bullish signals, as they are currently, markets have never suffered severe bear markets. As such, corrective market actions, as witnessed three weeks ago, tend to be buying opportunities. When the number of “bearish signals” increases, the risk of a more significant drawdown increases.

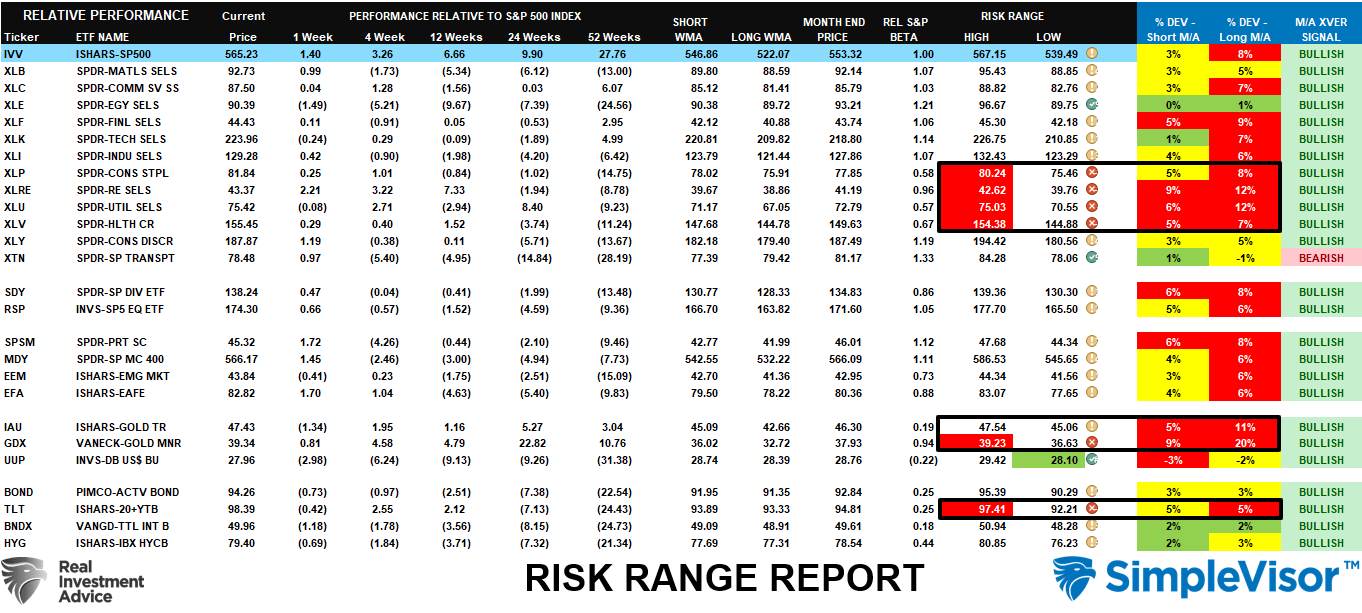
How Things Have Changed
Flash forward three weeks to Friday’s close, and a very different picture emerges.
Every major market and sector has fully reversed to more extreme overbought conditions, which historically have been a precursor to short-term corrections to reverse such conditions.

However, as noted above, only ONE sector remains on a “bearish” signal. While many sectors and markets, particularly Gold Miners, Real Estate, and Utilities, are pushing double-digit deviations from their respective long-term means, a correction to reverse those extremes will not likely devolve into a deeper bear market.
In other words, investors should consider taking profits in areas that are highly deviated from their long-term means, as these areas will suffer more significant corrective reversals than those that are not.
But how significant could a correction be?

Technical Levels Of A Correction
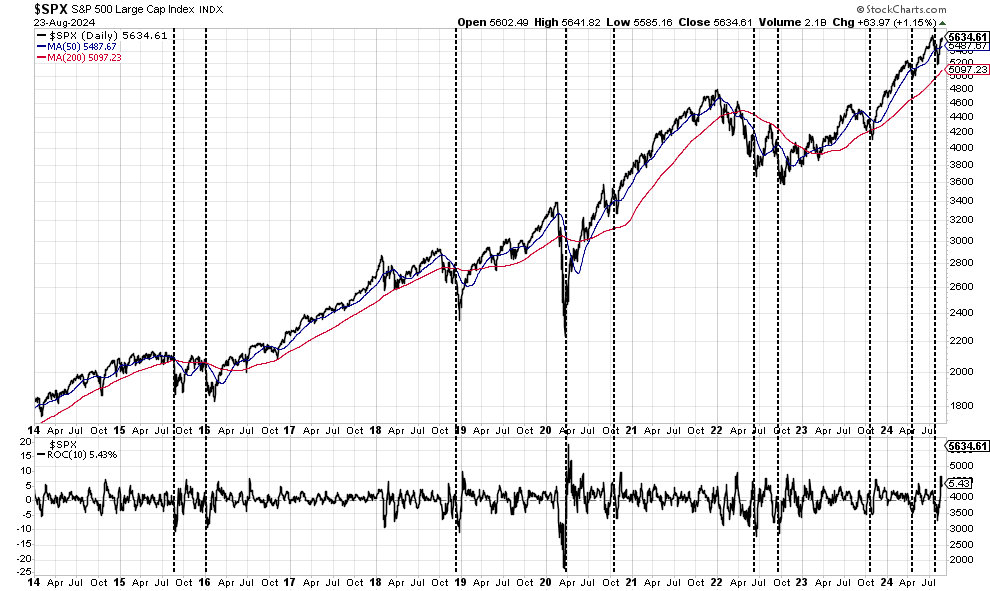
While the recent rally from the lows has been impressive, it has also been bullish by triggering several signals that historically precede further market gains. As noted this past weekend:
“As shown below, rapid V-shaped recoveries tend to be bullish indications of both the end of the corrective period and the resumption of the bullish trend. Since 2014, periods that saw a sharp price decline, as measured by the 10-day rate of change, followed by a sharp advance, were bullish indications. However, as seen in 2015 and 2022, such a reversal does not preclude a secondary correction from occurring.”
The last sentence is the most important.
While weekly bullish buy signals and improving market breadth certainly portend further market gains, this does not preclude a short-term correction from occurring. On a very short-term basis, some nearby retracement levels would relieve some of the short-term overbought conditions without triggering larger market concerns. Those levels are as follows:
- The 50-day moving average (DMA) which currently resides at 5491
- The 20-DMA, which has turned up, providing another bullish signal, is just below that at 5445.
- If the market fails those two supports, the top of the downtrend line and the 100-DMA are close by at 5377 and 5347, respectively.
- Lastly, the recent market low at 5154 and the 200-DMA at 5100 remain critical support levels.
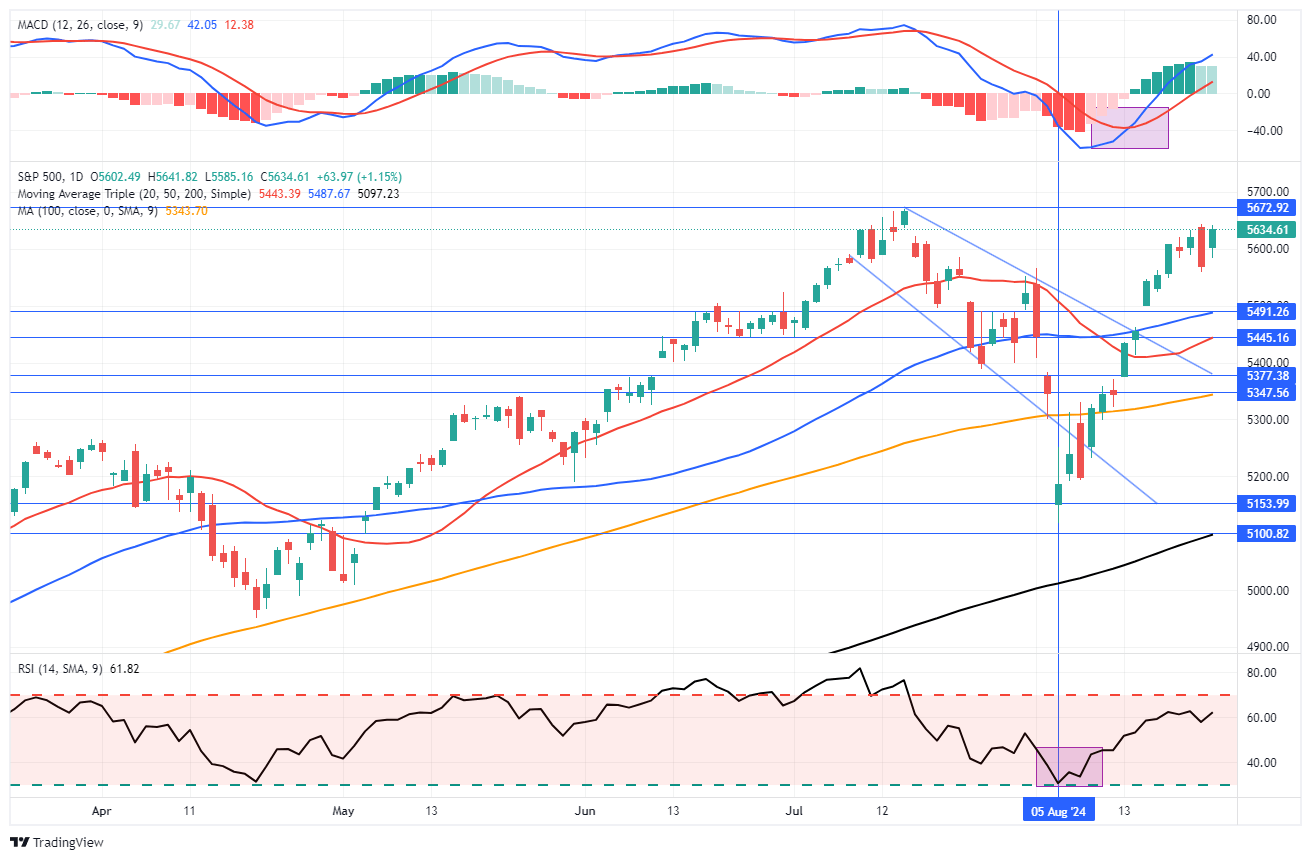
Between today and the election, these primary levels have the highest probability of containing any near-term market correction that would reverse most overbought conditions. Such would provide a much better entry opportunity to increase exposure for a potential year-end rally.
What About A Bigger Correction?
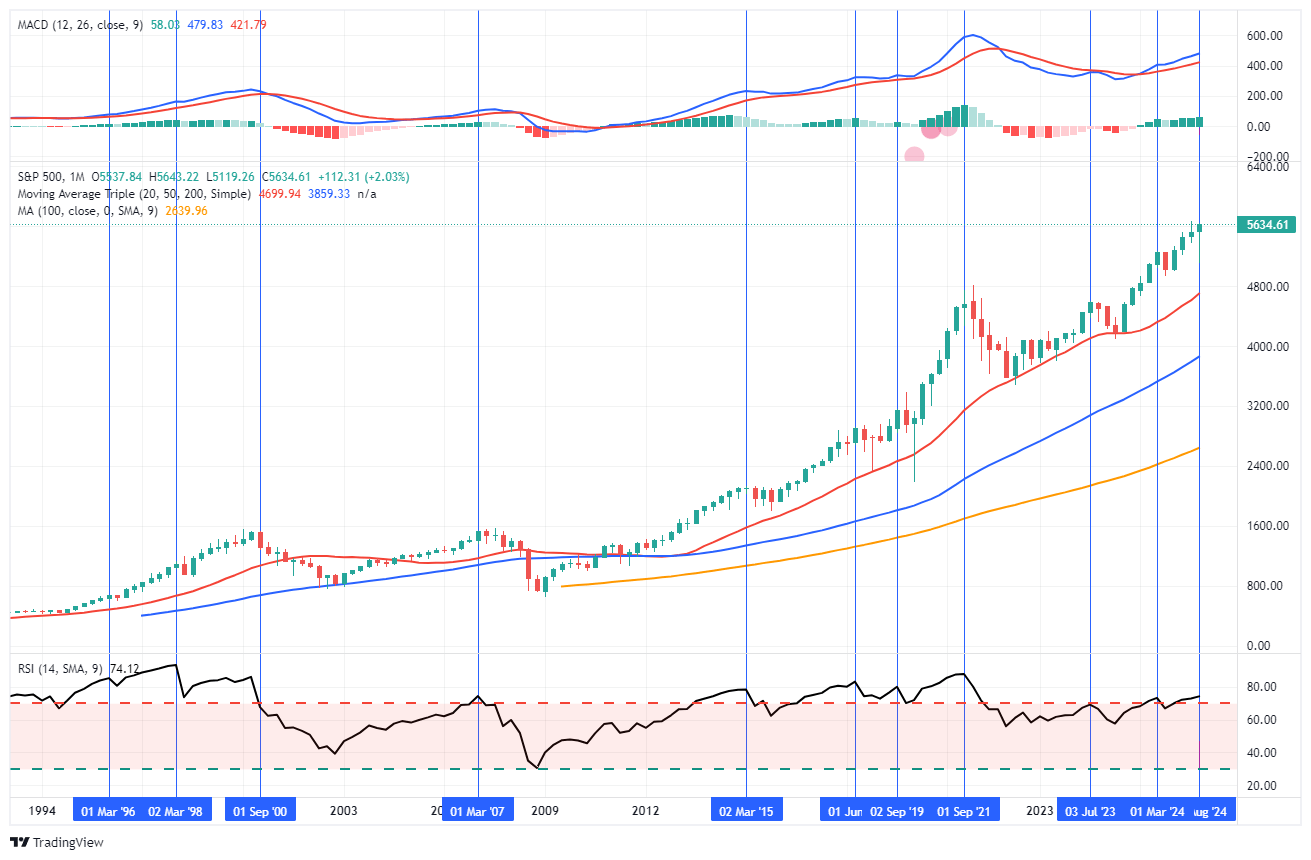
What about the potential for a more extensive correction? Yes, such a risk is possible, and we should not ignore it. If we look at a monthly chart, two warnings are immediately noticeable. First, the market’s deviation from the 20, 50, and 100-month moving averages (MMA) is substantial. Historically, the markets correct such large deviations. However, such a correction, while possible, would require a more severe credit-related event, a deep recession, or a financial crisis of some magnitude. While such events are possible, these events are ALWAYS exogenous and unanticipated. The technicals tell us that the market is susceptible to an exogenous shock that would lead to a more profound corrective event.
Secondly, the monthly overbought conditions are also at levels (as shown in the bottom chart) that have preceded more extensive corrections, such as in 2022, 2008, and 2000. Notably, every time the market has been as overbought as it is currently, it has suffered short—to intermediate-term corrective events.
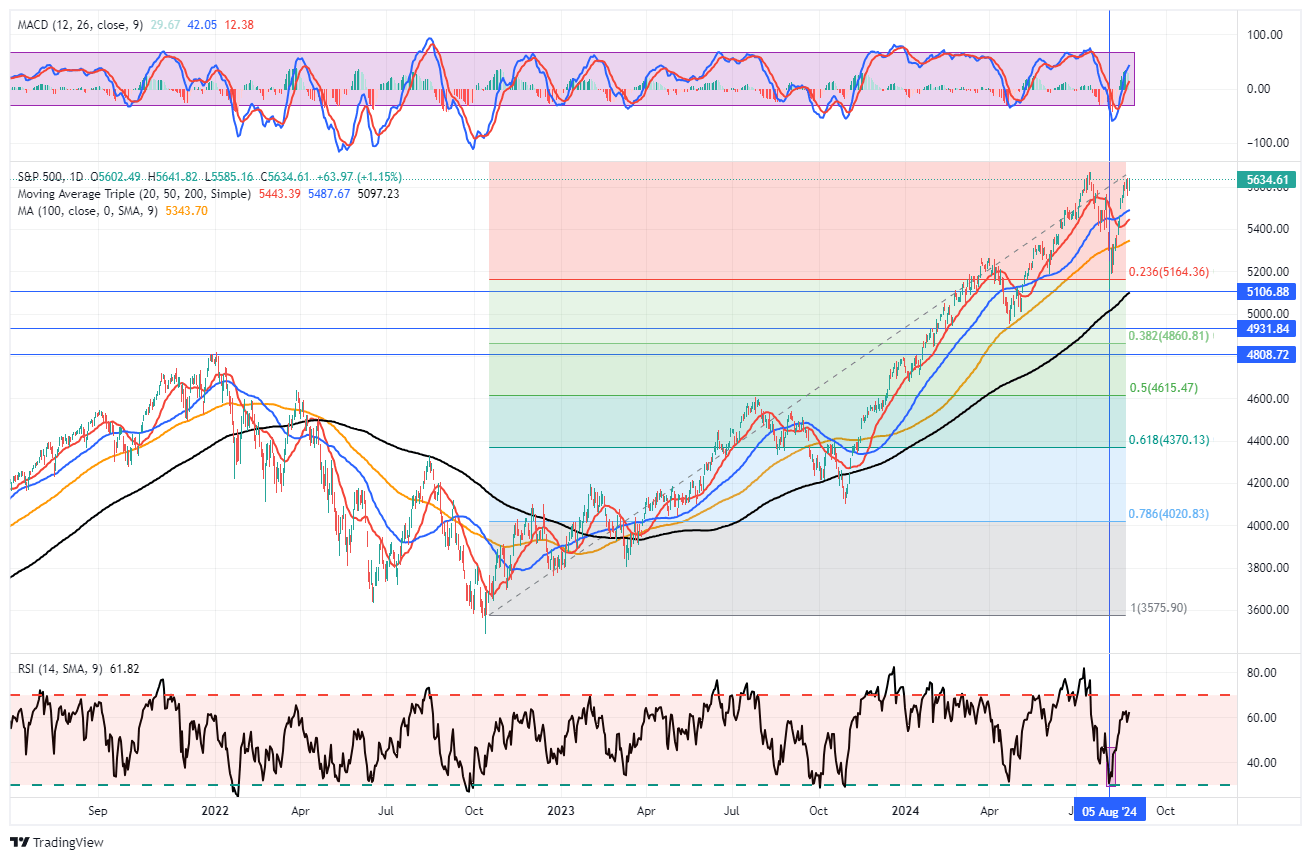
Looking at the longer-term daily chart, should such a more significant correction occur, we can use a Fibonacci sequence to determine the depth of the retracement.
- When the market reaches those levels, a pullback to the 200-DMA would also align with a 23.6% retracement level.
- A retest of the April correction lows becomes the next logical support. The 38.2% retracement level is just below that level.
- Any correction not coinciding with a more significant event will likely remain contained to those levels. However, a failure at the 38.2% retracement will bring the 50% retracement and the January 2022 peaks into focus. Such a correction would encompass a nearly 20% decline from current levels.
- If some event triggers a break of the more extreme correction levels, there is a risk of the 2022 lows. However, we will significantly reduce portfolio exposures before the market reaches those levels.
The market’s overbought condition is apparent, and a correction is likely. The only questions are the trigger and the magnitude. However, investors must keep such corrections in perspective. Given the current technical backdrop, most probabilities are weighted to corrections within 5-10% of current levels. However, we can’t dismiss the smaller possibility of a larger correction.

Buyers Live Lower
So, what will cause this correction? As discussed previously, “sellers live higher, buyers live lower.”
“As noted above, the stock market is always a function of buyers and sellers, each negotiating to make a transaction. While there is a buyer for every seller, the question is always at “what price?”
In the current bull market, few people are willing to sell, so buyers must keep bidding up prices to attract a seller to make a transaction. As long as this remains the case and exuberance exceeds logic, buyers will continue to pay higher prices to get into the positions they want to own.
Such is the very definition of the “greater fool” theory.
However, at some point, for whatever reason, this dynamic will change. Buyers will become more scarce as they refuse to pay a higher price. When sellers realize the change, they will rush to sell to a diminishing pool of buyers. Eventually, sellers will begin to “panic sell” as buyers evaporate and prices plunge.”
In other words, “Sellers live higher. Buyers live lower. “
We can see where the buyers and sellers “live.” The following chart shows where the highest volume occurred. As shown, there are few buyers at current levels. As the old Wall Street axiom states, “If everyone has bought, who is left to buy.”
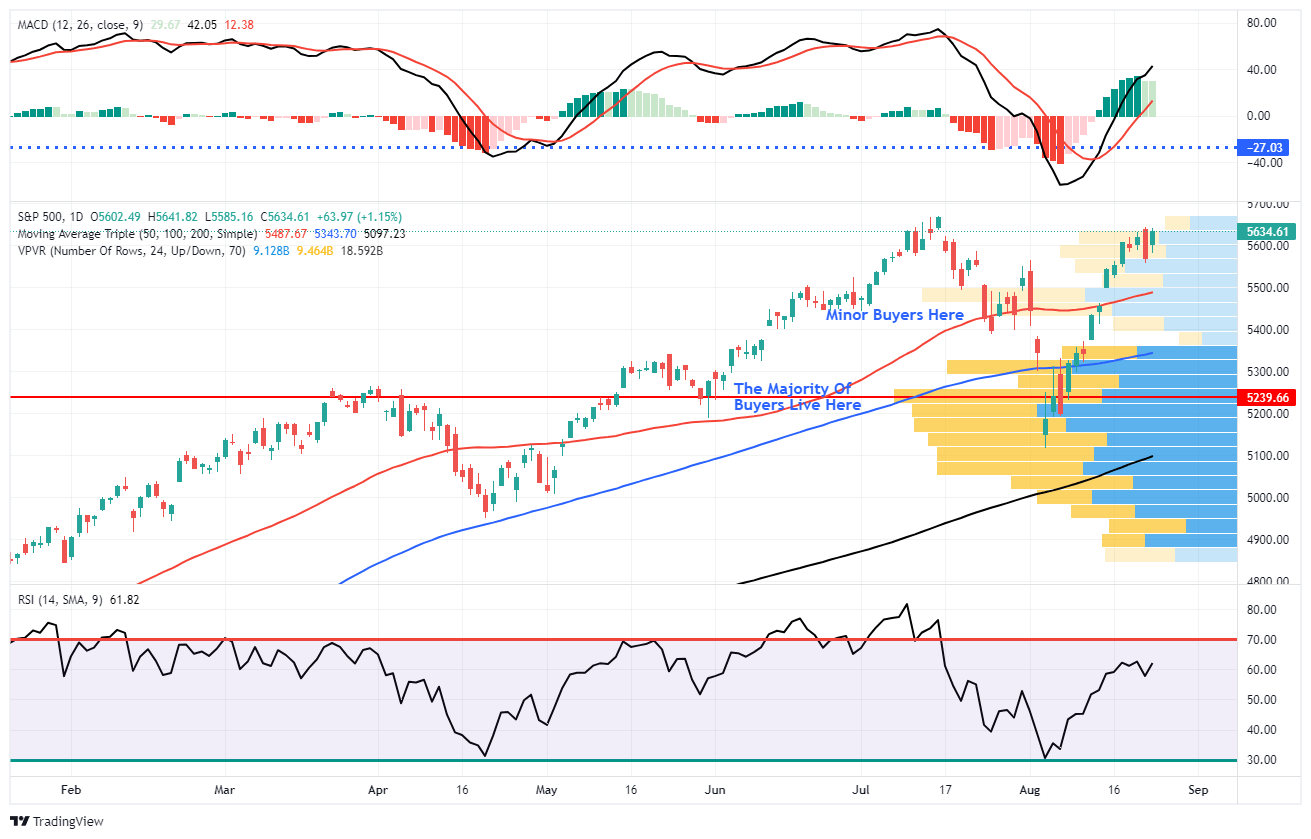
That leaves the market vulnerable to a correction. When an event occurs, there are “willing buyers” for every transaction—just at much lower prices.
While the “Yen Carry Trade” quickly resolved itself, that risk has not been removed. The Bank of Japan is still intent on hiking interest rates, while the Federal Reserve is lowering them. At the same time, the Dollar has been declining, and the Yen Has Been increasing. So far, this has not triggered another “margin call” for hedge funds. However, should the underlying dynamics continue, the risk of another “event” clearly increases.
With markets overbought and sentiment bullish, such is a good time to rebalance portfolios and reduce excess risk.
Trade accordingly.


Lance Roberts is a Chief Portfolio Strategist/Economist for RIA Advisors. He is also the host of “The Lance Roberts Podcast” and Chief Editor of the “Real Investment Advice” website and author of “Real Investment Daily” blog and “Real Investment Report“. Follow Lance on Facebook, Twitter, Linked-In and YouTube
Customer Relationship Summary (Form CRS)
Also Read