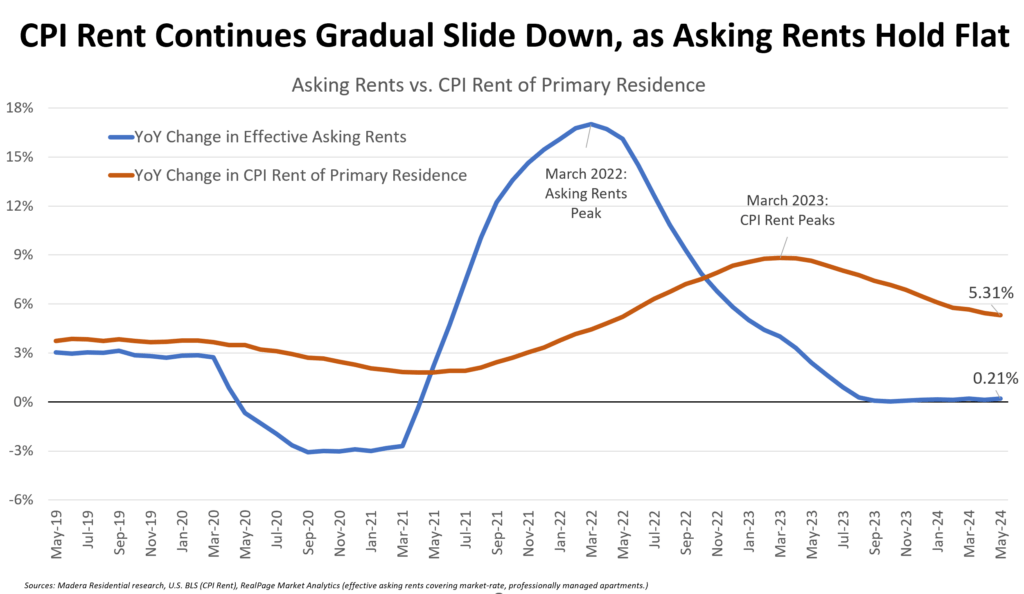
The Fed got good news yesterday, with the headline CPI coming in at 0% for the month. More importantly, core CPI rose by +.16% versus expectations of +.30%. That brings the year-over-year core CPI rate to 3.4%, a tenth below expectations. Excluding shelter costs, accounting for 40% of CPI, core CPI, also called “super core,” was down for the month. This is the first decline since September 2021. This is important because CPI shelter costs should decrease in the coming months. Thus, “super core” could push further into deflationary territory. The graph below shows that CPI rents, a large component of shelter costs, lag changes in current rental costs. For almost a year, actual rent cost changes have hovered near zero percent. Inflation will likely approach the Fed’s 2% target when the CPI shelter costs catch up with actual data.
In our opinion, it’s a matter of when, not if, shelter prices normalize. Therefore, it’s likely that when the CPI shelter normalizes, the Fed will be more comfortable with inflation trends, allowing it to cut the Fed Funds rate. The December Fed Funds contract jumped by 12 bps on the CPI number, thus implying that investors added an additional 50% chance of a rate cut by year-end. With the market reaction, Fed Funds futures now imply two rate cuts by year-end. As we share below, the Fed projects only one rate cut by year-end.
What To Watch Today
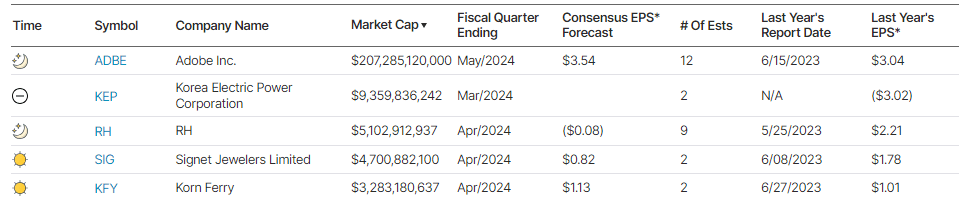
Earnings
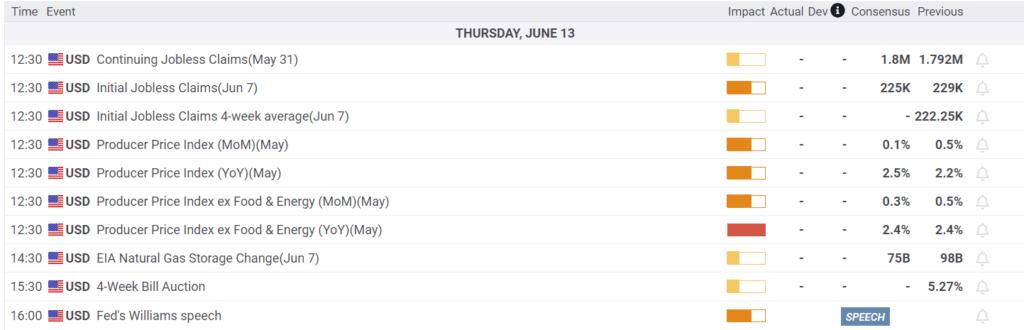
Economy
Market Trading Update
As noted yesterday, the market has been waiting on the inflation data and the Fed meeting. With inflation coming in cooler than expected and the Fed still on track to cut rates, the market closed higher yesterday. Bonds also rallied sharply, and rates fell.
The bullish underpinnings have weakened while the market continues to set new highs. Breadth has narrowed, and the negative divergence of the advance-decline line to the market has previously warned of a potential overshoot by overly zealous investors.
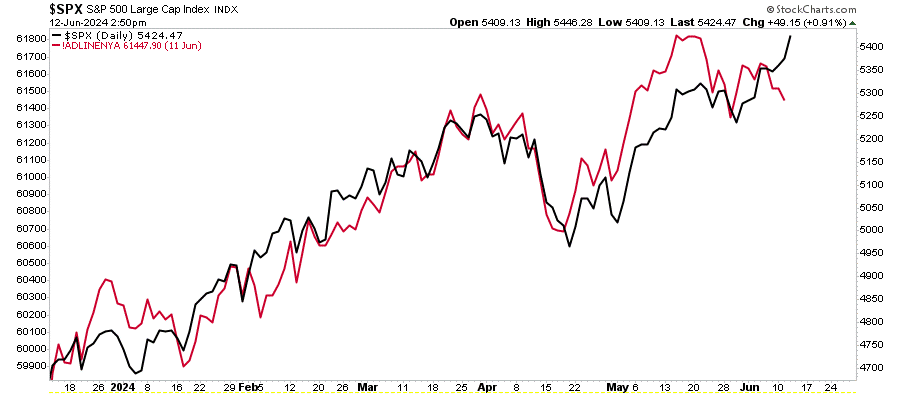
Speaking of negative divergences, the market has also been rising against a decline in the relative strength index and the MACD. As shown, these negative divergences often suggest that the market’s internals are weaker than the index may suggest.
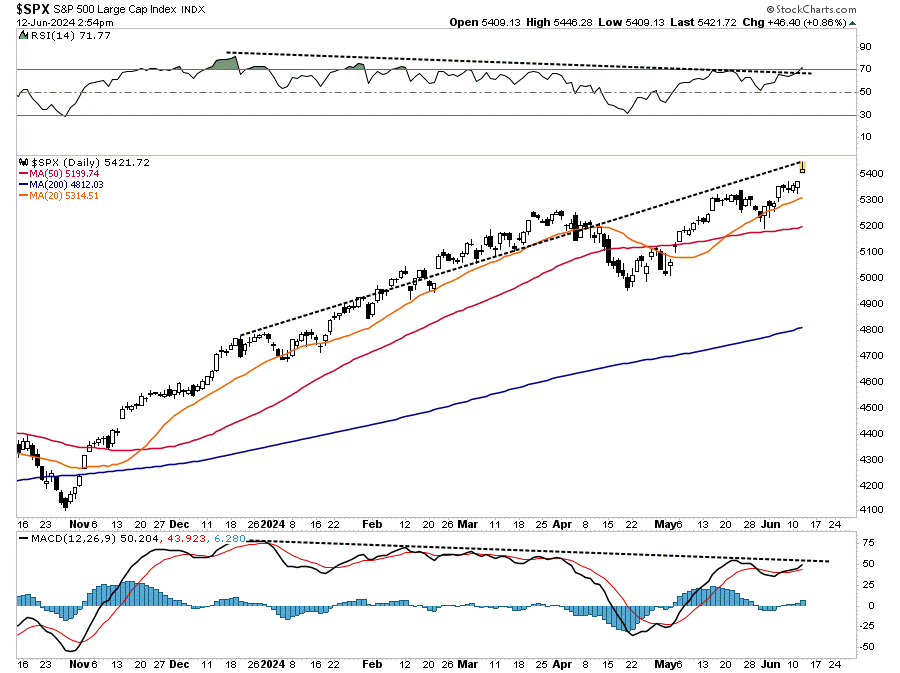
For now, the 20-DMA continues to act as initial support, but the growing divergence between the market and the 50-DMA is reaching levels that have previously preceded a short-term correction. That deviation, combined with the negative divergences, suggests that investors be a little more cautious with risk exposure in the near term. While nothing suggests that a correction of magnitude is in the offing, a pullback to the 20- and 50-DMA is quite likely in the near term.
Trade accordingly.

The FOMC Meeting Recap
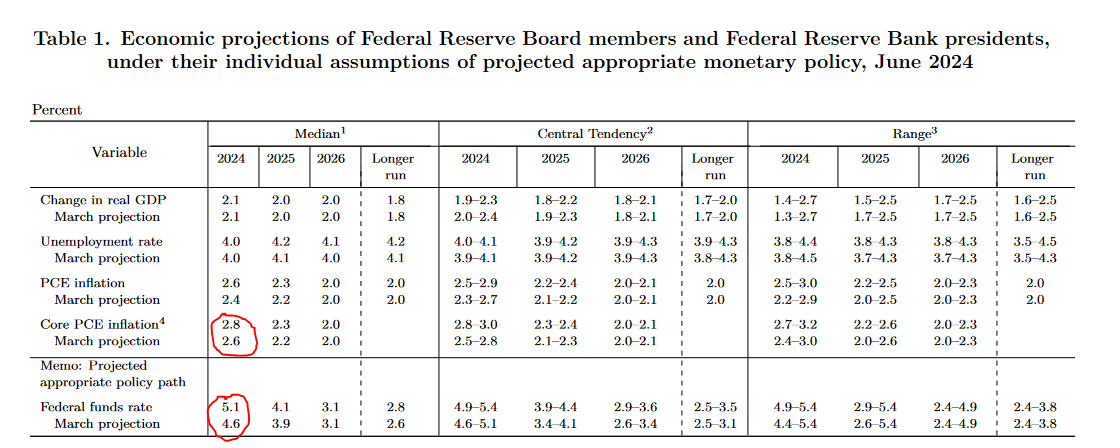
The market was not expecting much in the way of surprises from the FOMC minutes, and the Fed lived up to expectations. However, the quarterly economic projections of the Fed members were a little more hawkish than expected. As we circle below, they increased their core PCE inflation forecast from 2.6% to 2.8% for year-end. Accordingly, they reduced the number of Fed Funds rate cuts to one from three last March.
While their projections seem hawkish, a slight tweak in the statement’s language suggests a dovish tilt. The May minutes say, “In recent months, there has been a lack of further progress toward the Committee’s 2% inflation objective.” The latest minutes state, “In recent months, there has been modest further progress toward the Committee’s 2% inflation objective.“
The following comments are from Jerome Powell’s press conference following the release of the minutes and economic projections:
- The Fed is prepared to respond if unemployment rises quicker than expected or prices fall faster than expected.
- Two or three more CPI readings like yesterday’s could lead to a September cut.
- Powell stressed numerous times that their decisions are data-dependent, and they do not confidently hold their projections. “Do we have high confidence in forecasts? No, we don’t.” He also mentioned they made their projections prior to knowing the data within the CPI report.
- Powell acknowledged the argument that the strength in job creation (non-farm payrolls) “may be a bit overstated.”
- “post-pandemic normalization of the labor market has now run its course.”
- “Rates are less likely to go down to pre-pandemic levels.” But, “we do not know that.”
Market Cap Distortion On Display
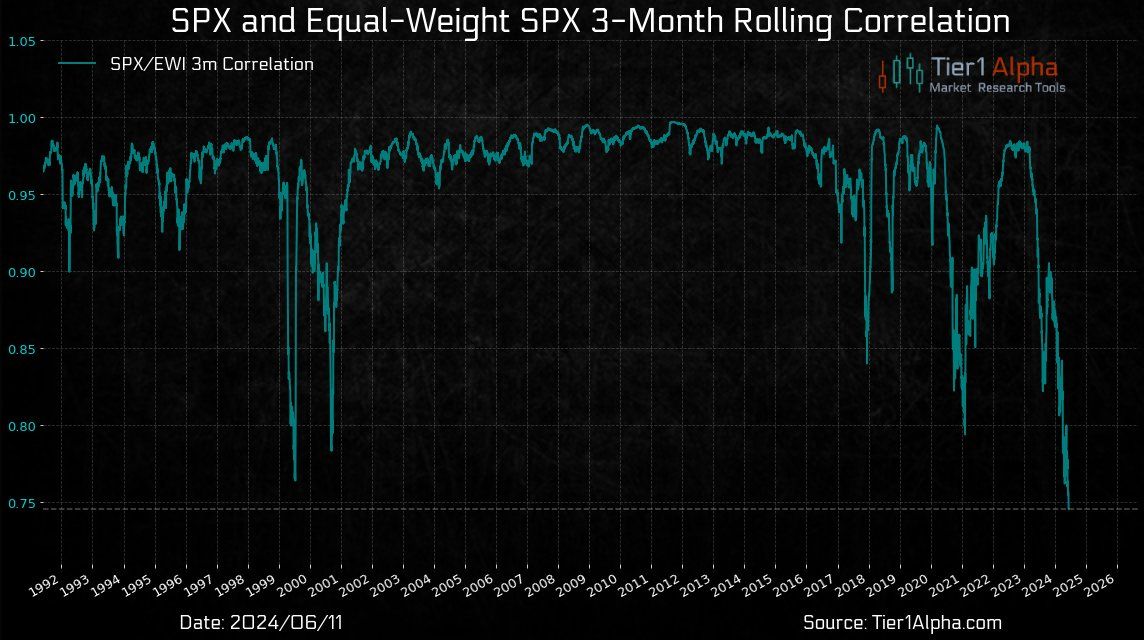
On Tuesday, the S&P 500 rose by 0.25% on the back of Apple’s 7% gain, while the equal weight S&P 500 index (RSP) fell by -0.45%. This familiar story of a few stocks driving the market has been happening for over six months. Statistically, as we show below courtesy of Tier1 Alpha, the 3-month rolling correlation between the market cap-weighted and equal-weighted S&P 500 is at a three-decade low.
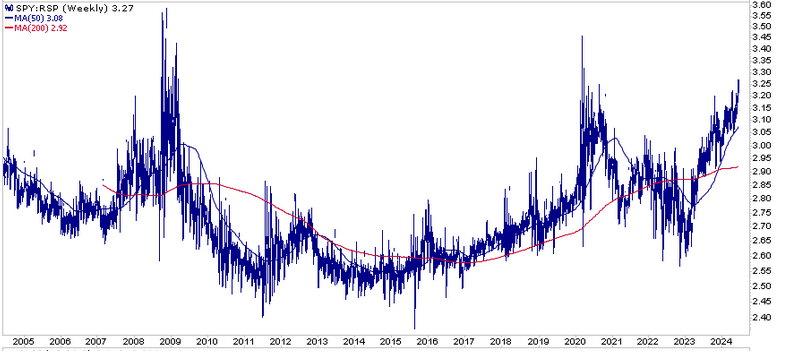
The second graph shows the price of the two indexes (SPY/RSP). As shown, it has risen by about 30%. In other words, an equal investment in all 500 S&P stocks would have underperformed the index by 30%. How long can such outperformance continue? With 28% of the S&P market cap concentrated in five stocks (MSFT 7.05%, NVDA 6.68%, AAPL 6.21%, GOOG 4.22%, and AMZN 3.79%), the more direct question is how long can those five stocks or a subset of them continue to grossly beat the markets?
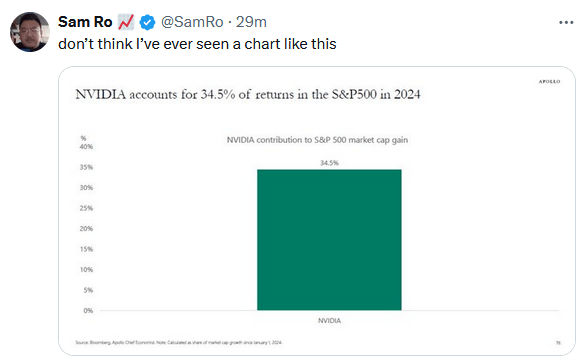
Tweet of the Day
“Want to achieve better long-term success in managing your portfolio? Here are our 15-trading rules for managing market risks.”
Please subscribe to the daily commentary to receive these updates every morning before the opening bell.
If you found this blog useful, please send it to someone else, share it on social media, or contact us to set up a meeting.
Also Read