Degen traders, short for degenerates, are taking storm of the markets. The Wall Street Journal recently published Meet The Degen Traders Fueling The Latest Meme-Stock Mania. The article introduces its readers to a new type of investor creating incredible volatility in a handful of stocks and cryptocurrencies. Per the article: “Degens are gamblers, not traders or investors. Fundamentals are not a concern for Degens. Instead, they seek excitement.“
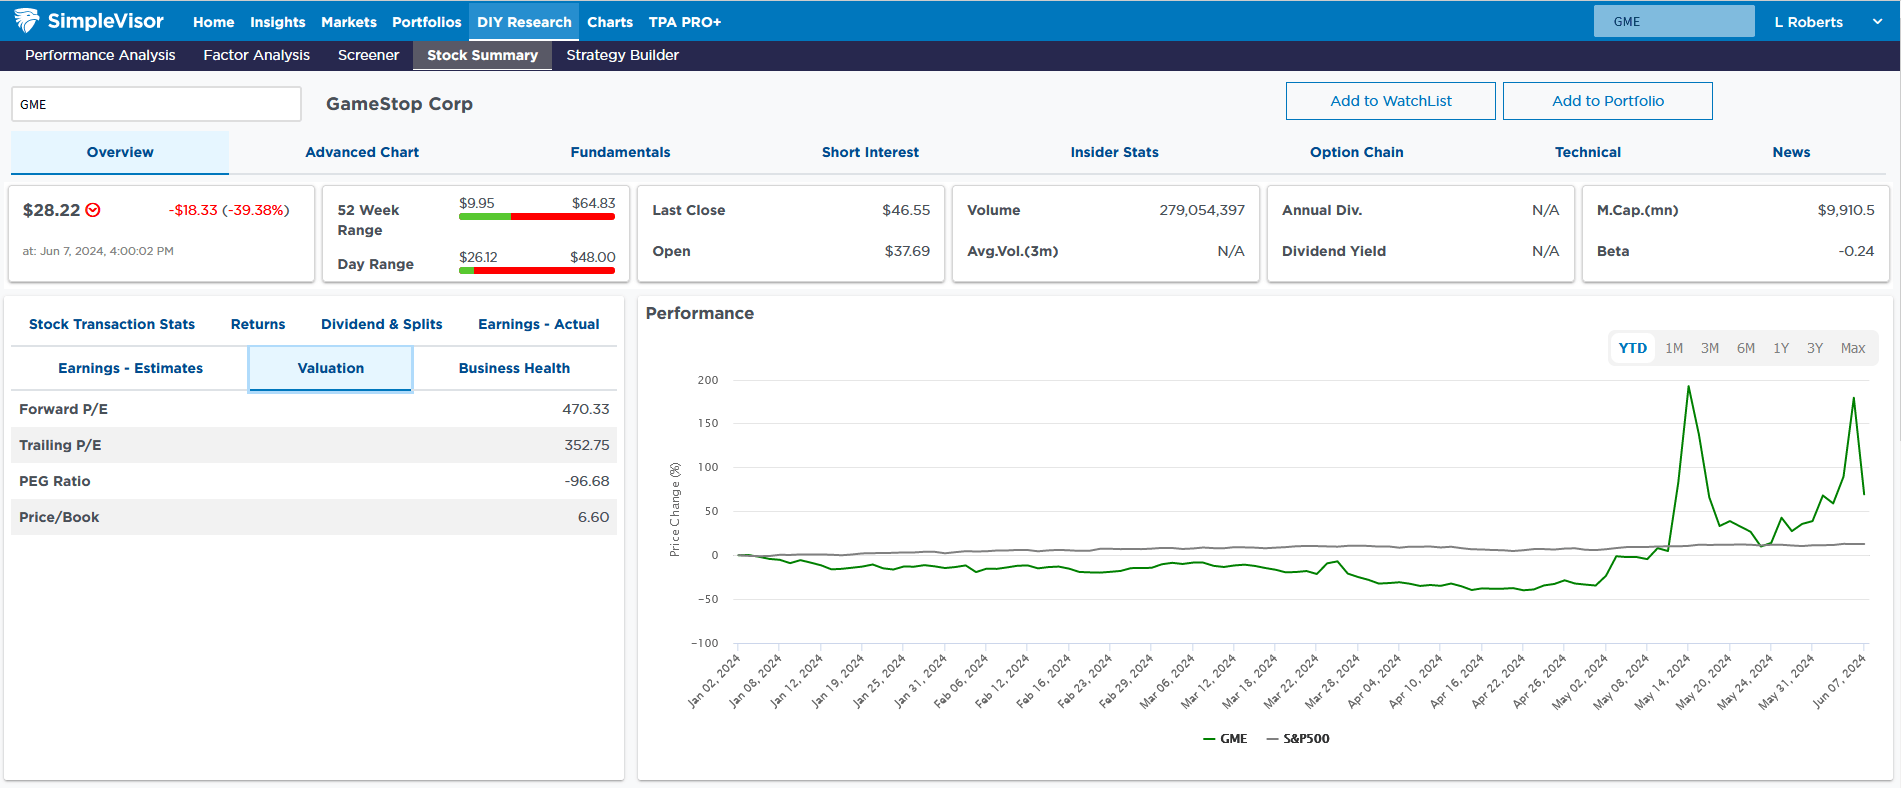
Degens largely day trade. Furthermore, they have become adept at trading same-day expiration options (0DTE – see Tweet of the Day). We believe 0DTE trades are akin to playing roulette or flipping a coin. Similarly, penny stocks are in vogue with the Degen crowd. The seeming leader of the Degen movement is Keith Gill, aka Roaring Kitty. Through tweets and Reddit posts, Roaring Kitty has single-handedly caused stocks to more than double in minutes. His latest foray is in GameStop shares. As the SimpleVisor graphic below shows, its stock (green) has seen massive volatility. In comparison, the S&P 500 (gray) looks like a flat line.
The ending quote from the article summarizes the story well: “It ends up shaping your way of seeing things. You’re not looking at things as financial instruments anymore,” she said. “You’re just absorbed into this micro-culture.” Our take: unlike most investors, Degens’ are not evaluating stocks based on the potential future earnings of the corporation. Instead, they view it like sports gambling. While Degens can warp the value of stocks for short periods, we believe fundamental investors will take advantage of such opportunities to short said stocks and bring them back toward their fair value.
What To Watch Today
Earnings

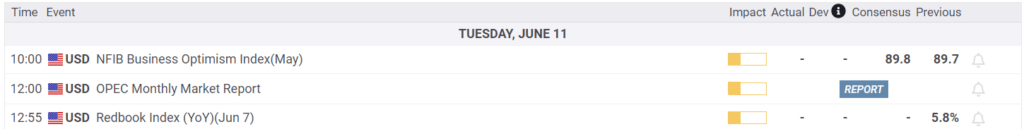
Economy
Market Trading Update
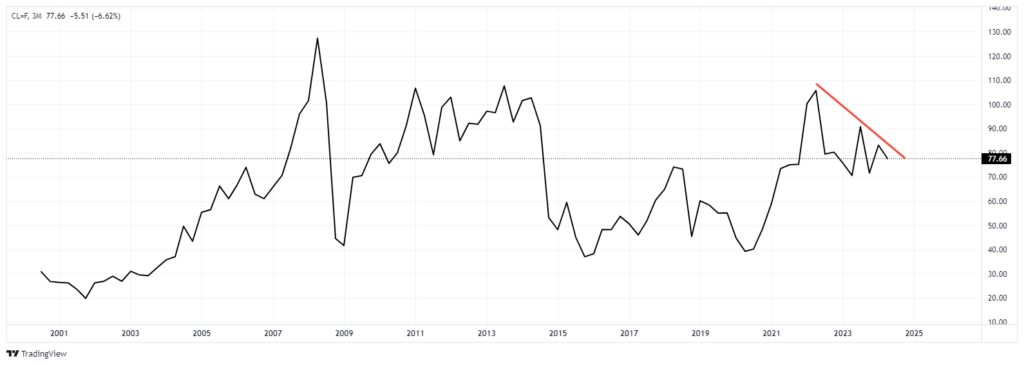
As discussed yesterday, the markets are in a holding pattern ahead of this week’s CPI inflation report and the June FOMC meeting. However, today, the market will focus on the latest OPEC report to assess the next moves in the oil market. After the post-pandemic run-up, the Ukraine war, and unrest in the Middle East, Wall Street was expecting oil prices to soar above $150/bbl. However, as is almost always the case, those exuberant estimates rarely come to fruition.
Since April 2022, oil prices have steadily declined and are flirting with support around $70/bbl. That level is high enough to encourage producers to drill but not enough to impede the economy grossly.
Unsurprisingly, given the input cost of oil to energy companies, there is a high correlation between the Energy Sector ETF (XLE) and oil prices.
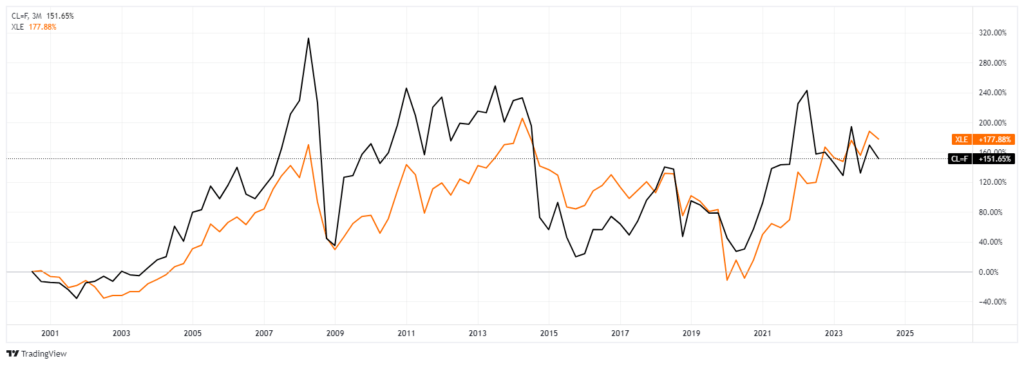
From a trading perspective, we remain long our energy holdings, after having taken profits in them early this year, and are looking for a reversal in oil prices to signal the next entry point. With Hurricane season fast approaching, we may get another short-term trading opportunity in the next couple of months.

Market Breadth Is Poor As Nvdia Drives The S&P 500
Nvidia, up 35% last month, has become the second-largest stock in the S&P 500, overtaking Apple last week. As such, its contribution to the index grows. This week’s SimpleVisor sector analysis shows that while the S&P 500 rose 1% last week and 2.5% over the previous month, the underlying sectors are not keeping up. The absolute scores also confirm this. Other than XLC (.54), SPY is more overbought than every other sector. Simply, Nvidia and a small handful of other stocks are leading the markets.
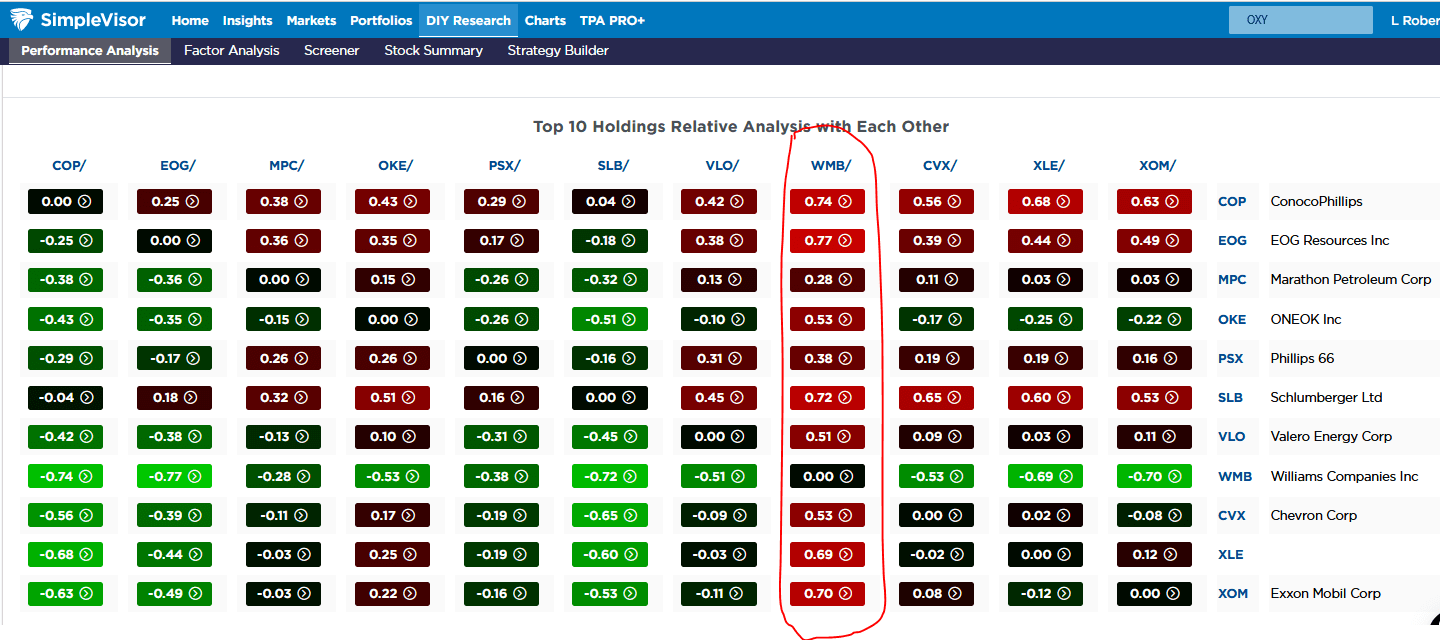
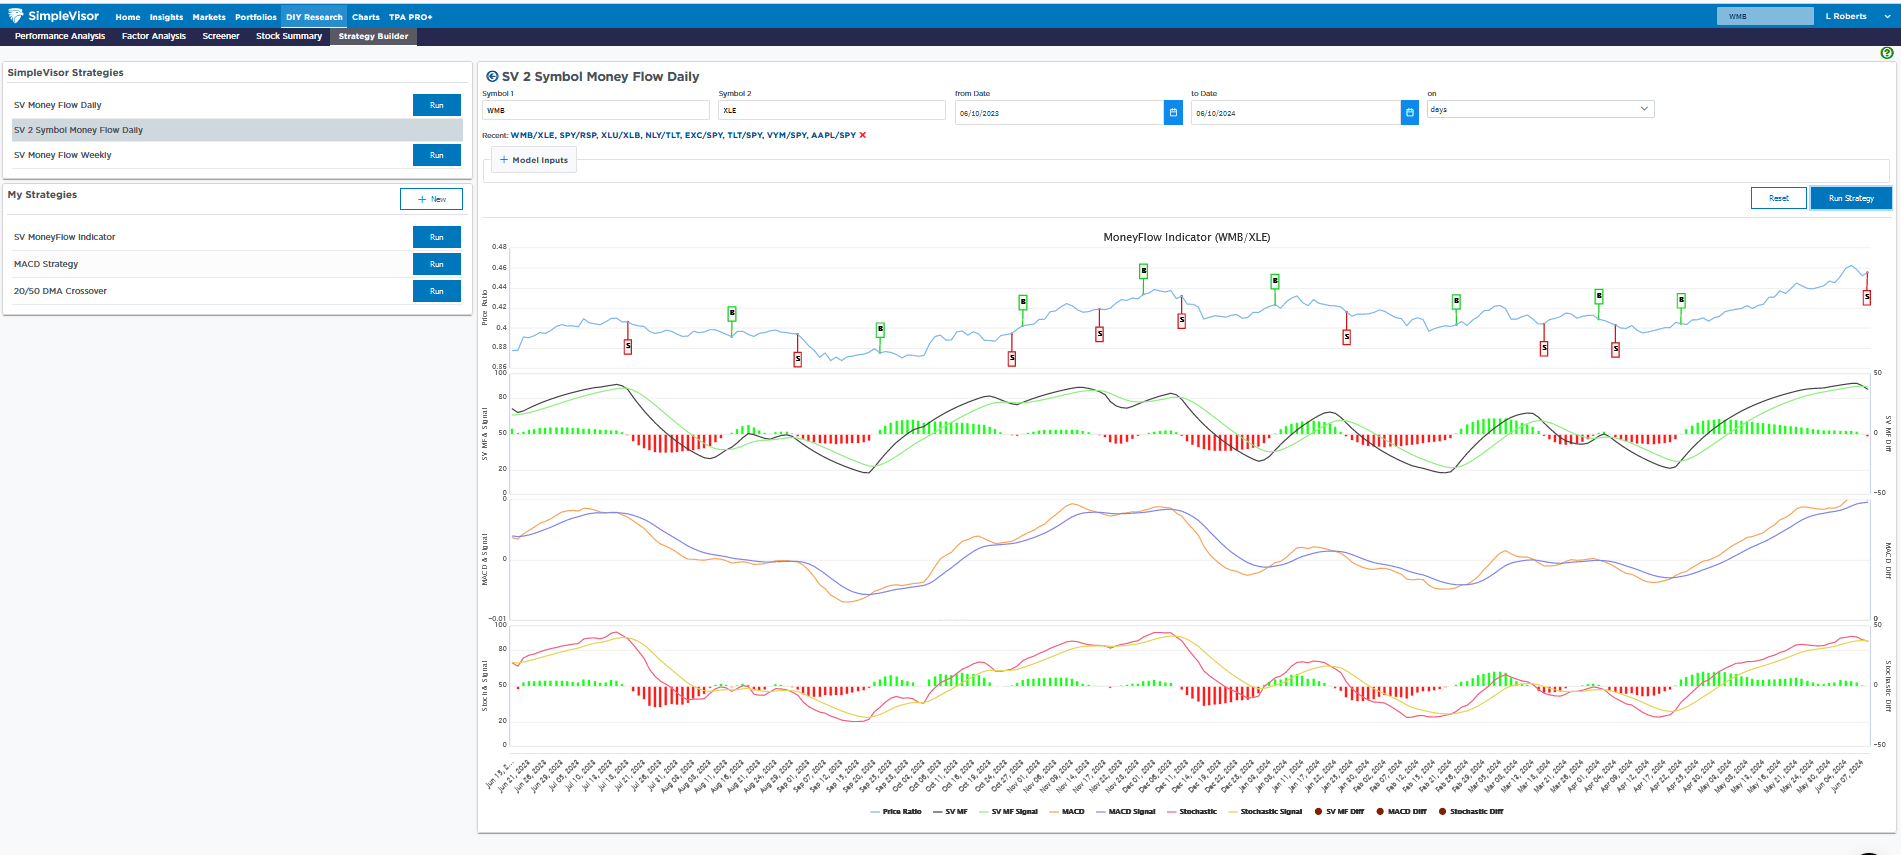
The energy sector remains the weakest on an absolute and relative basis. The second graphic below highlights the sector’s top ten holdings and their relative scores versus each other and the XLE sector ETF. We circle Williams (WMB) as it is overbought versus every other energy stock and the sector ETF. The third graph shows the price ratio of WMB to XLE is very extended and has just triggered a sell signal on our proprietary model. Mind you, the sell signal is on the price ratio. This implies that XLE will outperform WMB over the coming weeks, but not necessarily that WMB shares will fall.

Japan Takes Another Economic Step Backwards
The good news for Japan is that its GDP has been revised higher. However, the revision brought it from -2% to -1.8%. Interestingly, the negative growth occurs when its central bank (BOJ) is removing stimulus. The BOJ just raised its benchmark rate for the first time since 2007 and is discussing curbing its bond purchases. This comes at a time when the ECB and Bank of Canada cut rates for the first time since the pandemic. Further, the Fed is reducing the amount of monthly QT, and it is widely expected the Fed’s next move will be a rate reduction.
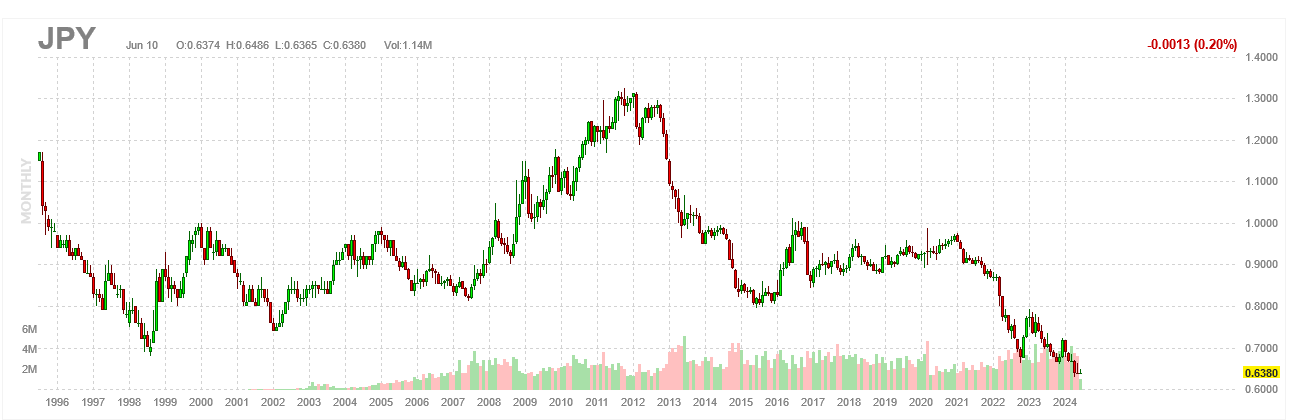
The yen has traded poorly, as its interest rates are much lower than most developed economies. The graph below shows the yen sits at its lowest level in at least 30 years. If the Bank of Japan does indeed reduce bond purchases and allows rates to move higher, the Fed cuts rates later this year, and other banks follow with similar rate cuts, the yen may finally catch a bid. For now, betting on the yen is like trying to catch a falling knife. However, if the BOJ can revive growth and its interest rates become more in line with those of other nations, the yen may be a good investment at some point in the next six months to a year.
Tweet of the Day

“Want to achieve better long-term success in managing your portfolio? Here are our 15-trading rules for managing market risks.”
Please subscribe to the daily commentary to receive these updates every morning before the opening bell.
If you found this blog useful, please send it to someone else, share it on social media, or contact us to set up a meeting.
Also Read