
Much ink has been spilled over the death of the 60/40 portfolio. However, declaring the demise of the 60/40 portfolio could be a mistake. Such is particularly the case as equity returns remain slated to be lower over the next decade due to high valuations.
We bet a 60/40 portfolio could outperform an all-stock index over that period.
While that may sound like a bold statement, there are several important reasons why such could be the case. However, let’s start with the basic premise of why many proclaim death to the allocation.
“The 60/40 portfolio is no longer a good option for investors. With long-term interest rates set to rise, along with inflation, stocks provide the only solution to delivering returns.”
With rising interest rates and inflation, such an assumption would seem logical. In fact, 2022 has been one of the worst years for returns from a 60/40 portfolio.
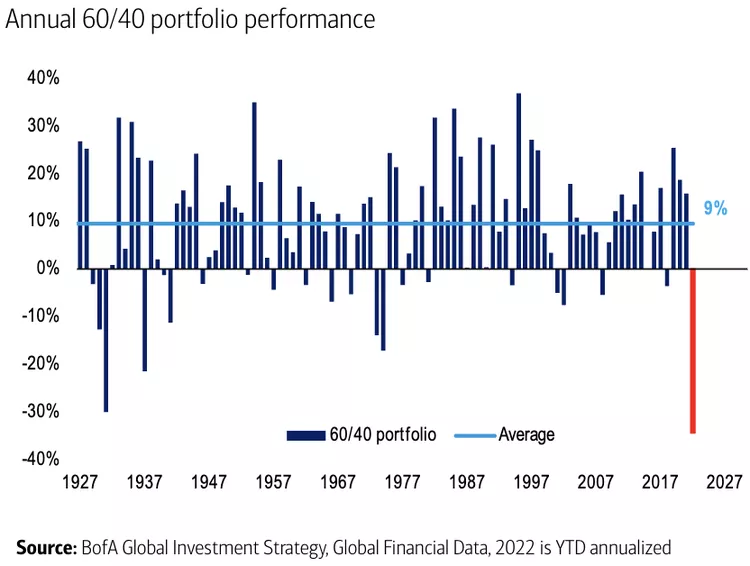
Unfortunately, 2022 was an anomaly marked by surging interest rates and inflation. The longer-term view suggests recent performance will not continue due to expanding debts and deficits. The economic drag from rising debt levels will keep rates lower in the future.
The Long-Term Path Towards Zero
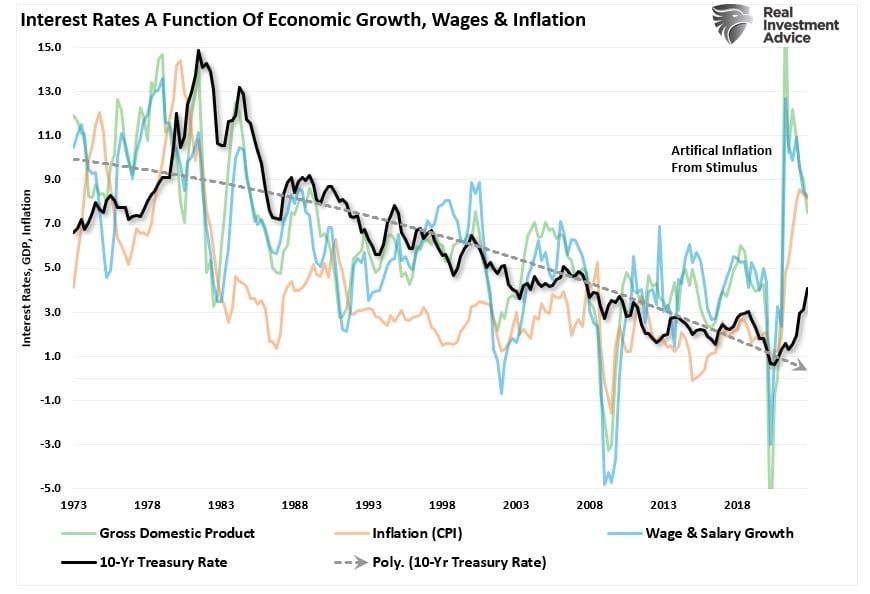
Interest rates reflect three primary economic factors: economic growth, wage growth, and inflation. Those factors are the primary determinants in setting the “rate” for lending money. The sharp spike in economic growth, wages, and inflation caused by artificial interventions (i.e., stimulus checks) boosted demand in a shuttered economy. As shown, the cycle is reversing, and rates will ultimately reflect that decline.
That chart is a bit cluttered. I created a composite of the three underlying measures to clarify the relationship. The chart below combines inflation, wages, and economic growth into a single composite and compares it to the 10-year Treasury rate. Take note that the growth trendline intersects at ZERO, which remains expected given future economic growth trends.
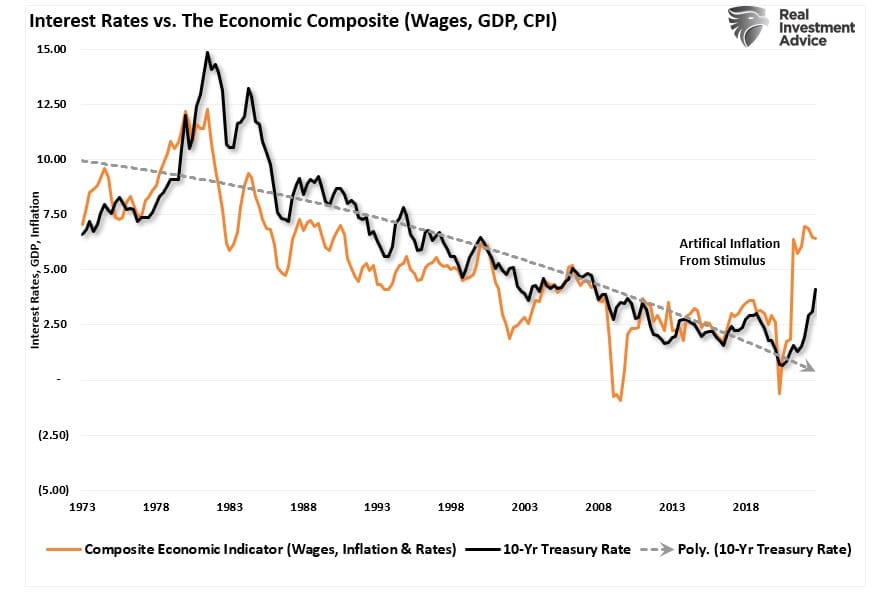
Again, the correlation should not be surprising; rates must adjust for future impacts on capital.
- Equity investors expect that as economic growth and inflationary pressures increase, the value of their invested capital will increase to compensate for higher costs.
- Bond investors have a fixed rate of return. Therefore, the fixed return rate remains tied to forward expectations. Otherwise, capital is damaged due to inflation and lost opportunity costs.
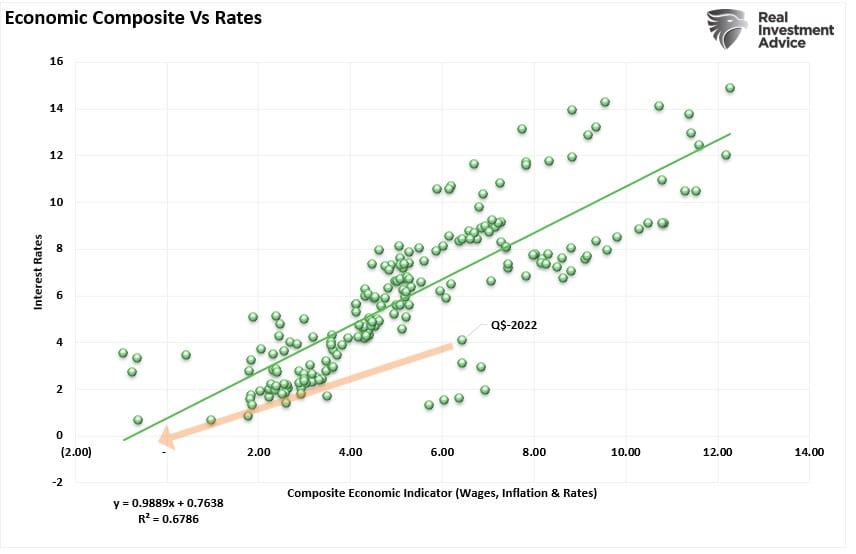
The correlation between rates and the economic composite suggests that current expectations of sustained economic expansion and rising inflation are overly optimistic. Based on that correlation, we stated in 2021 that economic growth rates would quickly return to sub-2% growth by 2022. They have, and as a function, rates will ultimately follow in 2023.
Investors should heed its warning if yields are correct, as lower yields will translate into slower earnings growth rates. Such will be very problematic for valuations.

Valuations
Bob Farrell once quipped investors tend to buy the most at the top and the least at the bottom. Such is simply the embodiment of investor behavior over time. Our colleague, Jim Colquitt of Armor ETFs, previously made an important observation.
“The graph below compares the average investor allocation to equities to S&P 500 future 10-year returns. As we see, the data is very well correlated, lending credence to Bob Farrell’s Rule #5 that “Investors buy the most at the top, and the least at the bottom.” Note the correlation statistics at the top left of the graph.”
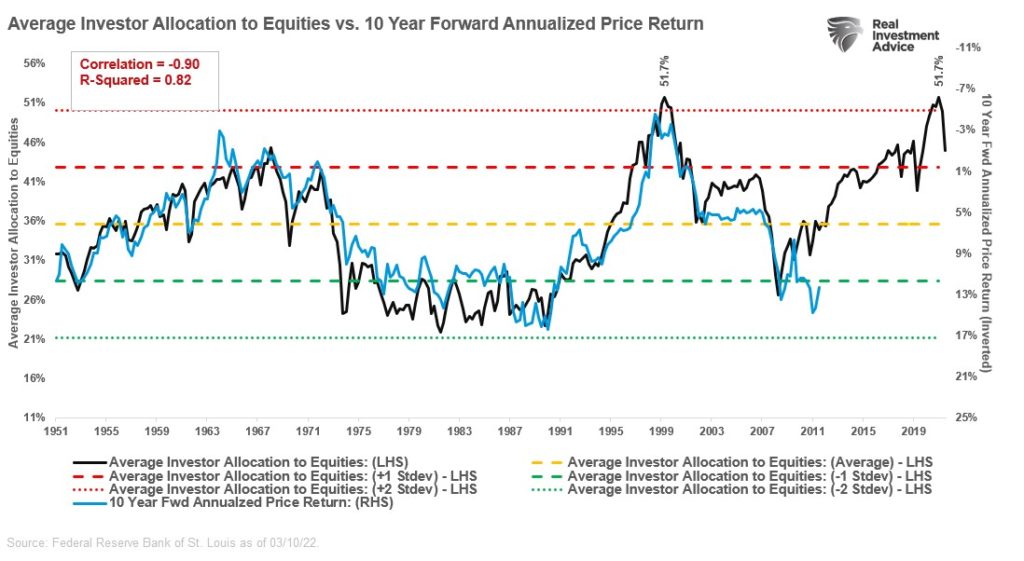
More importantly, current allocations to equities are more than two standard deviations above the norm. Per Jim:
“Since 1952, we’ve only had 4 quarterly observations above the two standard deviation line. Each of which resulted in negative returns (CAGR) for the subsequent 10 years. We now have a 5th.”
If you think his analysis is overly “bearish,” it isn’t. As discussed in “Long Term Returns Are Unsustainable,” the returns over the past decade have been rather extraordinary.
“The chart below shows the average annual inflation-adjusted total returns (dividends included) since 1928. I used the total return data from Aswath Damodaran, a Stern School of Business professor at New York University. The chart shows that from 1928 to 2021, the market returned 8.48% after inflation. However, notice that after the financial crisis in 2008, returns jumped by an average of four percentage points for the various periods.”
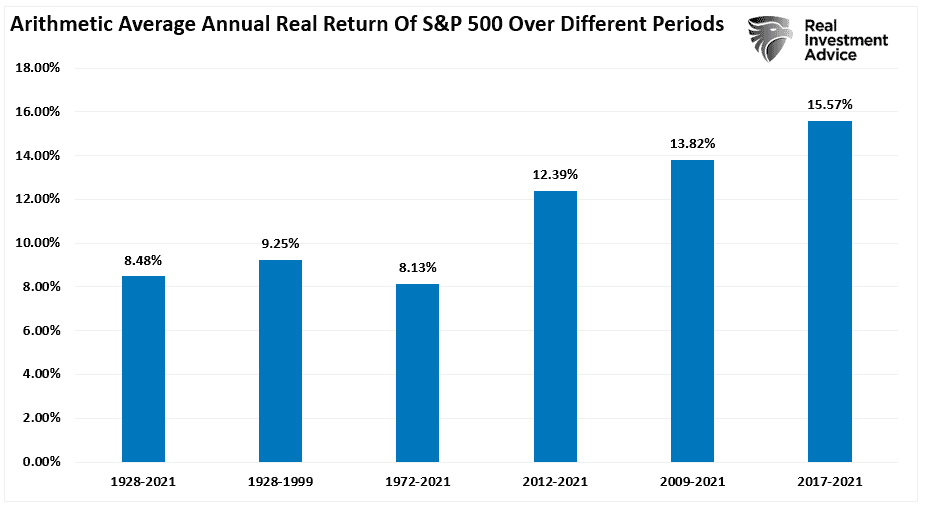
Those returns were fostered by a decade of monetary and fiscal interventions, creating 2-sigma deviations in returns that economic growth rates can not support.
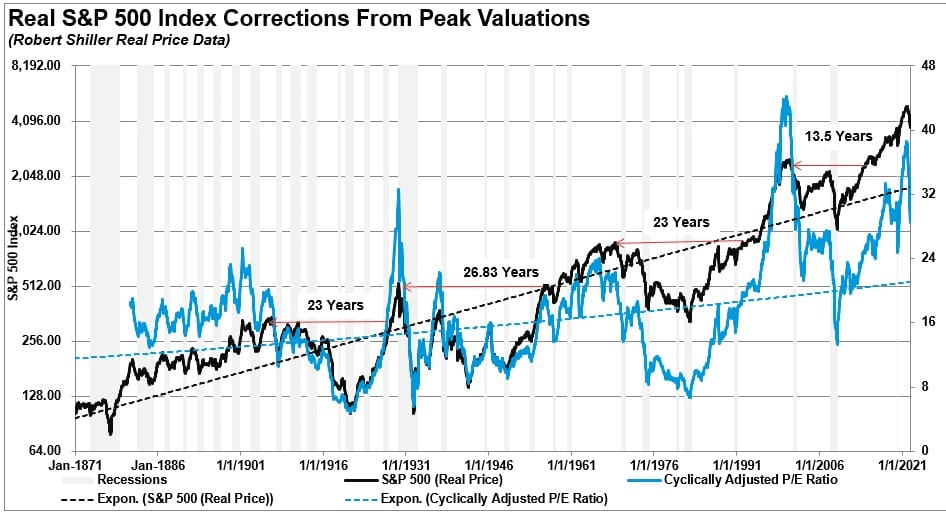
Suppose valuations are correct, and 150 years of historical evidence hold true over the next decade. In that case, there is a significant probability that equity returns will fall toward zero on a “buy and hold” basis.

Bonds As A Hedge
Regarding the 60/40 portfolio allocation, bonds provide three very significant benefits.
- Lower volatility
- An annual income stream
- And most importantly, the return OF your principal
The chart below shows the total inflation-adjusted return of stocks versus bonds. Since 1998, the difference between a 100% stock versus a 100% bond portfolio is just $65. More importantly, during the two major bear markets, an all-bond portfolio vastly outperformed with much lower volatility.
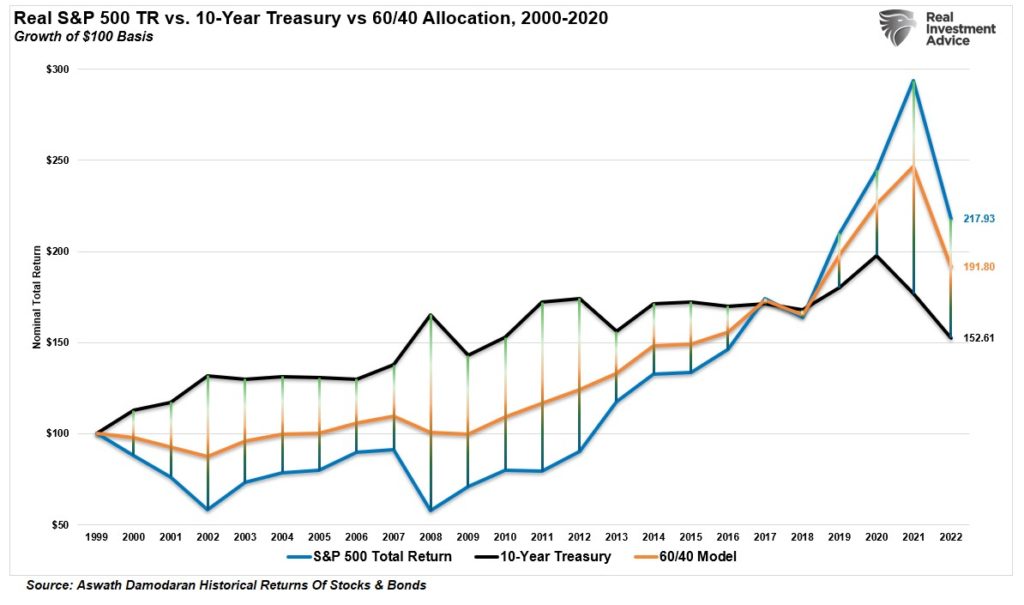
The 60/40 allocation performed substantially better than an all-stock portfolio during the bear market periods. Currently, the 60/40 allocation only lags by $26. Notably, the all-bond portfolio outperformed the all-stock portfolio until 2017. The media tends to miss that point.
It is hard to resist getting caught up in an accelerating market. But the recent underperformance of bonds will likely revert to outperformance over the next decade. Such gets repeated throughout history.
If we assume “valuations” are correct in predicting low return rates over the next decade; we can model out a conservative model of performance between stocks and bonds, using historical returns.
It is critical to understand that when “forward returns” are discussed, it does not mean every year is zero to negative. It means the average rate of return over the period will encompass one or more years of negative returns.
The model below assumes more volatility in equities over the next decade, providing a total real return of roughly 2% (not zero or negative). We also think that bonds deliver a relative performance gain, with yields dropping to 1% and bond prices rising.
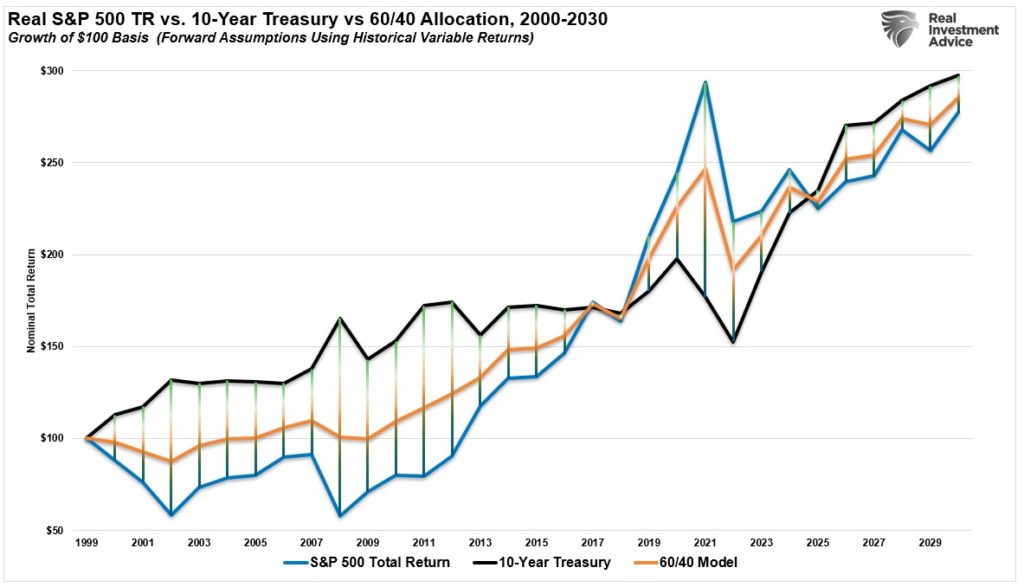
Even if we assume interest rates rise and inflation is permanent, bonds would still outperform stocks over the next decade on a nominal basis. Such is because if rates and inflation do spike to higher levels, in an economy dependent on debt for growth, the stock market will….well, we don’t even want to think about that.

Conclusion
For investors, there are several important factors to remember about bonds versus stocks.
- If I own bonds and am wrong about the direction of interest rates and inflation, I get 100% of my principal back, plus interest, at maturity.
- If I am wrong about the stock market, I lose capital and time.
Another value of having bonds in your portfolio is the reduction in volatility. When volatility spikes, investors react emotionally, leading to a litany of investment mistakes.
“The investor’s chief problem – and even his worst enemy – is likely to be himself.” – Benjamin Graham
By reducing volatility, and the emotional battle, investors can take a more logical approach to manage their portfolio over time. As John Hussman once stated:
“That ability to respond to changing market conditions in a disciplined way is the one thing that passive buy-and-hold investors don’t have. I strongly believe that it’s the primary factor that will determine investment success over the coming decade. Lacking a flexible discipline, my view is that passive investors are doomed to go nowhere in an interesting way over the coming 10-12 year horizon.”
In a market, economy, and globe supported almost entirely by debt, expectations for economic growth, inflation, and interest rates can only remain low or go lower.
“If there is one common theme to the vast range of the world’s financial crises, it is that excessive debt accumulation, whether by the government, banks, corporations, or consumers, often poses greater systemic risks than it seems during a boom.” — Carmen Reinhart
Whether you think the bear market will occur sooner or later, bigger or smaller, is mostly irrelevant. The point of the exercise is that if “valuations matter” and bonds provide lower volatility and principal protection, the 60/40 portfolio is not “dead.”
It is likely the allocation you will want over the next decade.

