
Here we go again. At the peak of the mortgage bubble, leading to the Great Financial Crisis (GFC), lenders were offering zero down mortgages. As you may remember, that ended poorly. Accordingly, we presumed that the mistake would not be repeated. We are proven wrong. Per CNN, United Wholesale Mortgage (UWM) is offering mortgage borrowers a traditional 30-year mortgage for 97% of the purchase price and a 3% interest-free loan for the remaining 3%. The 3% interest-free loan does not accrue interest, but the loan must be paid back if you sell the home or refinance the mortgage. In other words, a borrower does not come to the settlement table with cash and thus has zero home equity on day one. Compare that to data from ATTOM below, which shows that the median down payment across the United States is 15%.
UWM claims their robust underwriting process will help ensure this is a profitable business for them. Per the article:
“People who make these claims are uneducated about the current state of the industry,” Alex Elezaj, UWM’s chief strategy officer, told CNN. “In today’s environment, UWM is responsible for underwriting the loan, which gives us confidence that these are high quality loans.”
They may have excellent underwriting, but zero-down mortgages are a recipe for problems. Without sufficient equity in a house, zero down borrowers will have trouble refinancing into a new mortgage when mortgage rates fall. Further, if home prices decline, the lender has no equity to cushion a default. As we saw in 2008, some borrowers will mail in the keys to the bank and make the loss the bank’s problem. It will be interesting to see if zero down mortgages are a one-off offering from UWM or a product their competitors will soon offer.

What To Watch Today
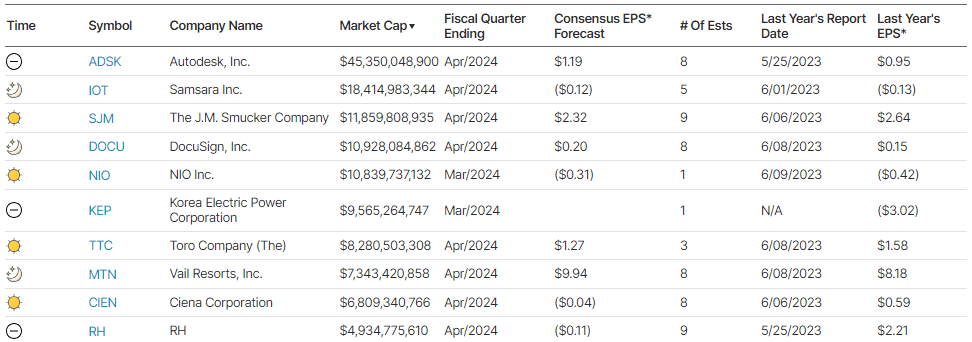
Earnings
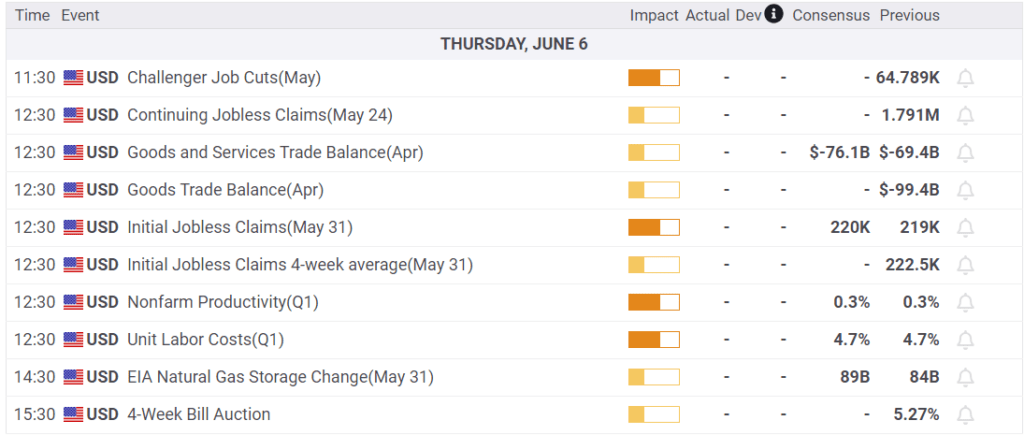
Economy
Market Trading Update
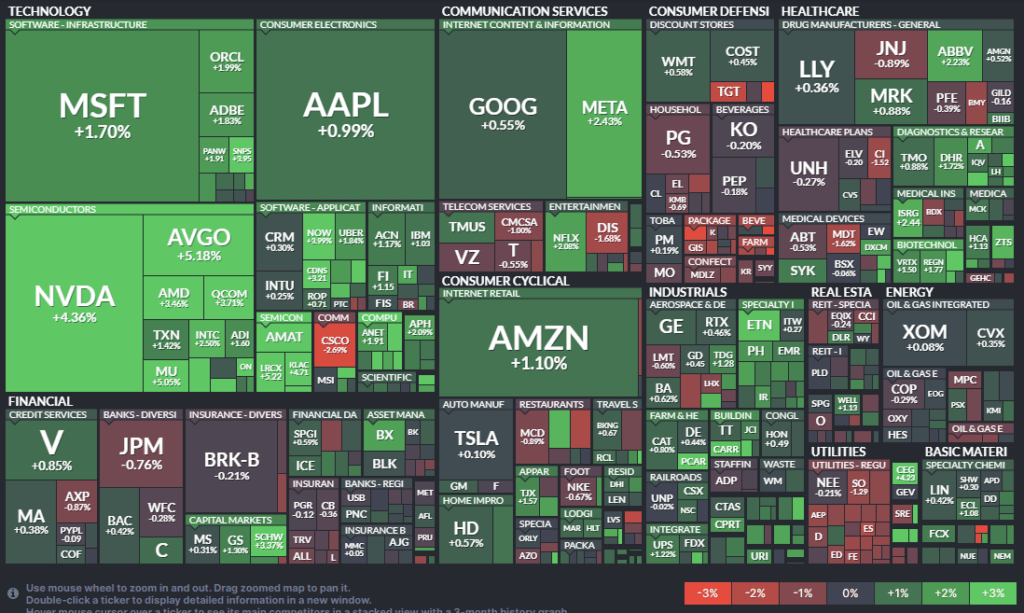
Yesterday’s commentary noted that the market continues to hold support along the bullishly trending moving averages. However, the internal breadth of the market remains a non-confirmation of the current bullish views. The market rallied strongly yesterday, with many familiar names leading the charge, with Semiconductors at the head of the pack. Such remains a familiar rally theme over the last several months, where a brief rotation into defensive stocks quickly returns to the “Magnificent 7.”
While it seems unlikely, Danny and I discussed what a potential market reversal would look like on yesterday’s Real Investment Show. I got a few emails asking if I could reproduce the chart I quickly threw together during the broadcast. I used a simple 50- and 200-month moving average during the show. However, the following chart uses a 24, 48, and 96-month moving average, which are better trend lines for the market. The 48-month moving average was the trend line support for the “Dot.com” crash. That moving average was taken out during the “Financial Crisis,” which bottomed at the 96-month moving average. Since the onset of the liquidity-driven, zero-interest rate cycle in 2009, the 24-month moving average has supported the bull market.
Using a Fibonacci retracement sequence, a correction back to the 96-month moving average would be a roughly 50% decline from current levels and would equate to the previous two bear market cycles. However, such a decline would require a 61.8% retracement of the market from current levels, suggesting a really deep economic recession/credit cycle has unfolded. The most likely corrective levels for a more normal economic recession will be a retest of the 24- or 48-month moving averages with a maximum drawdown of a 38.2% retracement, which would align with the 2022 corrective lows.
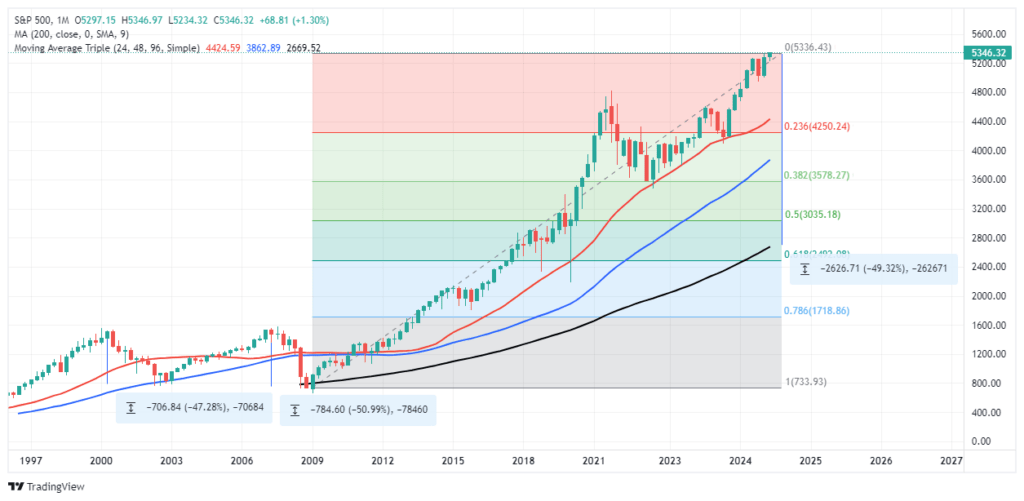
This is strictly a hypothetical exercise but does provide some reasonable risk/reward analysis for the future.

ADP and ISM Services
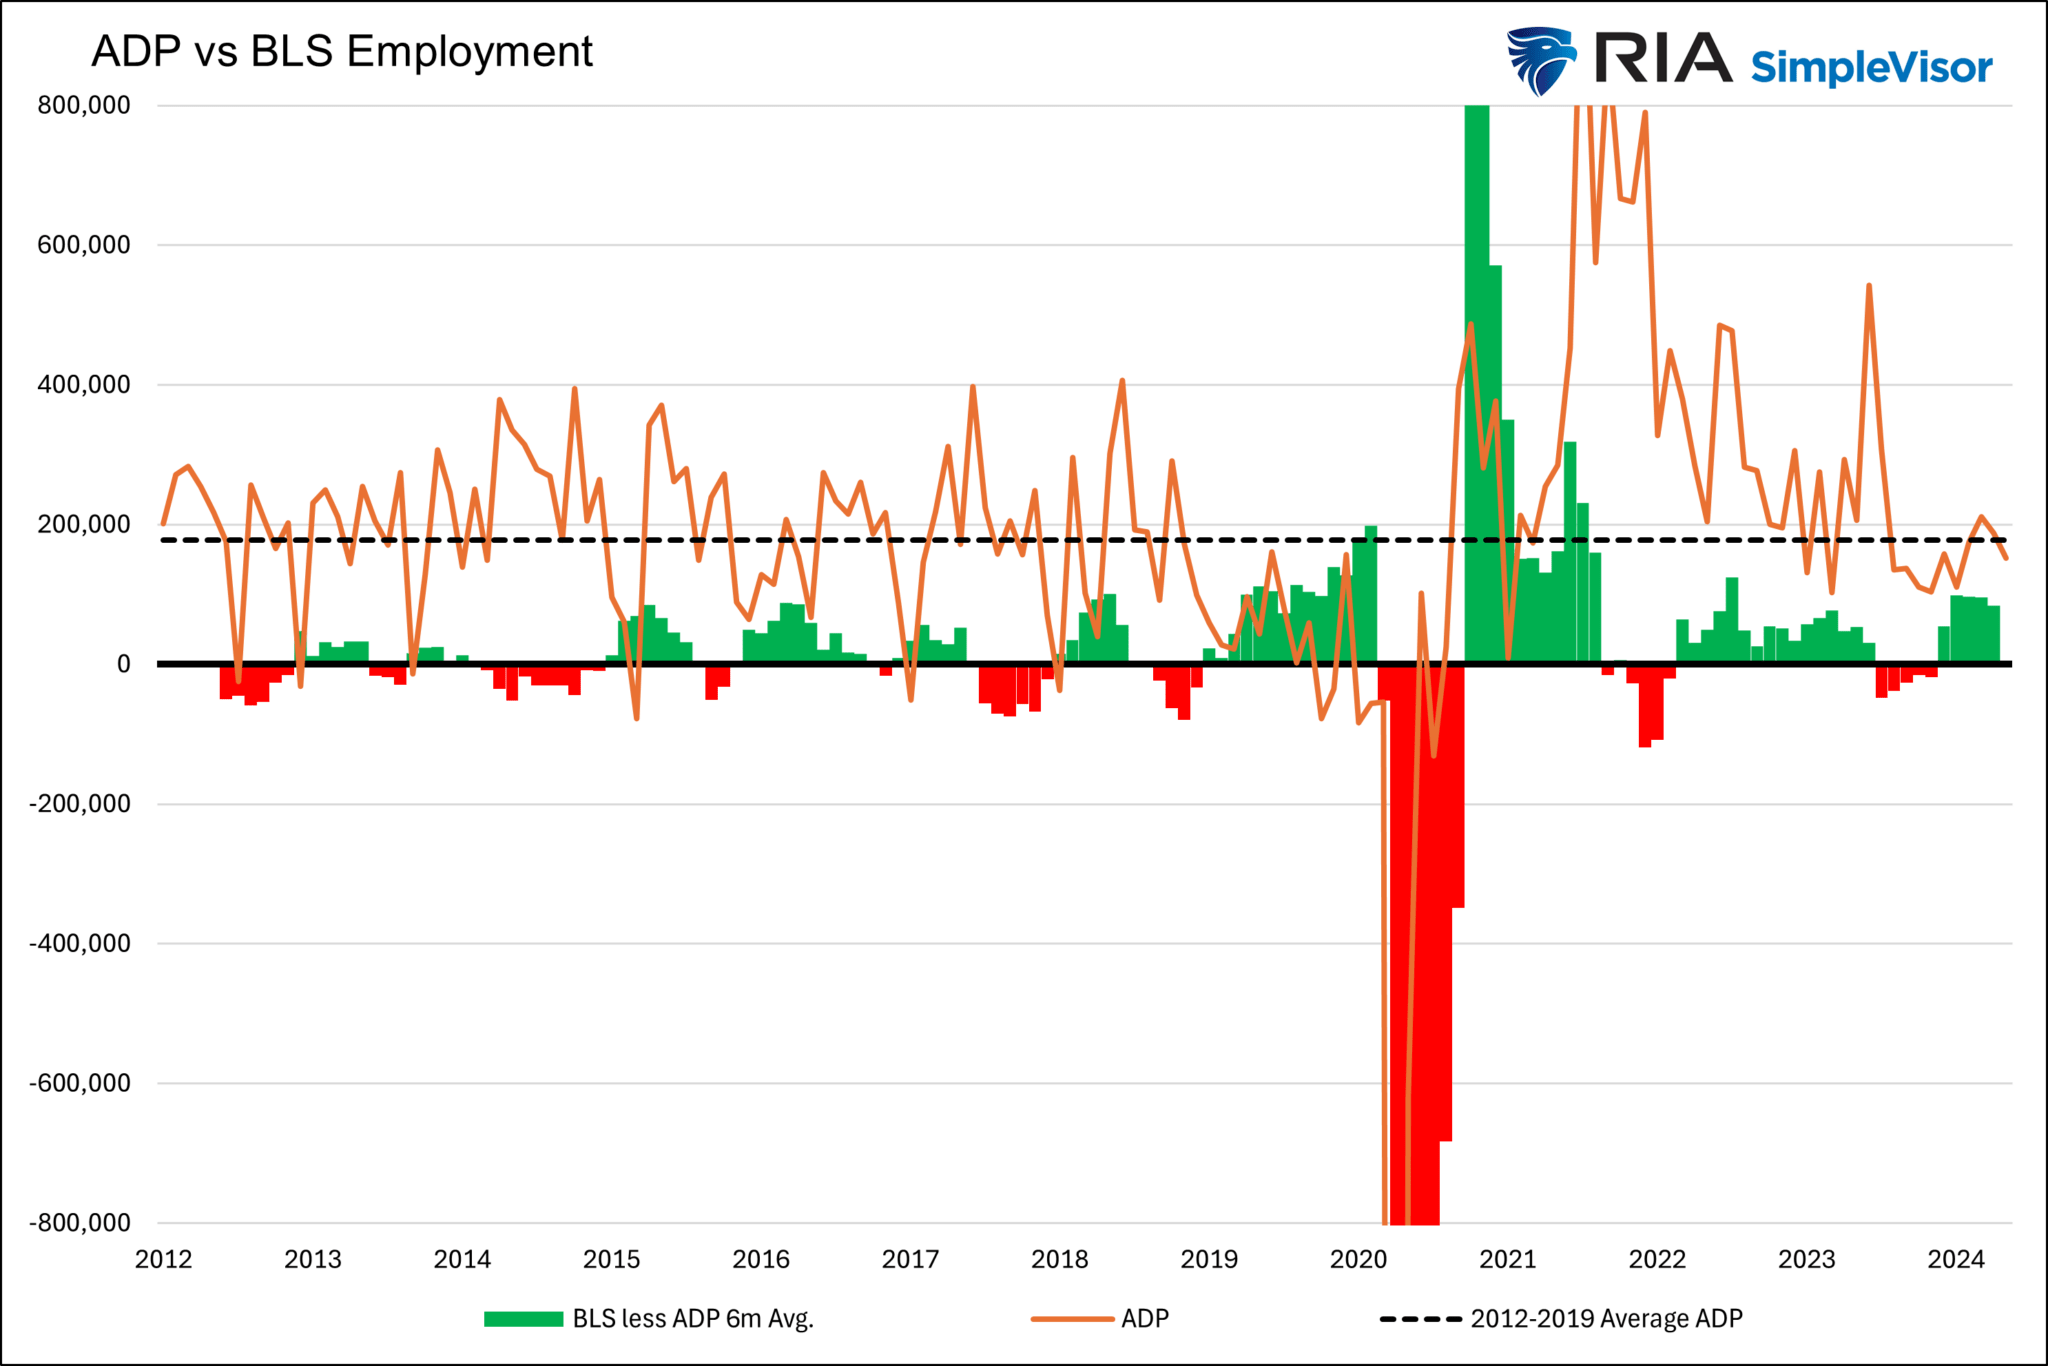
The ADP reported the economy added 152k jobs last month, below the 175k expected jobs. The quote below from ADP’s Chief Economist, Nela Richardson, summarizes the report well.
Job gains and pay growth are slowing going into the second half of the year. The labor market is solid, but we’re monitoring notable pockets of weakness tied to both producers and consumers.
The graph below charts the monthly change in ADP employment (orange). The dotted line represents the 2012-2019 average. As shown, job growth has been below the pre-pandemic average for nearly a year. The green and red bars highlight the six-month moving average of the difference between BLS job growth and ADP. Thus far, in 2024, the average difference is nearly 100k jobs. The average was only 16k between 2012 and 2019. Based solely on this data, it appears the BLS jobs data is due for a “catch-down” with ADP.
On the heels of an unexpectedly weak ISM manufacturing survey, the ISM services sector survey was stronger than expected at 53.8, well above estimates of 50.8 and last month’s 49.4. Given that the service sector represents over three-quarters of the U.S. economy, this survey indicates continued economic growth. The employment sub-component was 47.1, below expectations and 50. Such points to a contraction in service sector jobs. The price index was 58.1, a relatively high number but below the previous reading of 59.2 and expectations of 60.0. The graph below shows that ISM services have fluctuated between 50 and 55 for the last year and a half. Before the pandemic, the range was 55 to 60

The Bank Of Canada Cuts Rates
On Wednesday, the Bank of Canada (BOC) cut its overnight borrowing rate from 5.25% to 5.00%. Similar to the Fed, the BOC is making interest rate decisions one meeting at a time. However, they expect further cuts if inflation continues to ease.
The graph below shows that central bank rates between the U.S. and Canada are often very similar. Hence, might this be a precursor to the Fed cutting rates?

Tweet of the Day
“Want to achieve better long-term success in managing your portfolio? Here are our 15-trading rules for managing market risks.”
Please subscribe to the daily commentary to receive these updates every morning before the opening bell.
If you found this blog useful, please send it to someone else, share it on social media, or contact us to set up a meeting.

