You’ve got to ask yourself one question. Do you feel lucky?
On November 9, 2020, Pfizer announced encouraging test results pointing to an effective COVID vaccine. In response, investors aggressively bought the stocks most negatively affected by COVID and sold those stocks that had benefited. For example, Netflix was down 8.6% while Disney was up 12%. Banking, industrials, materials, transportation, and energy stocks did well while technology and communications fell sharply. The divergence of winners and losers was one for the ages.
To wit, in our latest Technically Speaking we shared the following:
“The recent rally has been driven by the former losers and much of this performance happened after the PFEs 11/9 announcement of very positive vaccine data. The moves since 11/9 are so dramatic that they have destroyed many statistical models.
Jon Quigley who manages $3.8 billion wrote to clients, that events that happened statistically should never happen. The occurrence statistically only happens roughly once every:
‘5,944,505,312,905,660,000,000,000,000,000,000,000,000,000,000,000,000,000,000,000,000,000,000,000,000,000 days in a normally-distributed return series, (Bloomberg 11/13/20).”
The prospects of a vaccine and return to normalcy are exciting, but we do not share investor enthusiasm for stock prices. For starters, already tepid economic growth rates pre COVID will be weaker during the next expansion. Within that context, equity valuations do not reflect weak economic and earnings growth rates and appear far too high.
This article will address both issues and provide a clear road map free of unwarranted enthusiasm.
Future Growth
We start by looking backward so we can look forwards. The Decade Long Path Ahead To Recovery Part 1 shows how the growth rate in each of the last three economic expansions was lower than the one before it.
As we wrote: “The new paradigm of weak recoveries is due to the Fed’s policy prescription for recessions; debt-fueled consumption. Through lower interest rates they incentivize people, corporations, and the government to borrow. The benefits are here and now as economic recovery ensues. The cost is paid tomorrow.”
In simpler terms, during each recession, we pull consumption forward from the future and accumulate debt in its place. Accordingly, future economic growth is weaker.
In the same article, we show what that looks like over the last 40 years.
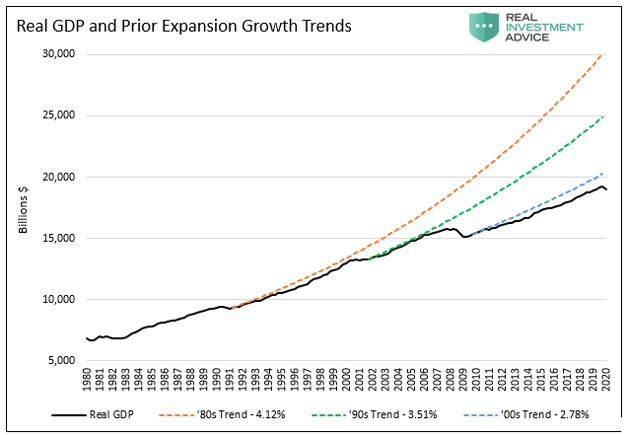
Had we grown our economy at the rate of the 1980s, GDP would be over 50% higher than it is today.
There is no doubt that massive amounts of new federal, municipal, and corporate debt used to weather the COVID storm will have the same economic dampening effect as it has had. Based solely on the strong relationship between the ratio of government debt to GDP, we estimate that the coming expansion’s real growth rate could be as low as 1.07%.
Corporate Earnings
Stock valuations are generally based on a multiple of expected future earnings. Expected future earnings are determined by future economic activity. If economic growth is slower in the future, then logically, corporate profits will follow. As shown below, corporate profits and economic growth are well correlated.
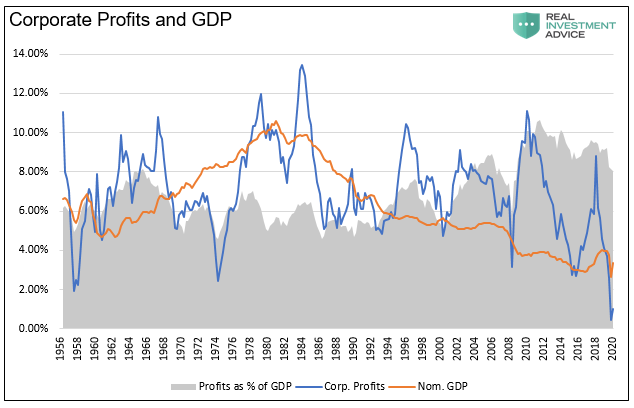
Thus far, we have established that economic growth is likely to be lower than it was in the past decade. Therefore we can also assume that corporate profit growth will also be weaker than in the past decade.

Current Valuations
The economic prognosis and earnings outlook may appear to be bad for stocks. While useful data, what matters most is price. At the right price, everything has value regardless of its outlook. Accordingly, an assessment of valuations offers essential insight about whether or not share prices compensate investors for a weaker economic environment.
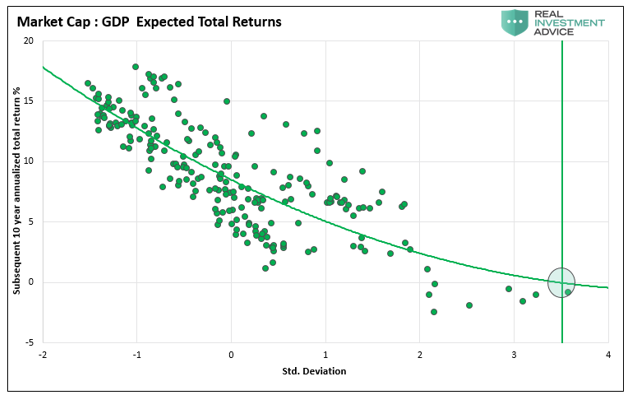
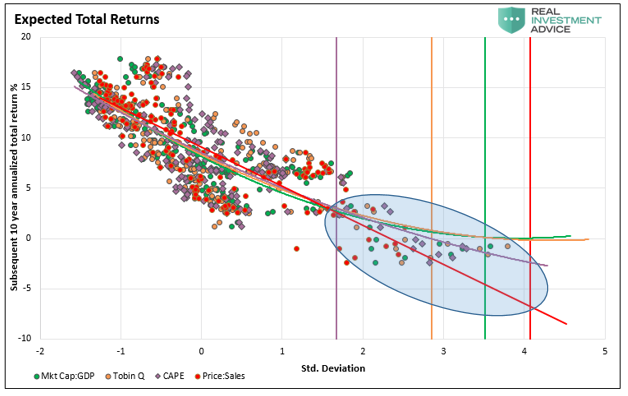
The scatter charts below illustrate various valuation techniques. Within the graphs, each dot represents quarterly comparisons of the valuation metric and the subsequent ten year annualized total return of the S&P 500. The trend line slicing through the data helps us approximate how returns stack up against the various valuation levels. We use standard deviations of each valuation versus actual readings to graph them together and individually. The vertical line shows the current standard deviation. The intersection of the trend and standard deviation line, as circled, highlights the expected annual return.
In all of the graphs except price to sales, the data covers the period from 1954 to the present. Price to sales data starts in 1965.
Market Cap to GDP
Market Cap to GDP, supposedly one of Warren Buffett’s favorites, compares the stock market’s size relative to the economy. Given the strong correlation of corporate earnings to GDP, this ratio has a lot of validity.
Currently, the ratio is near 1.50, or more than twice the historical average. The only other time it was this high was in the first quarter of 2000, as the tech bubble was bursting. As shown, the expected annualized return for the next ten years is 0%.
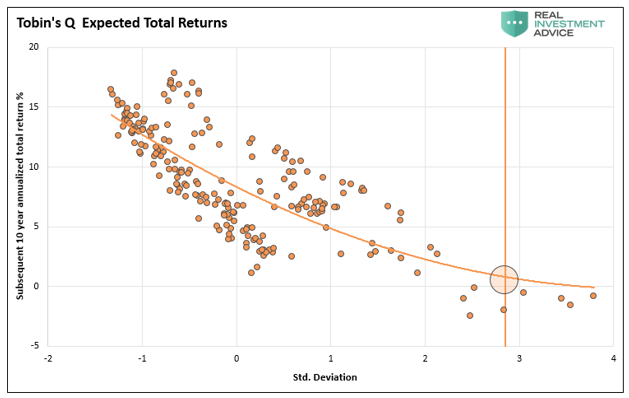
Tobin’s Q Ratio
Tobin’s Q ratio measures the relationship between the total equity market cap and its aggregate intrinsic value. Intrinsic value is simply the replacement cost of a company or market’s assets. The ratio quantifies if a market or a stock is over or undervalued.
Currently, the ratio is near 1.80, or more than two and a half times the historical average. Similar to the ratio of market cap to GDP, the only other period Tobin’s Q ratio was this high was during the 2000 tech bubble. The expected annualized return for the next ten years is 1%.
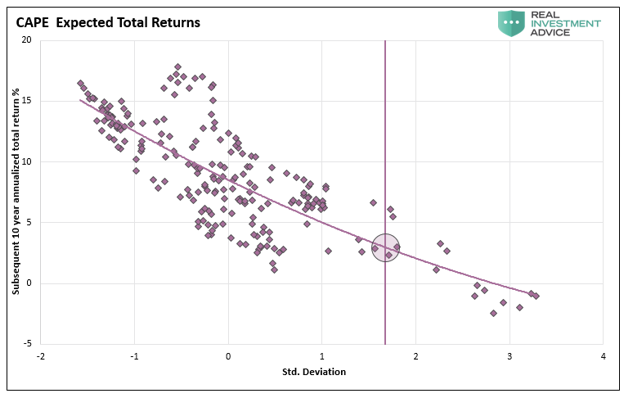
Cyclically Adjusted Price-to-Earnings Ratio (CAPE 10)
CAPE 10 uses Nobel Laureate economist Robert Shiller’s methodology to generate secular price to earnings ratios. The model averages ten years’ of historical earnings versus more commonly used one year periods. This tweak provides a more stable measure that is not as subject to temporary economic and earnings gyrations.
Currently, the ratio is 33, or about 75% higher than the historical average. Like the prior two indicators, the only other period it was higher was in the late 1990s. The expected annualized return for the next ten years is +2.5%.
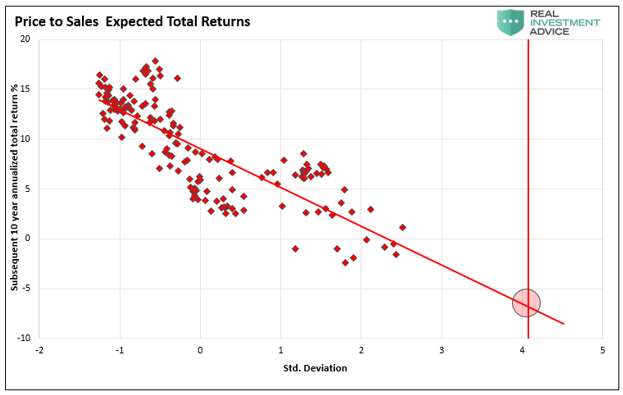
Price to Sales
The price to sales ratio is the multiple investors are willing to pay for revenues. CAPE 10 and traditional one-year price-to-earnings ratios use earnings per share in the denominator. Share buybacks and accounting gimmickry artificially boost earnings per share. Revenues, on the other hand, are much harder to manipulate.
Currently, the ratio is 2.59, or about 300% more than the historical average. Unlike the prior periods, the market has never seen anything close to current levels. The expected annualized return for the next ten years is -6.5%.
Summary of Four Factors

The Fed
Regardless of the economic environment, taking significant risks and accepting pitiful expected returns is a bad idea. However, there is one more factor we must consider. The Federal Reserve supplies a massive amount of liquidity, much of which is finding its way into the asset markets.
The Fed will likely continue as long as inflation is held at bay. The result may be that stock prices continue to rise, and valuations eclipse all prior norms. However, the music will stop someday, and the facts presented here will be apparent.
Summary
In the movie Dirty Harry, Clint Eastwood famously said, “You’ve got to ask yourself one question. Do I feel lucky?”
If so, the trend is your friend. The Fed will continue to supply liquidity, which will help the market ignore the reality of the barometers shown above. As we saw in March, that does not preclude hair-raising volatility and large declines, but it does support prices on the margin regardless of the environment.
The average of the 10-year expected returns from the four gauges is -0.75%. When the Fed backs off, whether by its design or due to inflation, slower economic growth, or massive debt overhead, rich valuations will matter.
At that point, investors who feel lucky are likely to find themselves staring down Mr. Market’s version of a .44 Magnum.


Michael Lebowitz, CFA is an Investment Analyst and Portfolio Manager for RIA Advisors. specializing in macroeconomic research, valuations, asset allocation, and risk management. RIA Contributing Editor and Research Director. CFA is an Investment Analyst and Portfolio Manager; Co-founder of 720 Global Research.
Follow Michael on Twitter or go to 720global.com for more research and analysis.
Customer Relationship Summary (Form CRS)
Also Read