


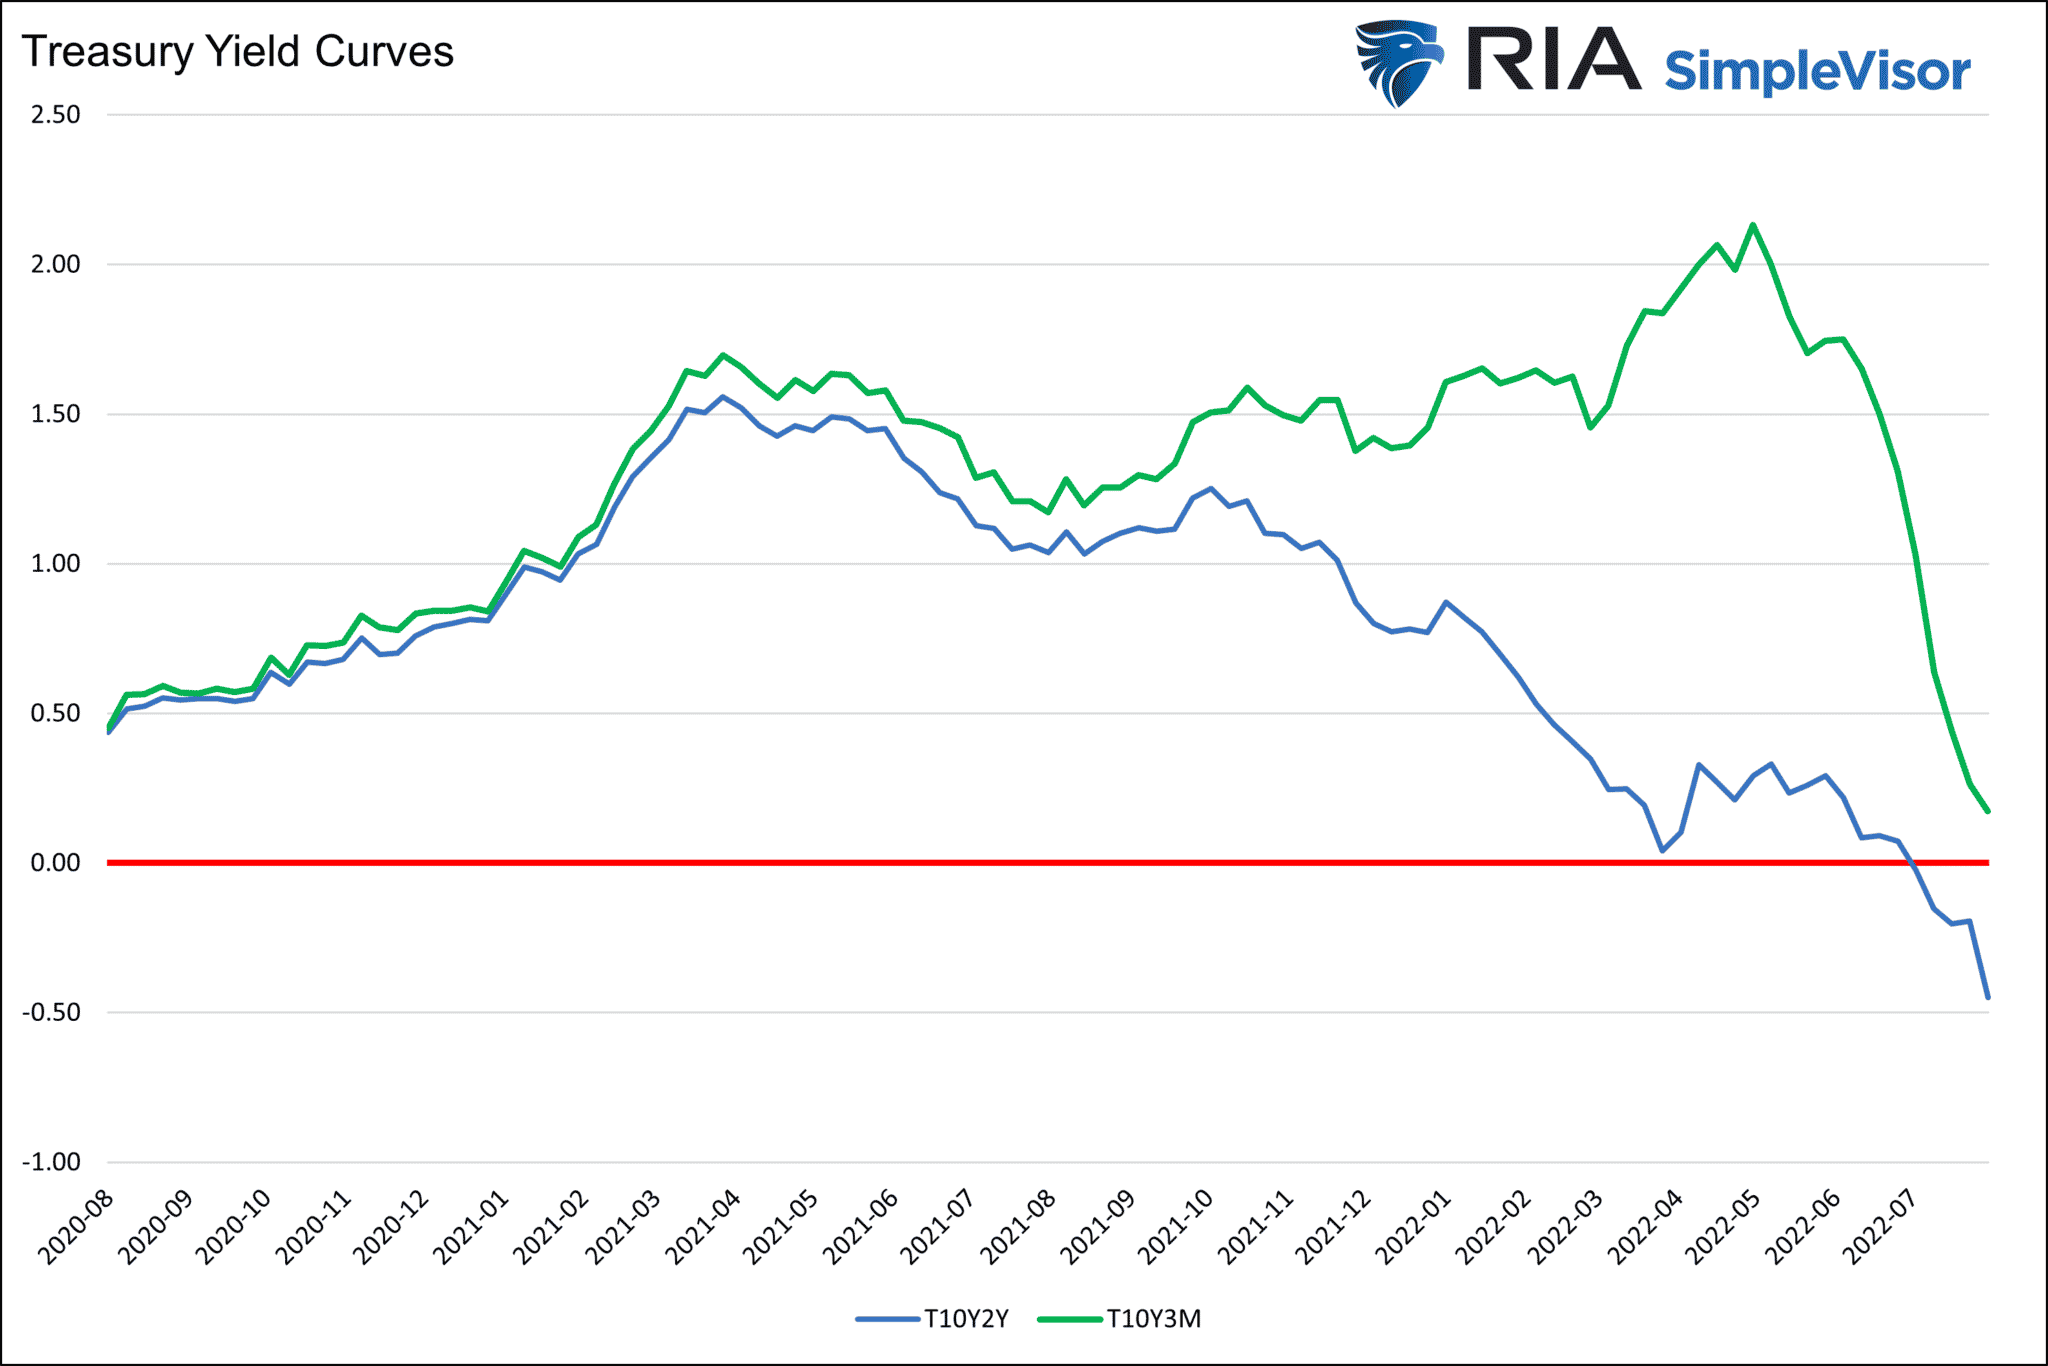
Bond traders and economists pay close attention to various yield curves as they are good prognosticators of future economic activity. They will tell you that when the well-followed 2yr/10yr yield curve inverts start preparing for a recession. While an inversion followed by the ultimate un-inversion has always led to a recession, it is not the best timing tool. Of all the yield curves, the time to hunker down is when the 3m/10yr yield curve inverts and then steepens. Looking at yield curves today, we see the 2yr/10yr curve is the most inverted (-.44%) since 1981. It screams eventual recession. However, the 3m/10yr curve is positive at .12%. The 3month Treasury Bill yield will creep higher daily. Accordingly, the 3m/10yr will invert in a week or two. Inversions of both yield curves put us on high alert. But the alarm will not sound until both yield curves steepen into positive territory.

What To Watch Today
Economy
- 7:00 a.m. ET: MBA Mortgage Applications, the week ended August 5 (1.2% prior)
- 8:30 a.m. ET: Consumer Price Index, month-over-month, July (0.2% expected, 1.3% prior)
- 8:30 a.m. ET: CPI excluding food and energy, MoM, July (0.5% expected, 0.7% prior)
- 8:30 a.m. ET: CPI year-over-year, July (8.7% expected, 9.1% prior)
- 8:30 a.m. ET: CPI excluding food and energy, year-over-year, July (6.1% expected, 5.9% prior)
- 8:30 a.m. ET: Real Average Hourly Earnings, YoY, July (-3.6% prior revised to -3.4%)
- 8:30 a.m. ET: Real Average Weekly Earnings, YoY, July (-4.4% prior revised to -4.0%)
- 10:00 a.m. ET: Wholesale Inventories, MoM, June final (-1.9% expected, 1.9% prior)
- 10:00 a.m. ET: Wholesale Trade Sales, month-over-month, June (0.5% expected, 0.5% prior)
- 2:00 p.m. ET: Monthly Budget Statement (-$175.0 billion expected, -$302.1 billion prior)
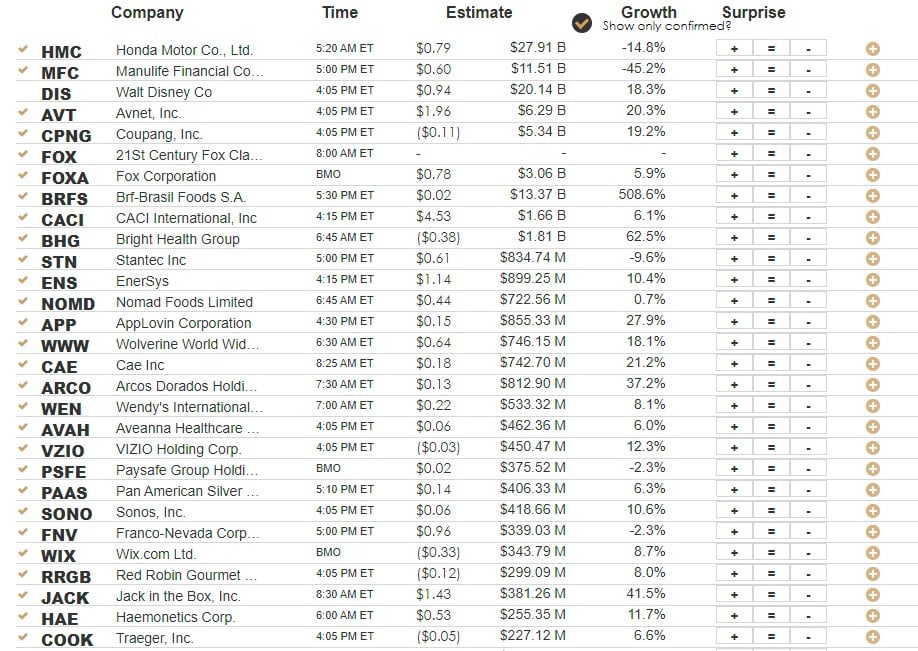
Earnings
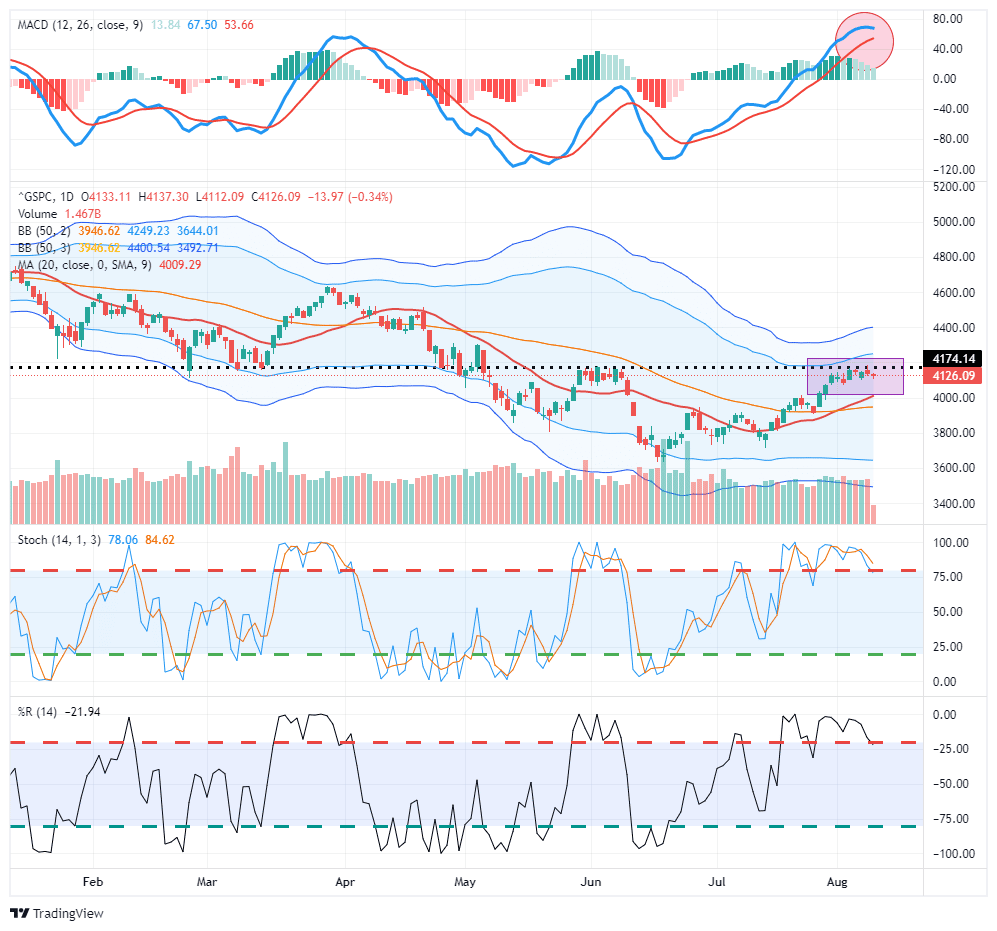
Market Trading Update – Market Stalls Ahead Of CPI
The markets have stalled their previous bullish run over the last several days in anticipation of the next CPI inflation report. A soft reading and reduction of the annual rate could lead to stocks screaming higher and yields falling as the market will think the Fed will ease up on rate hikes. However, a hotter than expected number could lead to a rise in yields and stocks falling as the Fed will be expected to maintain its more aggressive posture.
The reality is that tomorrow’s reading will have very little to do with the Fed’s inflation stance. They are unlikely to pivot towards easier monetary accommodation anytime soon, and only a severe market crash at this point would prompt them to cut rates back to zero and start QE. The only question is, when will the market figure that out?
For now, the bullish bias continues, but as shown, the extended MACD signal is softening and could trigger a sell signal in the next week or so. Whatever pullback markets provide, the 50-dma must hold if this bull market continues.
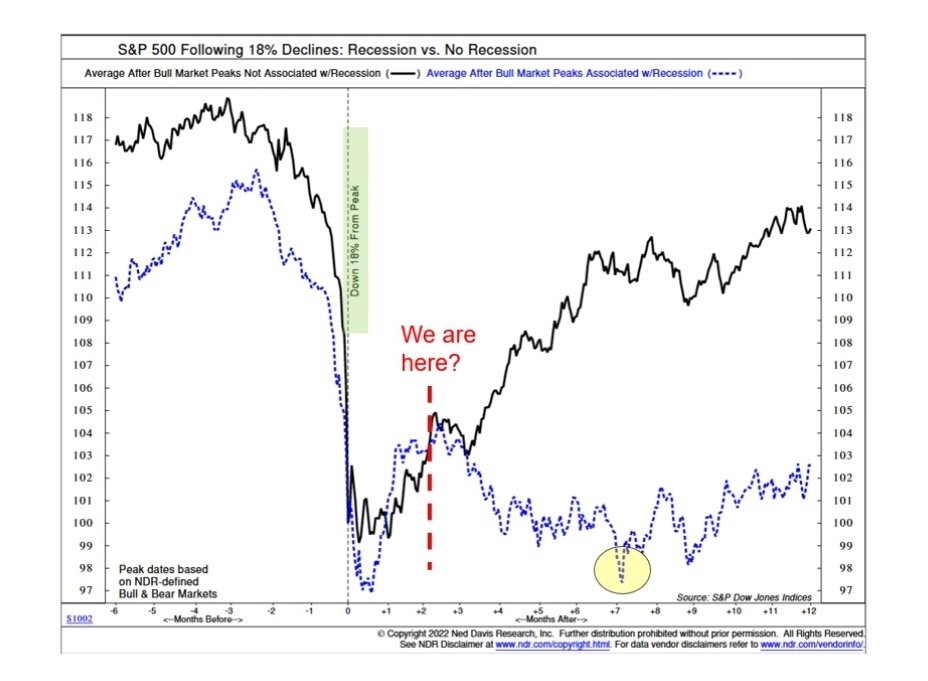
Recession or No Recession? The Answer Matters
The chart below sheds light on why the question of recession is a big deal for investors. If we are not headed for a recession, and the definition is debatable, we may be headed back toward old highs. Conversely, if the yield curves are correct and the NBER declares a recession in the coming months, then all bets are off, and a new, lower low may be in the cards.
Gasoline Prices
The good news is that daily gasoline prices have consistently declined for two consecutive months and now sit .67 cents less than a month ago. The bad news, as shown below in the AAA graph, is that gas prices are still well above levels of the prior three years. AAA thinks it’s possible the trend lower continues. Per AAA spokesman Andrew Gross:
Oil is the primary ingredient in gasoline, so less expensive oil is helpful in taming pump prices. Couple that with fewer drivers fueling up, and you have a recipe for gas prices to keep easing. It’s possible that the national average will fall below $4 this week.
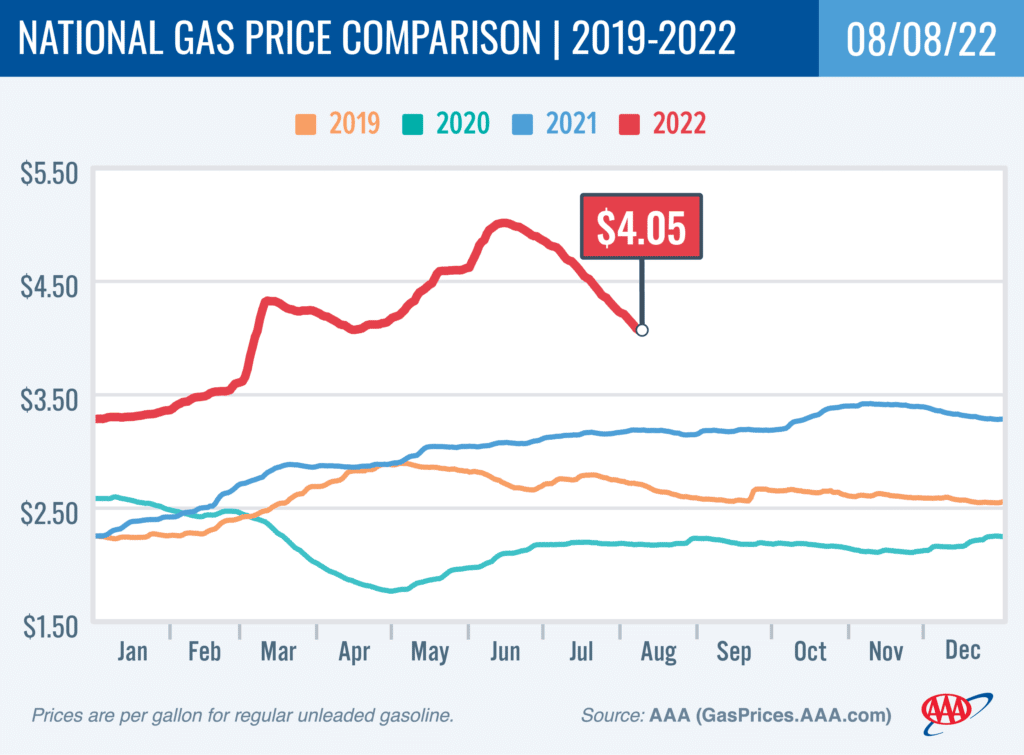
Below are a couple of interesting stats from the AAA’s latest report on gas prices:
- The nation’s top 10 largest weekly decreases: Washington, D.C. (−28 cents), Colorado (−23 cents), Arizona (−21 cents), Illinois (−21 cents), Indiana (−21 cents), Iowa (−20 cents), Ohio (−20 cents), Michigan (−19 cents), Missouri (−18 cents) and Minnesota (−18 cents).
- The nation’s top 10 least expensive markets: Texas ($3.55), South Carolina ($3.59), Oklahoma ($3.60), Arkansas ($3.60), Georgia ($3.61), Tennessee ($3.62), Mississippi ($3.62), Alabama ($3.64), Kansas ($3.66) and Iowa ($3.66).
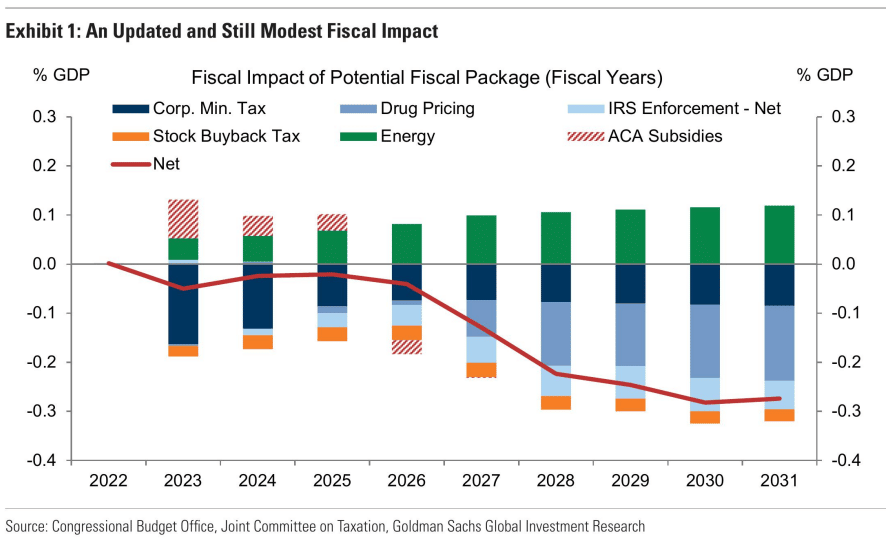
The New Fiscal Bill and Growth Expectations
The media has been debating whether or not the new bill being debated in Congress is inflationary or deflationary. Also up for debate but not well covered is the bill’s effect on economic activity. As we share below, per the CBO and Goldman Sachs, the bill is expected to detract from GDP over the next decade. The Fed’s natural long-run expected GDP growth rate is 1.8%-2%. Lopping off another .2-.3% from a steadily declining natural growth rate bodes poor for the economy of the late 2020s.
Tweet of the Day
Please subscribe to the daily commentary to receive these updates every morning before the opening bell.
If you found this blog useful, please send it to someone else, share it on social media, or contact us to set up a meeting.
Also Read


