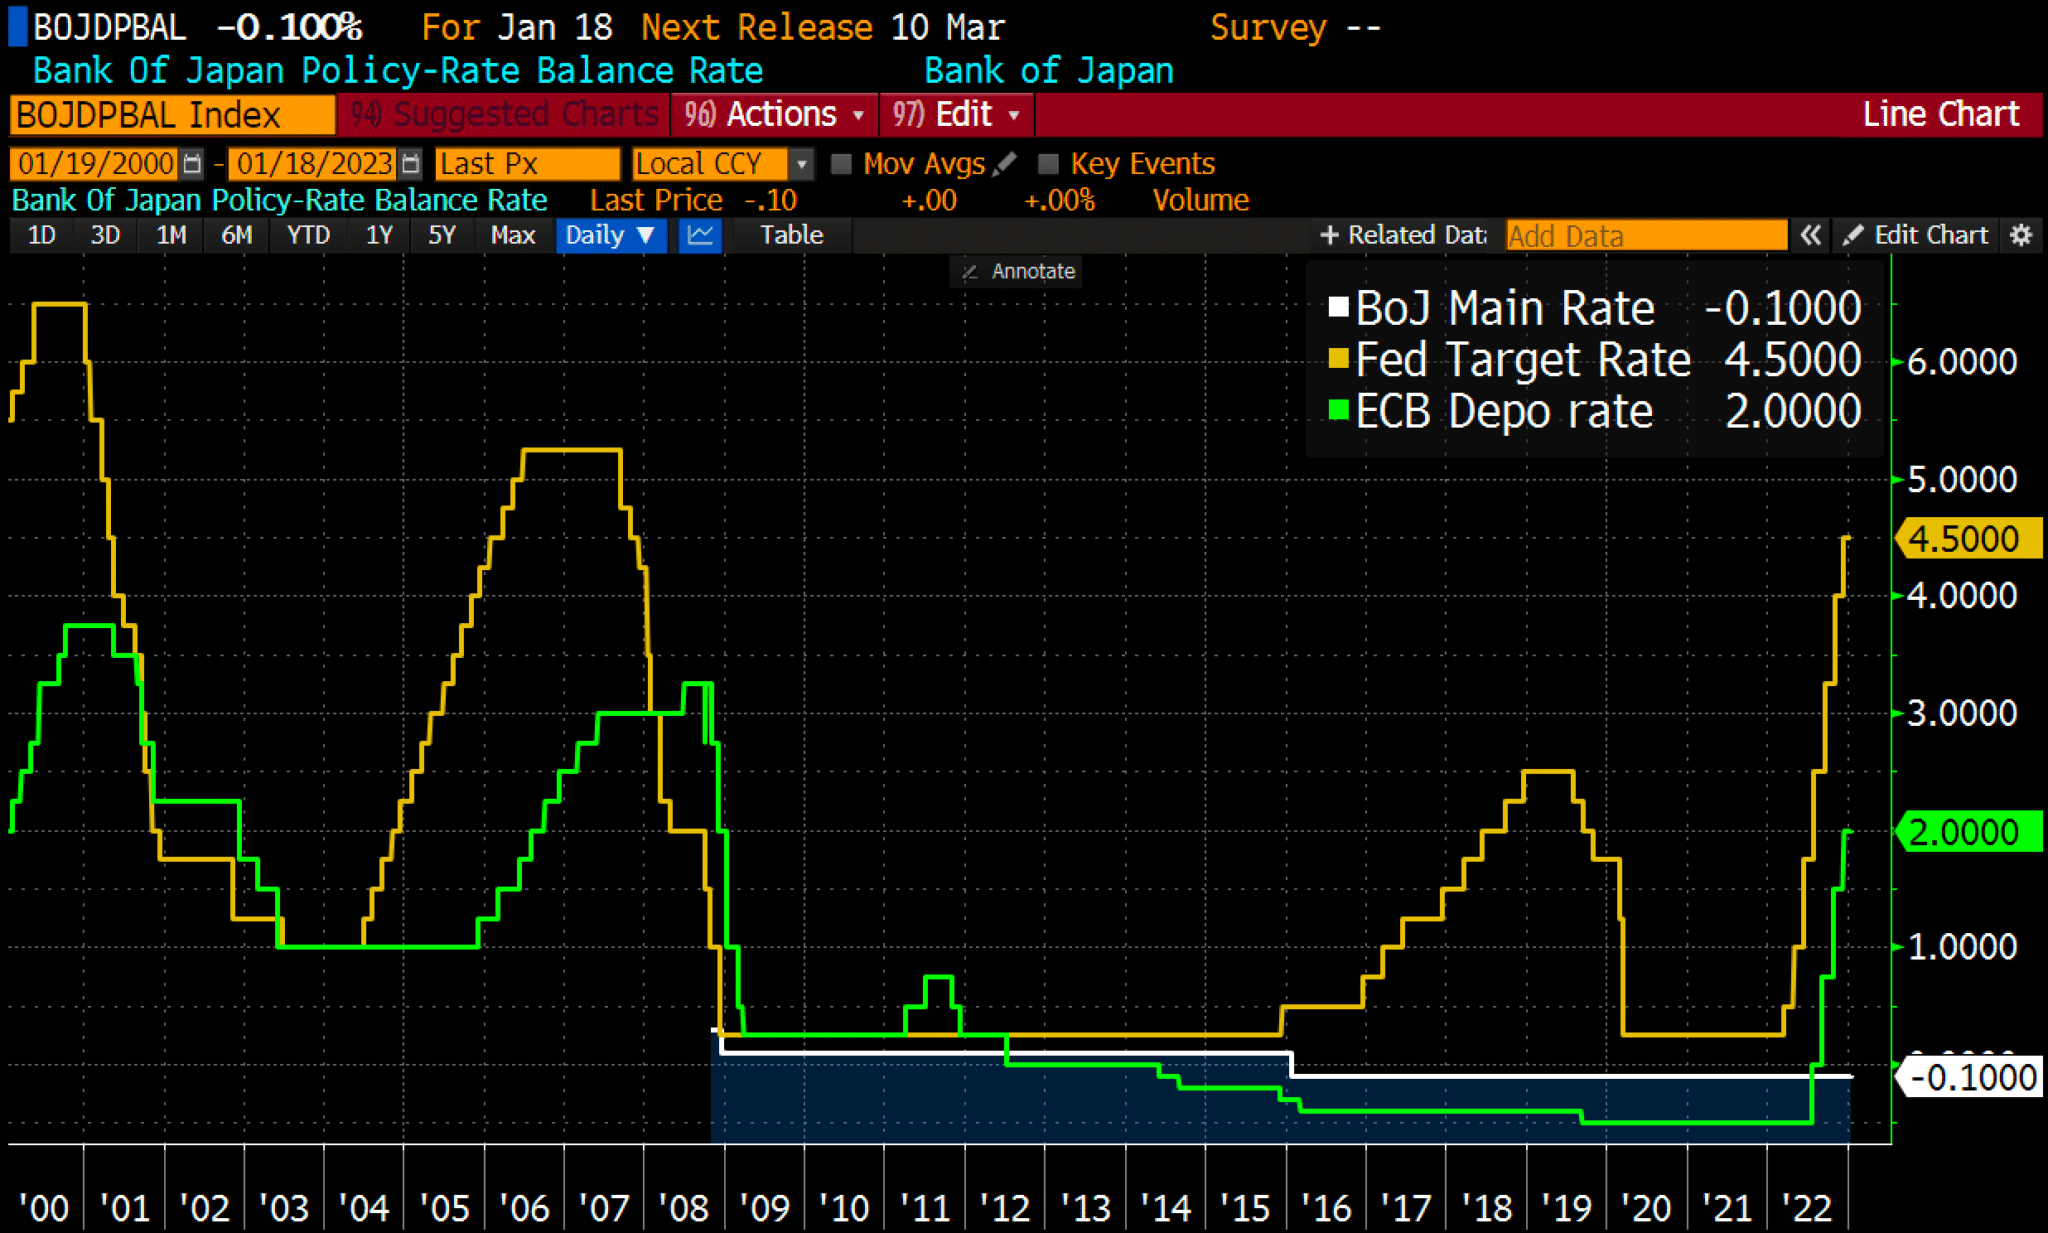
The Bank of Japan (BOJ) left its short-term interest rate at -.10% and vowed to maintain a 0.50% yield cap on its 10-year notes. Investors were expecting the yield cap to increase and thought the BOJ might raise its short-term interest rate. Instead, the BOJ disappointed, which set the yen and Japanese bonds on a roller coaster ride. As we comment in a section below, the BOJ bought bonds aggressively to keep the ten-year yield below its 0.50% cap.
The problem facing the BOJ is the tradeoff between low-interest rates and its currency. As we wrote in Japanese Inflation: “However, as the BOJ tries to stop rates from rising, they weaken the yen. Japan is in a trap. They can protect interest rates or the yen but not both. Further, its actions are circular. As the yen depreciates, inflation increases and the Japanese central bank must do even more Q.E. to keep interest rates capped.”
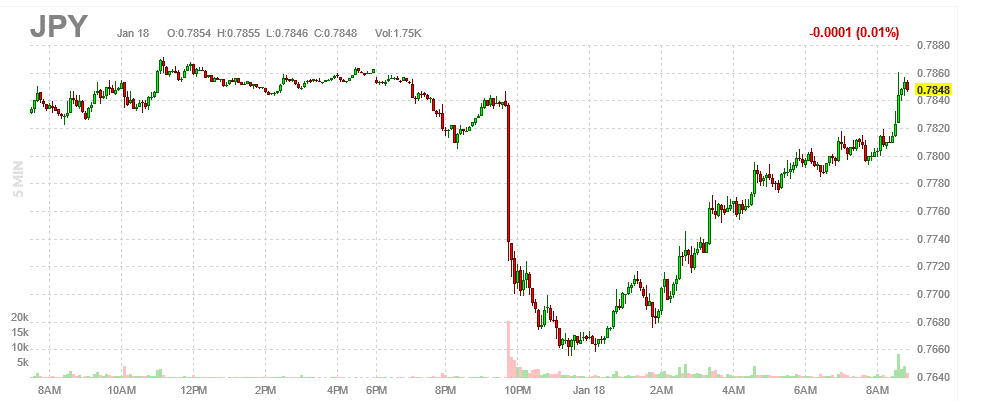
The graph below shows the wild volatility the yen experienced following the BOJ announcement. The yen, at times, has had a strong influence on U.S. bond yields and gold prices. Yesterday’s steep decline in U.S. bond yields is likely due to the continuance of the cap, which will continue to incentivize Japanese investors to invest in U.S. Treasury securities and other foreign assets.
What To Watch Today
Economics
- 8:30 a.m. ET: Housing Starts, December (1.358 million expected, 1.427 prior)
- 8:30 a.m. ET: Building Permits, December (1.365 million expected, 1.342 million prior)
- 8:30 a.m. ET: Housing Starts, month-over-month, December (-4.8% expected, -0.5% prior)
- 8:30 a.m. ET: Building Permits, month-over-month, December (1.0% expected, -11.2% prior)
- 8:30 a.m. ET: Philadelphia Fed Business Outlook Index, January (-11.0 expected, -13.8 prior)
- 8:30 a.m. ET: Initial Jobless Claims, week ended Jan. 14 (214,000 expected, 205,000 prior)
- 8:30 a.m. ET: Continuing Claims, week ended Jan. 7 (1.655 million expected, 1.634 million prior)
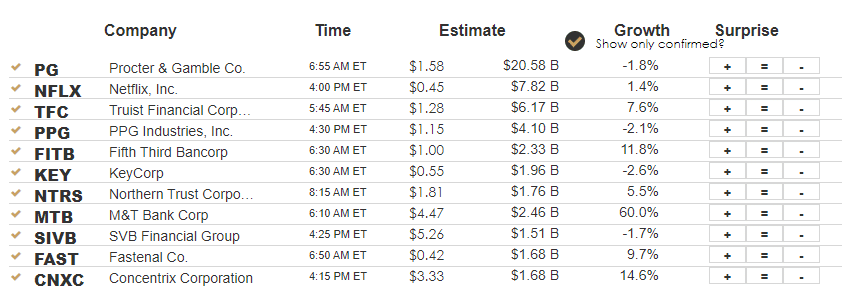
Earnings
Market Trading Update
Bad retail sales data, plummeting industrial production, and a Hawkish James Bullard spooked the market yesterday sending stocks lower to retest the 50-DMA. The good news is that the decline yesterday was fairly orderly. The bad news is that the market again failed at the downtrend line, putting the recent rally at risk. Importantly, the 50- and 20-DMA have also crossed above the 100-day suggesting a more bullish bias to the markets short-term.
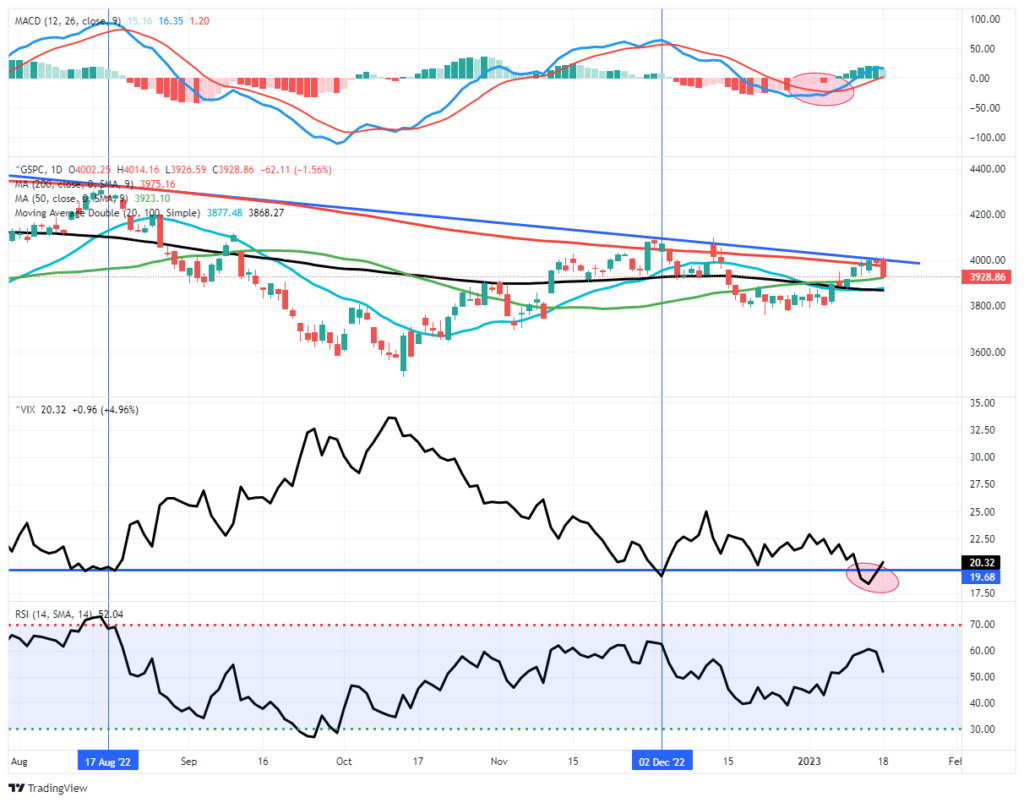
However, don’t dismiss the risk. The weak economic data has not been good for economic outlooks, and there is no hint of the Fed backing off continued rate hikes. While we did add a little exposure for the rally, we are still carrying a very overweight position in cash currently. We remain cautious for now, but if this rally is going to continue, we need to see the market bounce back by the end of the week.
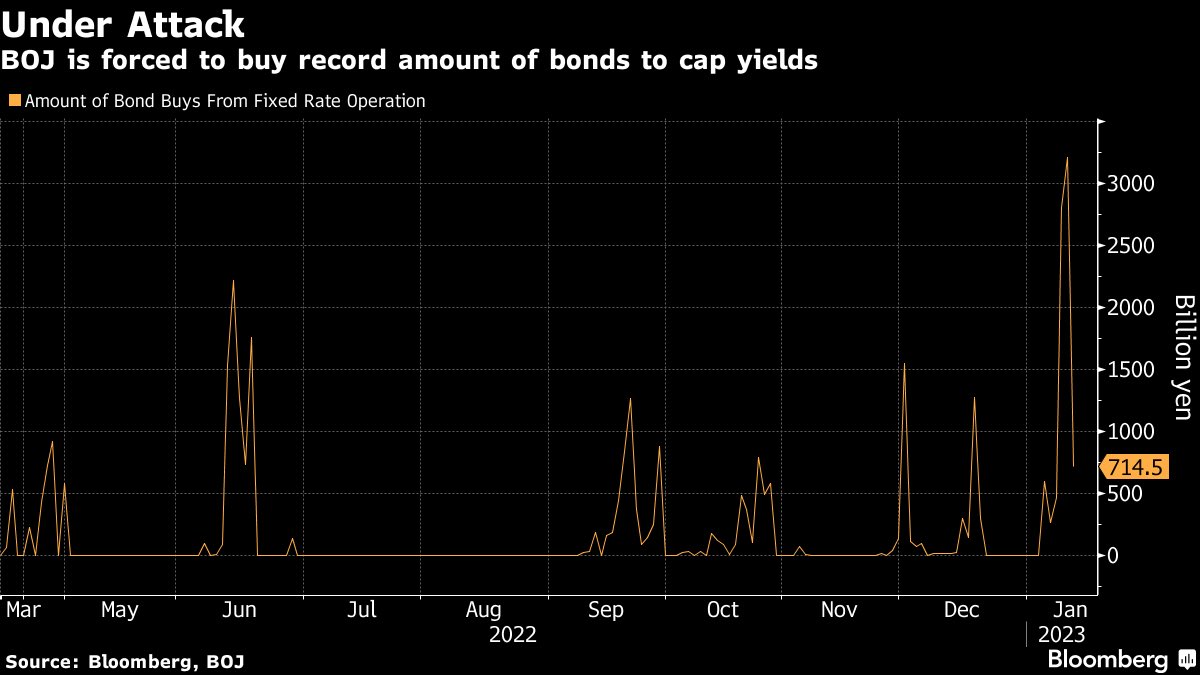
BOJ Fighting to Keep Yields Capped
Following the BOJ announcement, Japanese bond yields shot higher. Accordingly, the BOJ bought many bonds to defend its yield cap. The BOJ owns over 50% of Japanese bonds, and its share is rapidly growing. Thus far, they bought 3% of all outstanding bonds in January. According to George Saravelos of Deutsche Bank, “there are some reports suggesting the BoJ may own more than 100% of some benchmark 10yr bonds.” What happens if they run out of bonds?
It is important to remember that quite a few bonds issued by Japan are held to maturity by pension funds, insurance companies, and individual accounts. As such, the BOJ has a more significant share of bonds than the statistics indicate.
Given the lack of a real market, Japanese bond yields are becoming meaningless for investors. Instead, the market is increasingly looking to the derivates market (swaps) for indications of Japanese bond yields. Interest rate swaps allow companies and investors to swap interest rate payments. For instance, a company can issue a three-month note every quarter and swap the payments into a fixed ten-year rate. Such allows them to effectively borrow at a fixed rate for ten years yet take advantage of the demand for short-term debt issuance. These swaps provide global investors with a better indication of Japanese yields. The 10-year swap rate is .90% or .40% above the BOJ’s cap.
The first graph below shows the BOJ maintains an extremely easy monetary policy while the Fed and ECB are aggressively raising rates. Such helps partially explain the yen’s weakness over the last year. The second graph highlights the BOJ has had to intervene in the bond markets more aggressively and with greater frequency since September.
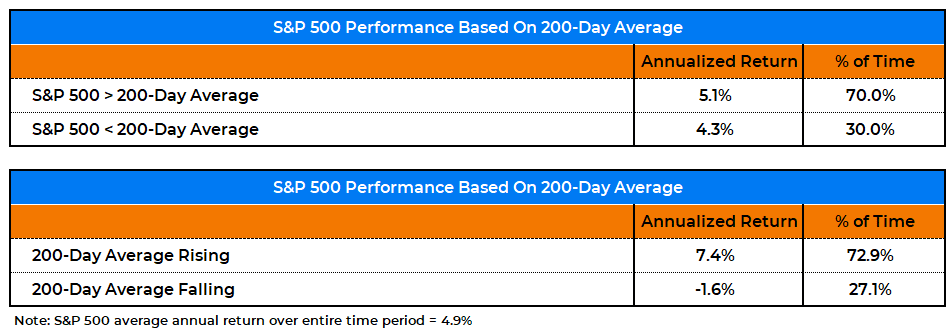
The Slope of the 200 DMA
The table below shows how the S&P 500 performs relative to its well-followed 200-day moving average (DMA). Many investors like to buy when the index is above the 200DMA and sell below. Based on the table, investors might also want to focus on the DMA’s slope. The graph below the table provides insight into the current situation. As we show, SPY is slightly above the 200DMA, but the moving average is still declining. The 20-day slope of the 200 DMA helps us assess whether the average is flattening and potentially turning higher in the coming days or weeks or picking up speed to the downside. It was flattening from November to early January, but it recently started heading lower again.


PPI and Retail Sales
Inflation slowed more than expected, and retail sales were down more than forecast.
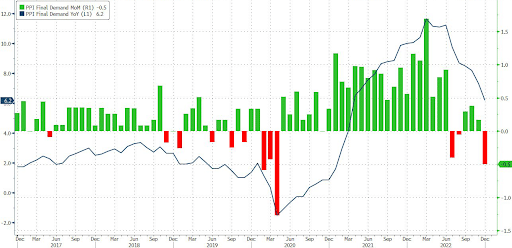
PPI fell to a 6.2% annual rate, well below expectations of 6.8%. The monthly rate was -0.5%, .4% below forecasts. PPI often leads CPI by a few months. Therefore this latest inflation data should bode well for the Fed. Over 50% of the items tracked in PPI are now in deflation. The graph below, courtesy ZeroHedge, shows the monthly decline was the largest since April 2020. It also clearly shows the trend lower over the last 12 months. One other thing to note, CPI is higher than PPI for the time since late 2020. While the difference is insignificant, it should help corporate profit margins if the trend continues.
While PPI was good news for the market, retail sales for December paint a concerning picture of personal consumption (60%+ of GDP). It also points to a weak holiday shopping season. Monthly retail sales fell by 1.1%, and the prior month was revised lower by 0.4% to -1.0%. Excluding vehicles and gas, a data point the Fed closely watches, retail sales were down 0.7% versus expectations for a slight .01% decline. The control group, a subset of retail sales data which feeds GDP data, was lower by 0.7%.
Retail sales were lower for a majority of the goods the report tracks.
- -6.6% Department stores
- -4.6% Gas stations
- -2.5% Furniture
- -1.2% Cars/car parts
- -1.1% Electronics/appliances
- -1.1% Online
- -0.9% Restaurants
- -0.9% Bars
- -0.9% Health/personal care
- -0.3% Clothes
- +0.1% Sporting/hobby
- +0.1% Grocery
- +0.3% Building materials
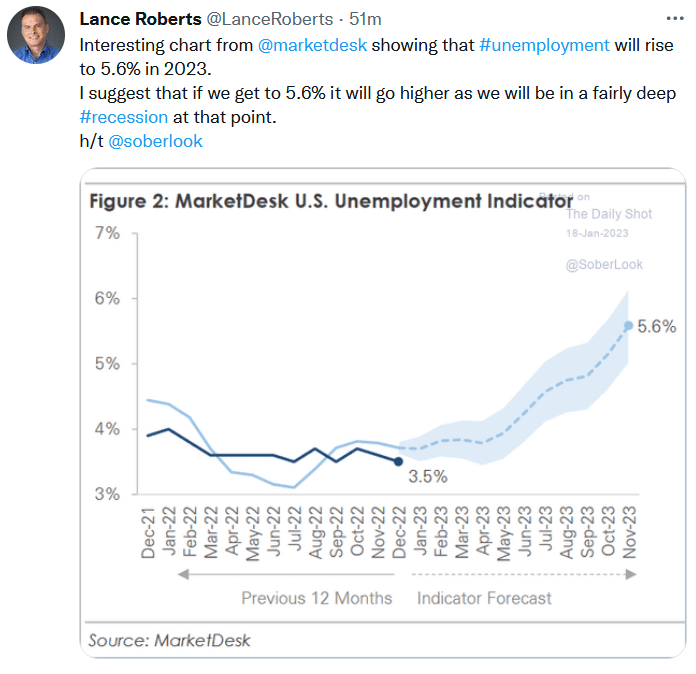
Tweet of the Day
Please subscribe to the daily commentary to receive these updates every morning before the opening bell.
If you found this blog useful, please send it to someone else, share it on social media, or contact us to set up a meeting.

