


At 2 pm ET, Fed Chairman Jerome Powell and his colleagues will alter monetary policy. High inflation rates and robust employment data leave the Fed little choice but to taper QE and raise the specter of interest rate hikes. It is becoming increasingly likely Chairman Jerome Powell may take a more hawkish tone than is expected. Markets seem prepared for QE to end in March versus June. At the last FOMC meeting, the Fed projected QE would end in June. But are investors ready for the Fed to discuss rate hikes as early as March and possibly four rate hikes in 2022?
Of course, the market rout over the past couple of days suggests investors may be trying to get ahead of both the Fed’s announcement and options expiration on Friday.

What To Watch Today
Economy
- 7:00 a.m. ET: MBA Mortgage Applications, week ended Dec. 10 (2.0% during prior week)
- 8:30 a.m. ET: Retail sales, month-over-month, December (0.8%. Expected, 1.7% in October).
- 8:30 a.m. ET: Retail sales excluding autos and gas, month-over-month, November (0.9% expected, 1.4% in October)
- 8:30 a.m. ET: Import price index, month-over-month, November (0.6% expected, 1.2% in October)
- 8:30 a.m. ET: Business Inventories, October (1.1% expected, 0.7% in September)
- 8:30 a.m. ET: NAHB Housing Market Index, December (84 expected, 83 in November)
- 2:00 p.m. ET: FOMC Rate Decision
Earnings
- 4:30 p.m. ET: Lennar (LEN) to report adjusted earnings of $4.16 on revenue of $8.51 billion
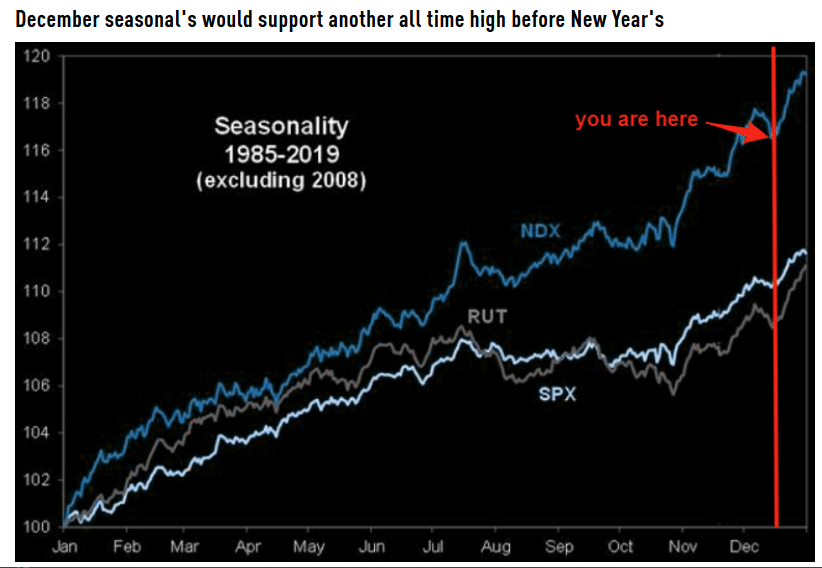
The Santa Rally Should Start Now
The graph below, courtesy of the Market Ear, shows that markets are entering the sweet spot for an end-of-year rally. Since 1985, on average, all three major indexes have ended the year with nice rallies. This year, however, Santa may come a little later. Today’s FOMC meeting and Friday’s option expiration may cause investors jitters, delaying or possibly postponing Santa’s arrival. Will Chairman Jerome Powell be the Grinch that steals the Christmas Rally?
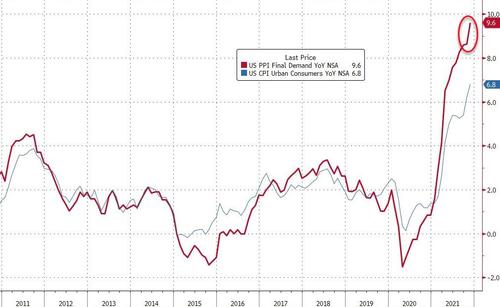
PPI Leading CPI
Yesterday morning’s PPI report showed further inflationary pressures lie ahead. PPI rose 9.6%, above expectations for 9.2%, and a full percent above last month’s reading. As the Bloomberg graph below shows, PPI is growing faster than CPI. If corporations want to keep profit margins at current levels, they will need to boost prices to consumers. As prices are raised will consumers demand higher wages? This is the slippery slope the economy potentially faces. In economic terms, it’s called a wage-price spiral.
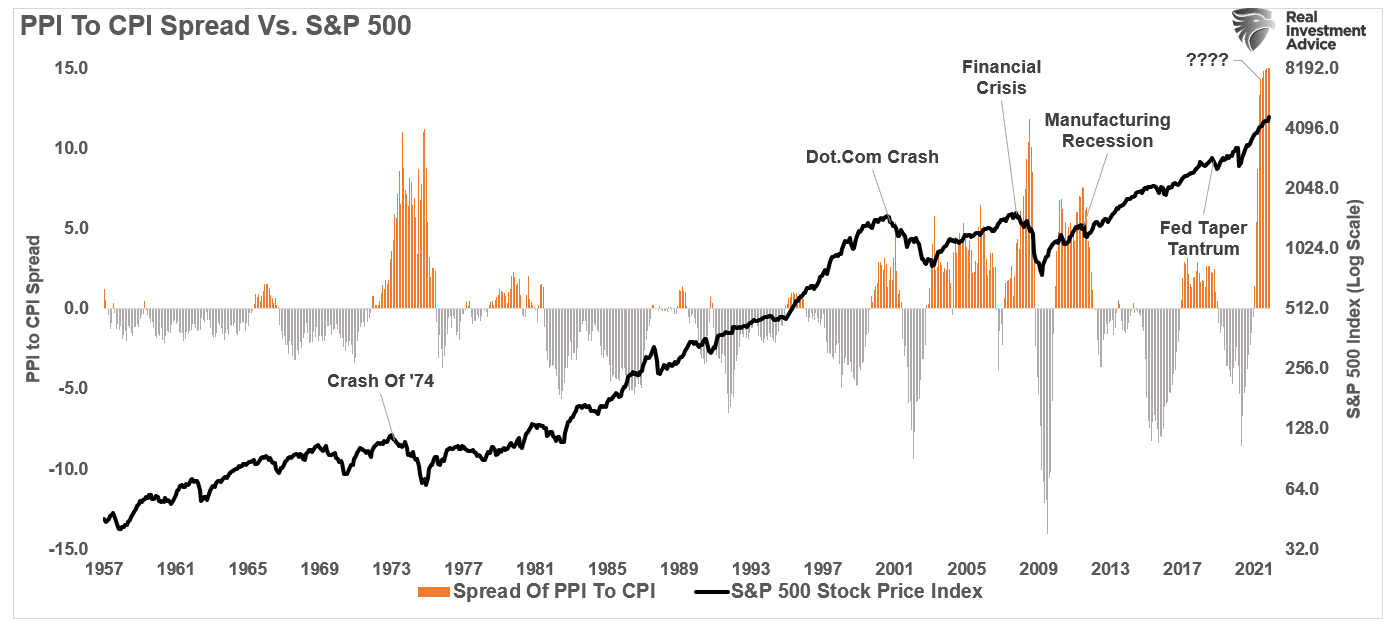
“Currently, with PPI at the highest spread to CPI in history, it suggests producers can’t pass on costs to customers. Such equates to weaker profit margins and earnings in the future. However, if they elect to pass those costs onto consumers, such will raise living costs well above wages.”
Breadth Remains Miserable On The Nasdaq
We have discussed the weak breadth of this rally several times previously, however, this chart from @themarketear shows the negative divergence in the Nasdaq quite clearly.
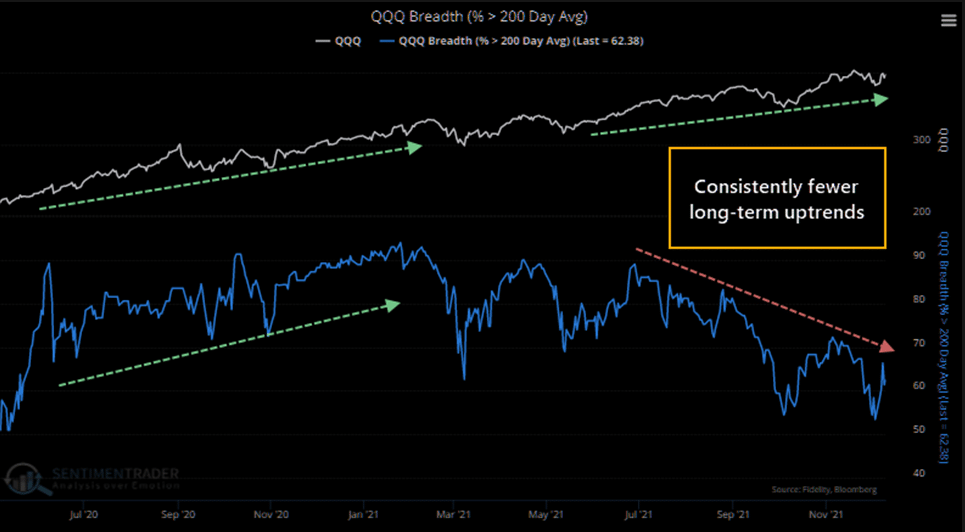
Of course, this is a function of the money hiding in the mega-cap names this year, a point discussed yesterday in “Wipe Out.” Importantly, you can see the divergence between FAMG and Goldman Sachs’s basket of non-profitable technology stocks.
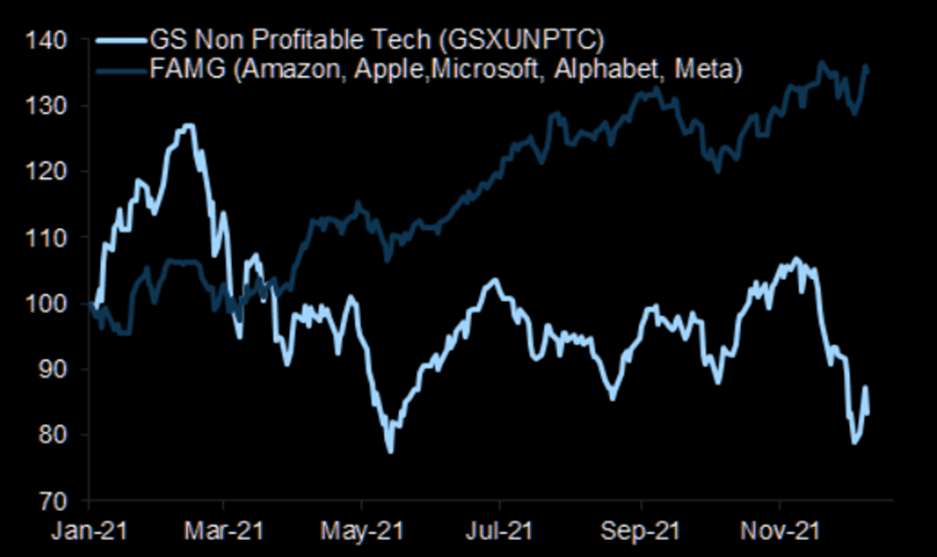
While the market may currently be near all-time highs, below the surface there is a bear market in progress.
More Warnings From Ex Fed Officials
Ex-Minneapolis Fed President Narayana Kocherlakota joins Ex-New York Fed President Bill Dudley in imploring the Fed to act aggressively against inflation. Per his Bloomberg Editorial: “If officials don’t announce a much more aggressive path of interest-rate increases than I expect they will, their passivity will risk a repeat of the Great Inflation of the 1970s.” He likens the situation to the mid-1960s, when massive fiscal spending, due to Vietnam, pushed prices up rapidly. While the spending was temporary, “it fostered an inflationary psychology in which prices and wages began to rise in anticipation of future price and wage increases.”
We are not sure if Jerome Powell is listening to his ex-colleagues, but if he takes their words seriously, today’s Fed meeting might have a much more hawkish tone than many expect.

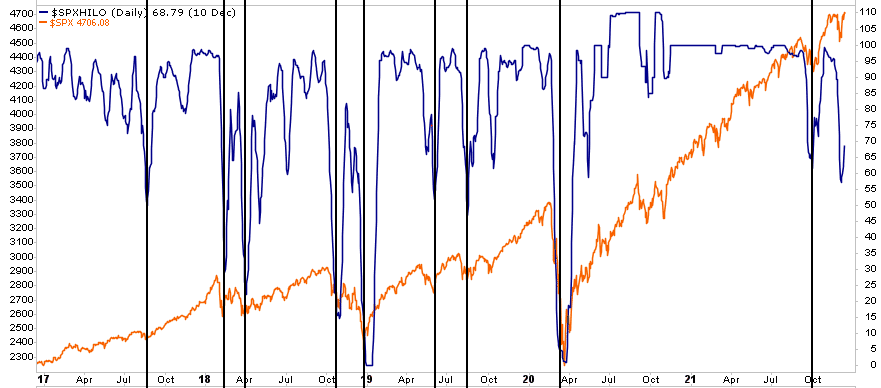
Is This Time Different for the S&P 500?
The graph below shows the StockCharts HiLo Index and the S&P 500. The index is the number of 52-week highs divided by the total number of 52-week highs and lows. Essentially it gauges what percentage of all new 52-week highs and lows are new highs. The index should peak at 100 during bullish phases at new highs. Conversely, as breadth weakens, the index should fall. The index is currently at 69, yet the S&P is just off record highs. As we highlight with the vertical lines, this instance of a weakening HiLo Index does not gibe with prior incidents. Either this time is different, or the divergence will soon close. Note: StockCharts has a flaw in their model as the index peaks above 100 in the summer of 2020.
Please subscribe to the daily commentary to receive these updates every morning before the opening bell.
Also Read


