


“Peter Cook is the author of the ‘Is That True?’ series of articles, which help explain the many statements and theories circulating in the mainstream financial media often presented as “truths.” The motives and psychology of market participants, which drives the difference between truth and partial-truth, are explored.”
In “The Fed’s Real Target” it was explained that the Fed’s interest rate manipulations are intended to influence the behavior of borrowers, not investors. Fed Chairman Powell agrees. In his most recent press conference, Powell reiterated that the Fed Funds rate continues to be the Fed’s primary tool to influence the U.S. economy. Based on the Fed’s analytical framework, the economy is slowed by a series of interest rates increases because the behavior of borrowers is constrained. Using similar logic, the economy is stimulated by a series of interest rates declines because borrowers use the reduction in interest expense for other purposes that promote economic growth.
But the Fed also bought a non-trivial amount ($3.6 trillion) of government obligations during the Quantitative Easing (QE) experiment, in the belief that QE would also boost the U.S. economy. Unlike interest rate manipulations, QE is direct manipulation of bond prices and yields and is clearly directed at investors, not borrowers. This key difference between who QE and QT targets are incredibly important and often not fully appreciated by investors.
Since November 2017, the Fed has embarked on Quantitative Tightening (QT), a policy that forces investors to refinance trillions of U.S. government obligations that are maturing from the Fed’s portfolio.
Can the movement of asset prices during the QE period give clues about how asset prices might move during QT? In this article, we show that the Fed’s QE policy produced the counterintuitive result of higher yields on Treasury bonds, not lower yields as implied by supply/demand analysis. Using symmetrical logic, the Fed’s QT policy should be expected to reverse the effects of QE, and to produce the counterintuitive result of lower yields, not higher yields implied by supply/demand analysis.
QE was launched in 2008 and ended in late 2014 after three rounds of purchases plus Operation Twist which extended the duration of their holdings Digging through the archives, the following chart shows that the S&P 500 index (SPX) rose 176% during the periods in which QE was operative (colored lines) while SPX declined 32% during non-QE periods (gray). Since mid-2015, when the chart was created, SPX has risen from 2100 to 2785, a gain of 31% that offset almost all the 32% loss. Clearly, QE produced an upward bias to stock prices. While the topic for another article, it is worth pointing out that many other central banks continued buying assets after QE ended via their QE programs and this activity played a role directly and indirectly in supporting SPX.

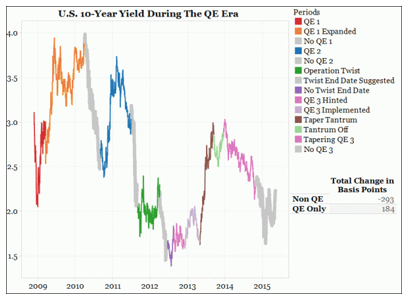
Moving to the market for U.S. Treasury bonds, QE produced quite a different result than many had expected. The 10-year Treasury yield rose by 184bp during periods of QE and fell by 293bp during non-QE periods. Despite massive bond purchases by the Fed, sales by other investors overwhelmed the Fed’s actions. Since mid-2015, when the chart below was created, 10-year Treasury yields have risen from 2.25% to 2.85%, offsetting some of the decline in yields that occurred during non-QE periods since 2008.
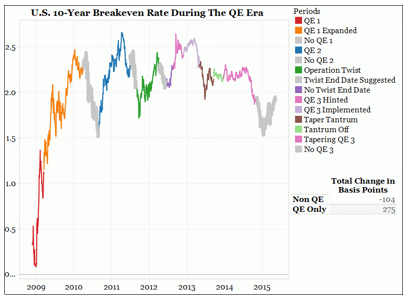
Why might yields have risen during periods of QE, when the Fed was buying trillions of dollars of bonds? The chart below shows that inflation expectations rose by a total of 274bp during periods of QE and fell by 104bp during non-QE periods. Markets apparently believed that QE would produce a systematic increase in inflation.
Summarizing the results of stock and bond markets post-2008, during QE periods, the Fed bought $3.6 trillion of government obligations, but bond yields rose. During non-QE periods, bond yields fell. Almost nobody expected that a multi-trillion program of buying government bonds would result in declining prices (rising yields) for government bonds. Yet that’s what happened. Based on the movement in breakeven yields, investors believed QE would result in systematically higher inflation. During QE periods SPX rose, and during non-QE periods SPX was basically unchanged.
Viewed from the perspective of a portfolio, QE clearly changed the risk tolerance of investors, who sold U.S. Treasury bonds to the Fed and used the proceeds to buy U.S. stocks and a variety of other risky assets that appreciated sharply (real estate, junk bonds, emerging market stocks and bonds, collectibles, etc). To use technical language, the risk premium fell for risky assets relative to U.S. Treasury bonds.
Transition from QE to QT
Since November 2017, the Fed has been pursuing a policy of QT, allowing a portion of its portfolio of bonds to mature without reinvesting. If QT is the opposite of QE (essentially, bond-selling instead of bond-buying), it is logical that asset prices will adjust in the opposite direction than what occurred during QE. That is, bond yields should fall even though the Fed’s actions require investors to now buy $50 billion more of government obligations each month. Stock markets should fall because investors will sell risky assets to meet the increased supply of Treasury bonds. But what is the actual pattern of prices in the QT era?
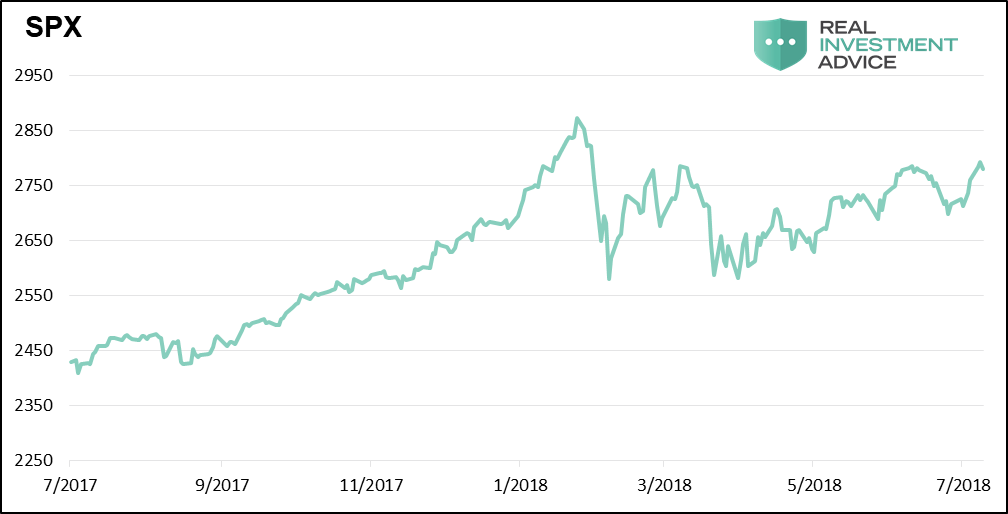
SPX has risen by approximately 5% since November, but more than 100% of that gain occurred in December and January, possibly in anticipation of corporate tax cuts. Since January, the trend has been downward and much more volatile. QT began slowly, at $10 billion per month, but starting in July 2018 it has been ramped up to $50 billion per month in maturing bonds. QT may already be taking a toll on the stock market.
How about the bond market? The combination of higher deficits, higher short-term interest rates, and the Fed’s QT program means that investors will need to buy more than $1 trillion in newly-issued Treasury notes in each of the next few years. A simple supply/demand analysis would suggest that bond yields should rise during a period of QT, just as a simple supply/demand analysis would suggest that bond yields should have declined during QE.
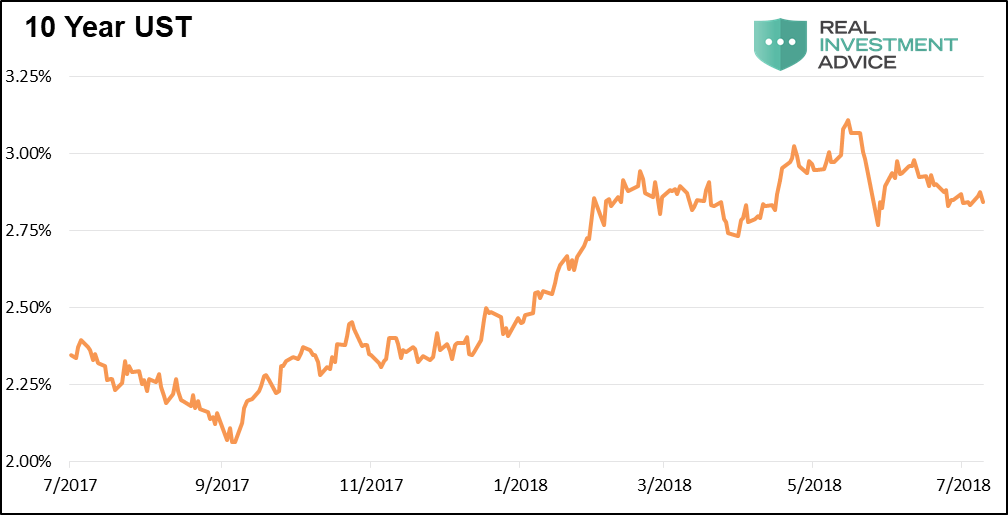
As shown below, bond yields have indeed risen since the beginning of QT, from 2.40% to 2.85%. But just as with the stock market, most of the move occurred in December and January, as markets began to anticipate the stimulative effect of corporate tax cuts. Since January, bond yields have gone sideways, defying the predictions of those who believed long-term interest rates would inevitably rise because of the Fed’s rate hikes and increased deficit spending, each of which increases the supply of U.S. Treasury bonds.
Are the bond markets expecting a return of inflation? The chart of inflation expectations below is remarkable because inflation expectations have remained in a narrow range of 1.5-2.5% for most of the past 15 years. As a result, relatively small changes can appear to be larger than they really are. During the entire QE era, inflation expectations were also anchored in the 1.5-2.5% range, although as explained previously, inflation expectations rose during QE periods and fell during non-QE periods. Since QE ended in late 2014, inflation expectations fell from 1.8% to 1.2% as the price of crude oil crashed from $110 to $26 per barrel. Inflation expectations then rose to the current 2.1% level. That said, QT seems to have put a lid on rising inflation expectations, which have been stuck at 2.1% for the past six months.

Many, including the Fed, fear that inflation will spike higher. But the ever-flattening yield curve, which is an excellent leading indicator of recessions, suggests that bond markets are beginning to believe that the next move in inflation is down, not up. The flat yield curve also supports our analysis in “Does Surging Oil Costs Cause a Recession?” which shows that a combination of rising short-term interest rates and a doubling of crude oil prices preceded each recession since 1970, with no false signals. Those conditions exist in 2018.
Finally, the prices of industrial metals such as copper are nosediving. Many will attribute the recent weakness in metals to the threats of a trade war. But it is also possible that the Fed’s combo-platter of QT (aimed at investors) and rising U.S. interest rates (aimed at borrowers) is a primary culprit. Regardless whether the trade war or Fed actions are responsible, it is clear that commodities investors don’t like what’s on the menu.
Conclusions
The purpose of this article is to estimate the future direction of asset prices based on the logic that QT will have the opposite effect on asset prices then occurred during QE.
Here’s what we know happened during QE:
- QE changed the behavior and preferences of investors, which greatly affected relative prices
- QE produced an expected result of higher stock prices
- QE produced an increase in inflation expectations, which produced the unexpected result of higher Treasury bond yields
If markets respond to QT symmetrically to how they responded during QE, then:
- QT will change the behavior and preferences of investors and change relative prices
- QT will produce lower stock prices
- QT will reduce expectations for inflation, resulting in lower Treasury bond yields
So far, the QT era has not produced lower stock prices and bond yields. That said, it is too early to make a definitive statement on QT’s ultimate impact. The full force of QT ($50 billion per month) has just begun, and there are signs that stocks and bonds are beginning to change direction. Since November when QT began, SPX has risen. But since the January peak that occurred in the wake of tax cuts, the trend of SPX is downward and more volatile. Since November, bond yields have also risen. But as with SPX, since January a change has occurred; bond yields have stopped rising.
It is possible that the trends in effect since January will persist and possibly intensify throughout the QT era, which would be a surprise to the consensus view that interest rates will inevitably rise due to an increasing supply of Treasury bonds. Other important data points also suggest that Treasury bond yields may continue to fall; inflation expectations have been static since QT was launched in late 2017, the yield curve continues to flatten to levels not seen since 2007, and industrial commodities are in freefall.
Also Read


