


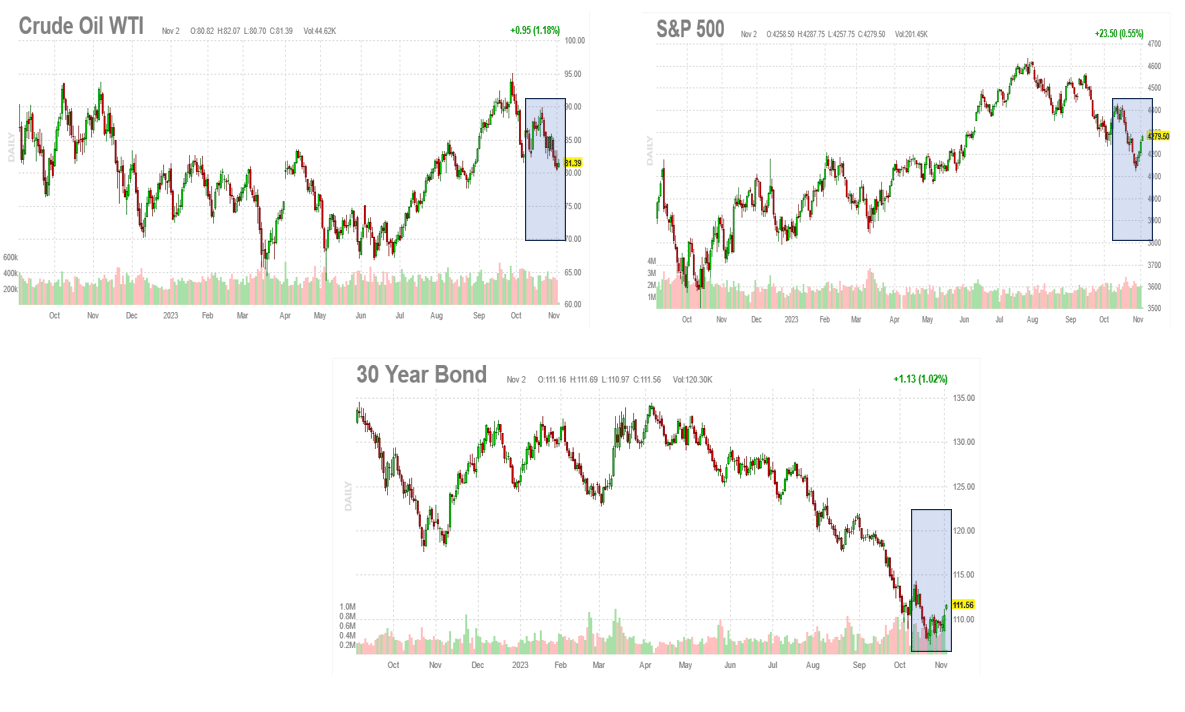
Almost a month ago, on October 7th, Hamas attacked Israel, and concerns of a much larger war in the Middle East spiked. War worries weighed on stock prices and irked the bond markets. With a few weeks to better assess the war situation and the many possibilities, the markets seem less worried. To wit, the graph on the top left shows crude oil prices are now below where they were on the eve of the attack. Bond yields fell sharply in the days following the attack, as is typical in what is referred to as a flight to quality trade. However, the prospect of higher oil prices and more war-related deficit spending sent yields to their highest levels since 2007. Like oil, bond yields are back to where they were when the war kicked off. Stocks followed the path of bonds and, similarly, have since rallied back to pre-invasion levels.
The markets appear more comfortable with the war and are discounting its adverse economic effects. However, might the markets be starting to show concerns for an economic slowdown? As we noted yesterday, the Fed has shifted its stance. They remain very concerned that above-average economic activity keeps prices inflated. But, they seem a little more two-sided, implying concern for weaker economic activity. The Atlanta Fed’s GDPNow estimate for Q4 GDP just fell from 2.3% to 1.2%. The culprit was Wednesday’s weak ISM survey and the second consecutive ADP report showing weak job growth. The Fed Funds futures markets have backed down the odds of another rate hike this year to 14%. At one point, it was near 50%. The odds of the Fed hiking and cutting rates in March 2024 are now equal.
What To Watch Today
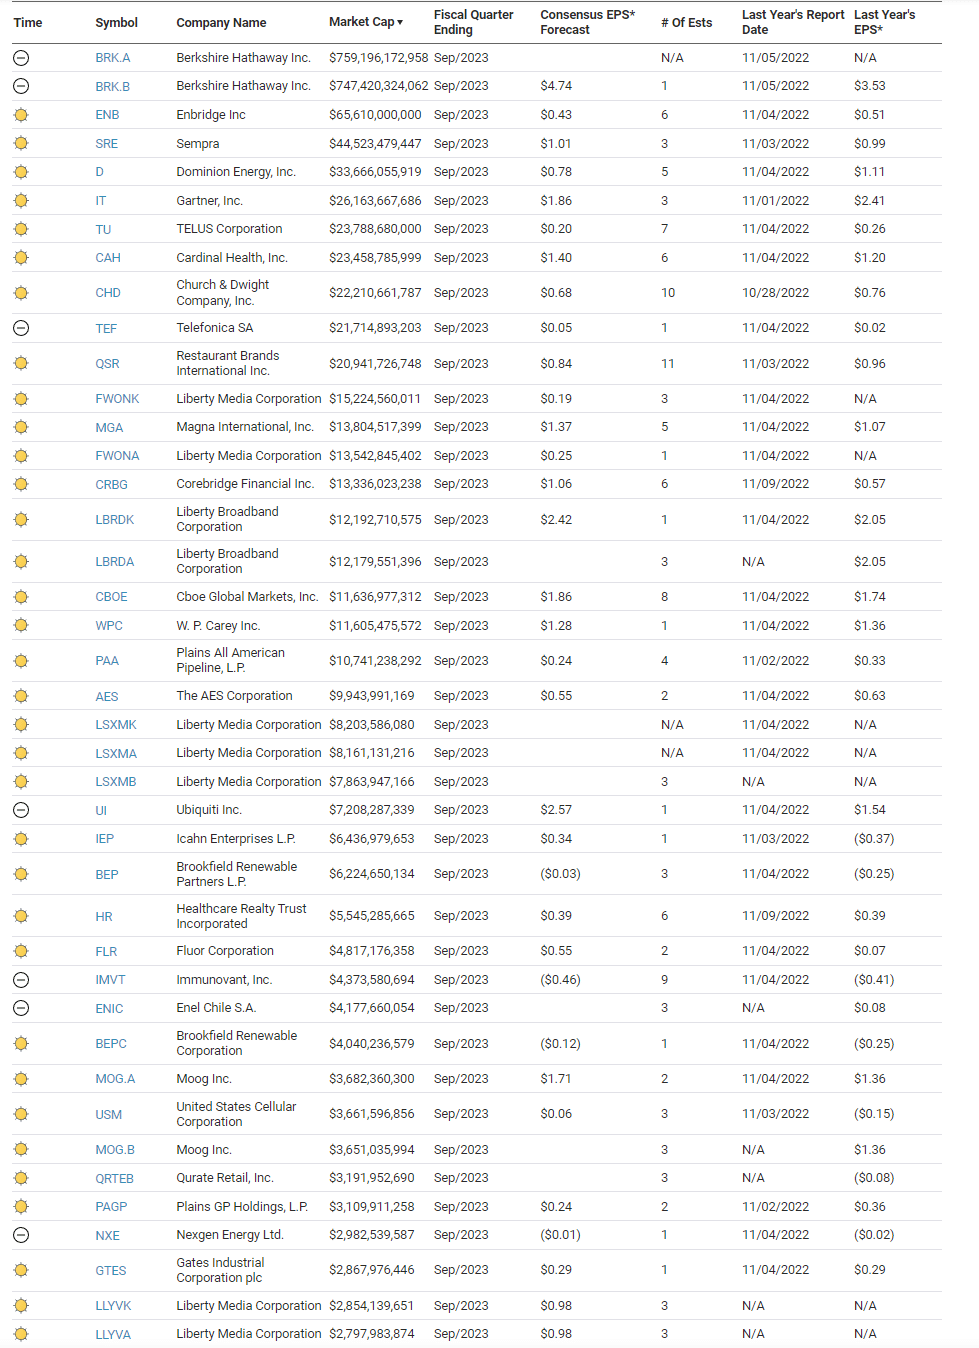
Earnings
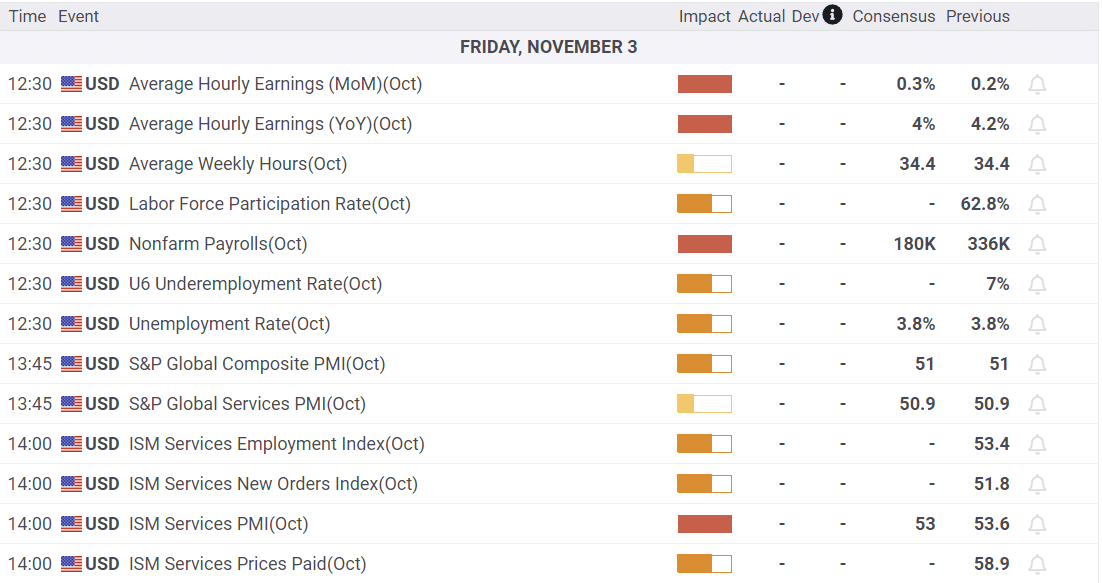
Economy
Market Trading Update
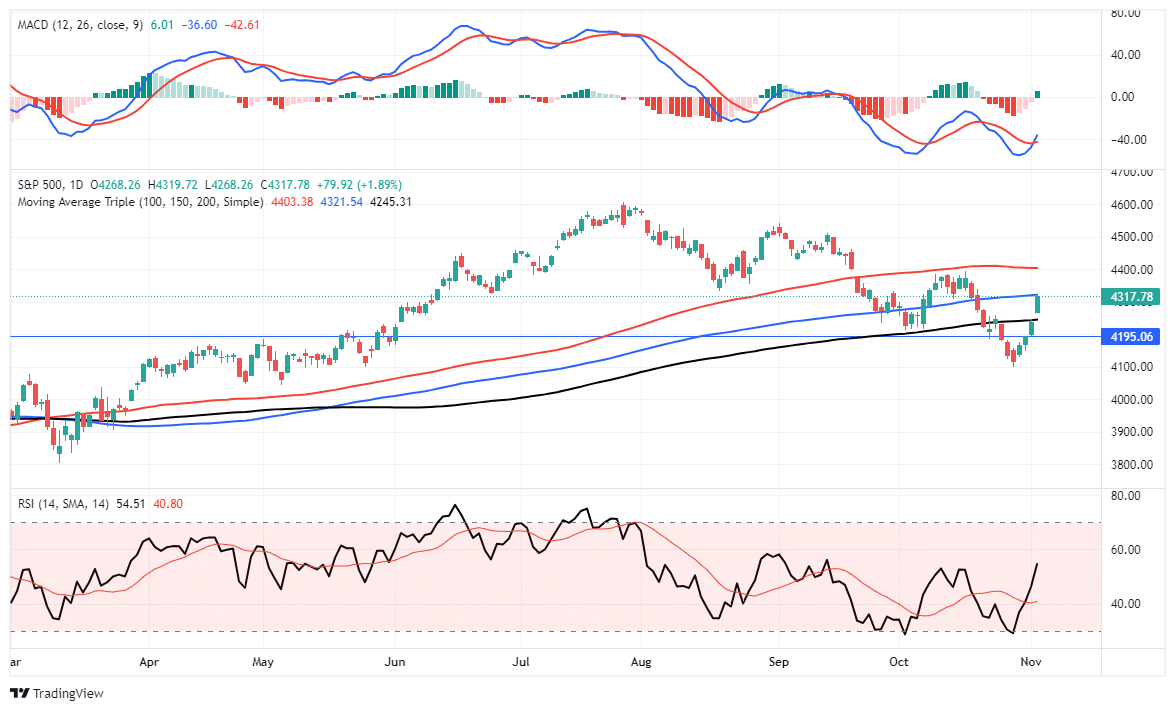
The market has come a long way over the past 4-days and recovered the 200-DMA. With a LOT of economic data today, a bit of a reversal today should be unsurprising. The key is that IF the market does encounter some profit-taking, it needs to hold the 200-DMA to turn it back into support.
Notably, not only did the market clear the 200-DMA, but it also triggered a MACD “buy signal” from a low level, and the RSI is not back to overbought conditions. Such suggests that over the next month, the market will try and push higher. With immediate resistance at the 100-DMA, again, we could see a bit of profit-taking. However, a break above the 100-DMA sets the 50-DMA as the next logical target. Continue to trade the rally accordingly. Just don’t forget to take some profits and rebalance risks along the way.

Economic Strength Before A Recession?
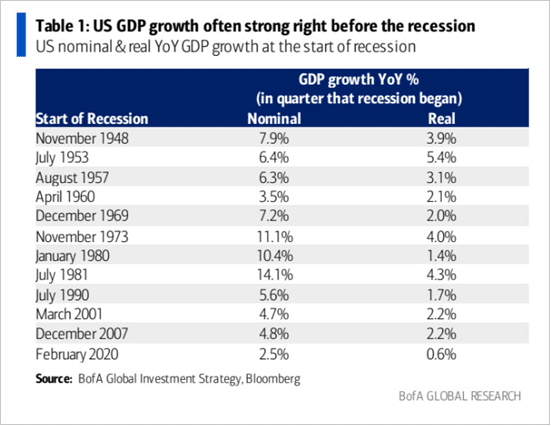
GDP for the third quarter came in at a solid +4.9% growth rate. Such was more than 2% above the running growth rate of the prior quarters. While we would like to be optimistic, such strength is common on the eve of a recession. The table below from BofA Global Research shows that the quarter leading into each recession since 1948 showed solid growth. As we wrote, current quarter growth expectations are low, but there is little data at this time pointing to a recession or even a marked slowdown.
Architecture Billing Index Points To Slowing Construction Market
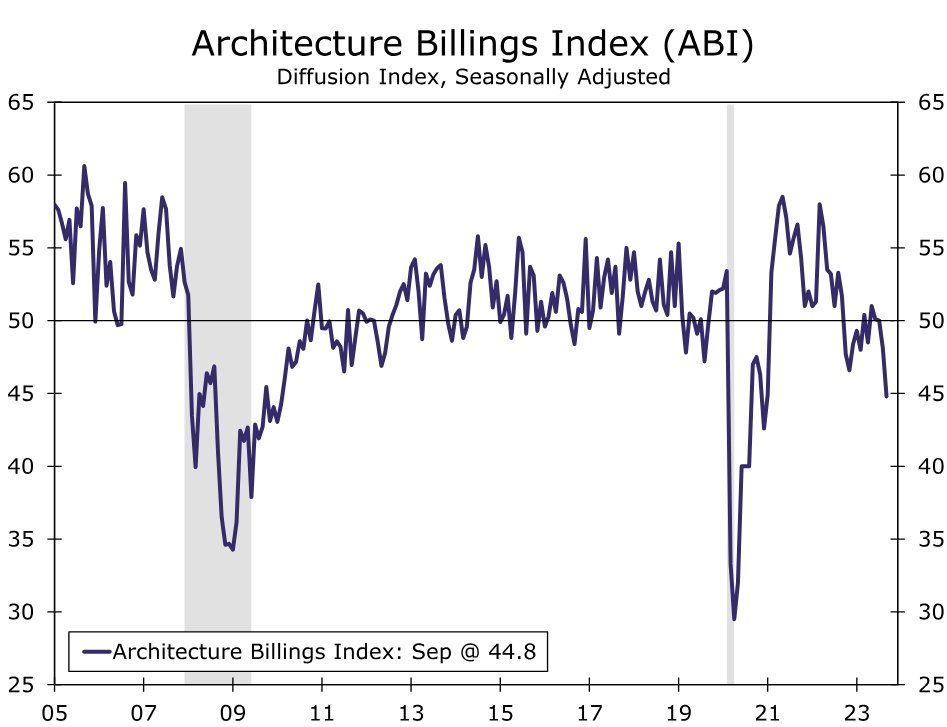
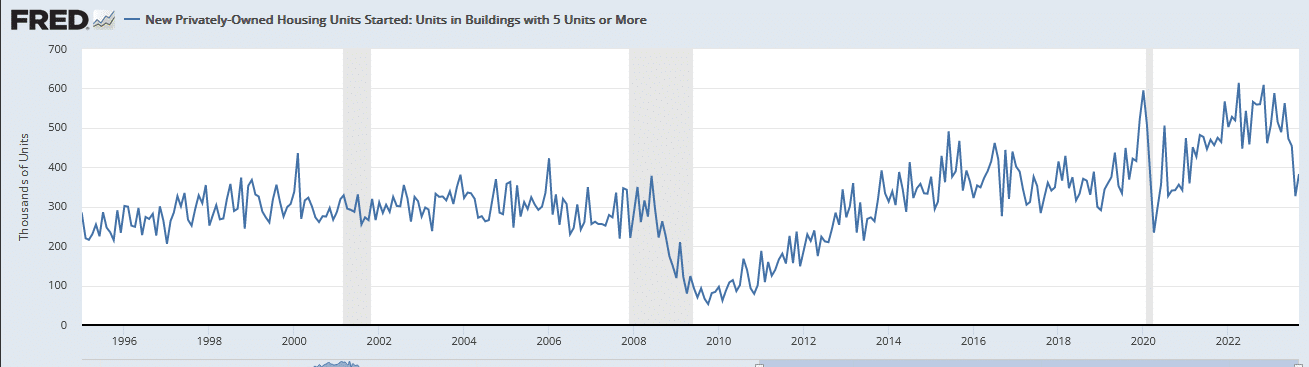
The first graph below shows the Architecture Billings Index. This index is one of the best leading indicators for the residential and commercial construction industry. The recent reading was sharply lower, possibly indicating that higher rates are finally making new construction projects unattractive. The other reason for the slowdown might be the glut of multifamily projects slated to hit the market in the coming year. The number of current multifamily construction projects underway is at record levels. However, the number of projects just being started has slipped considerably in the last few months. We share this data in the second graph.
In February, we shared the HOPE framework developed by Michael Kantrowitz, CIO of Piper Sandler. The HOPE cycle helps us appreciate the order in which economic sectors tend to weaken before a recession. This, in turn, provides us with good leading economic indicators to follow. The H in Hope stands for housing and, more broadly, the construction industry. Per our article Janet Yellen Should Focus On HOPE:
Michael’s HOPE model consists of Housing, New Orders (ISM), Corporate Profits, and Employment.
His framework acknowledges that the most interest rate-sensitive sectors are first to feel the brunt of tightening monetary policy. These sectors often serve as leading economic indicators. As interest rates dampen economic activity in interest rate-sensitive sectors, other sectors and facets of the economy begin to feel the impact of higher rates. HOPE illustrates the various lags or the time it takes for rate hikes to affect economic activity fully.
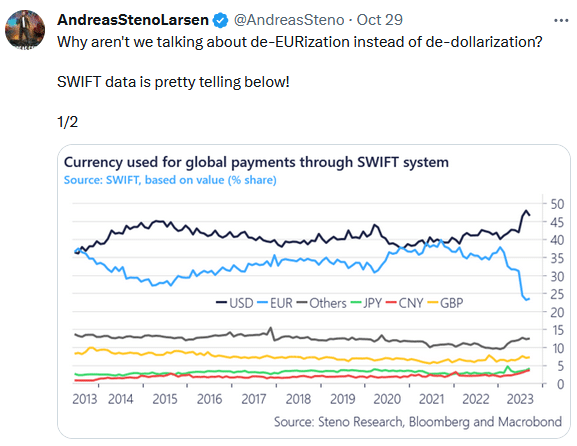
Tweet of the Day
Please subscribe to the daily commentary to receive these updates every morning before the opening bell.
If you found this blog useful, please send it to someone else, share it on social media, or contact us to set up a meeting.
Also Read


