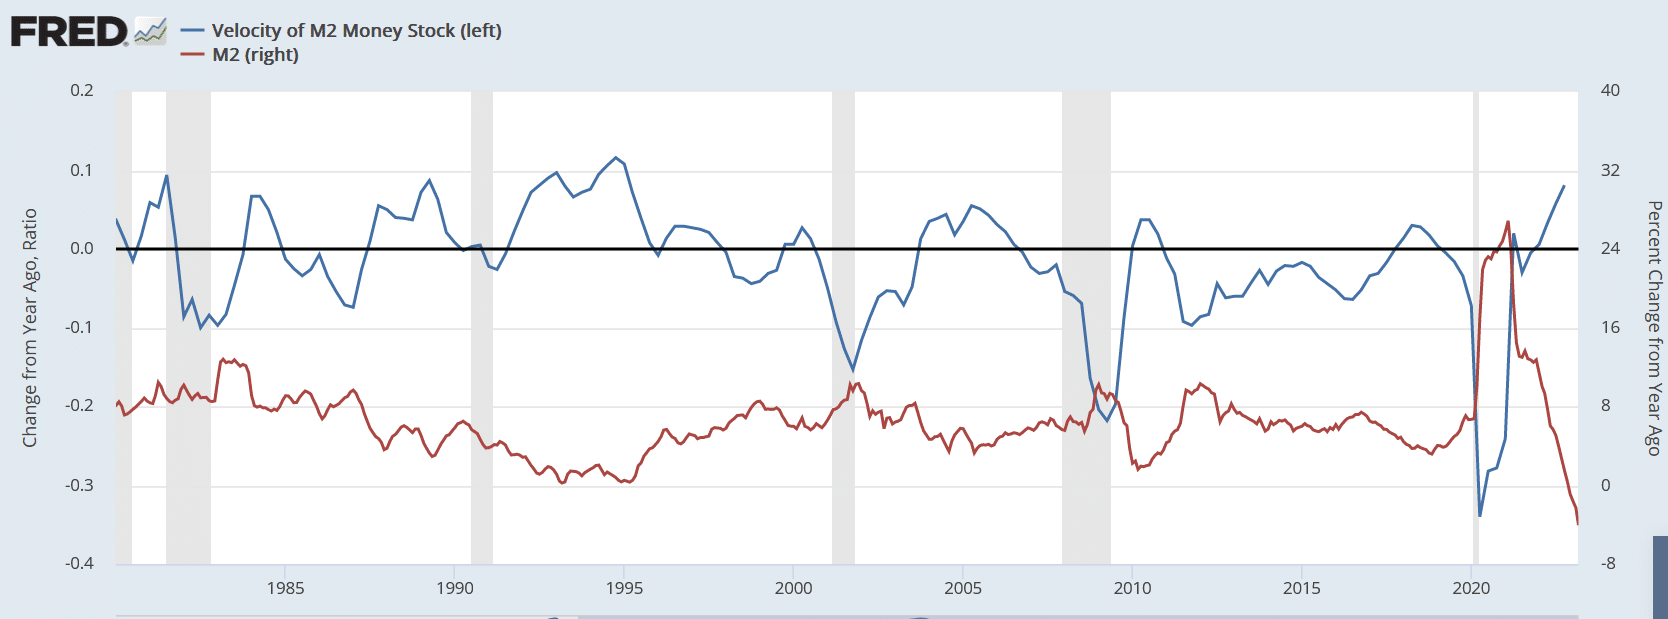
When most economic prognosticators forecast inflation, they often base it on money supply changes. At first blush, such makes a lot of sense. The more money that exists, the less its worth, ergo the more inflation. However, such logic fails to consider how often money circulates. Monetary velocity quantifies the rate at which money is spent. Per the St. Louis Fed: “In other words, it is the number of times one dollar is spent to buy goods and services per unit of time. If the velocity of money is increasing, then more transactions are occurring between individuals in an economy.“
The graph below charts the annual percentage change in money supply with the annual change in velocity. The two inflation determinants largely offset each other from 1980 until the pandemic, and as a result, inflation was largely tame. The massive liquidity fiscal and monetary pump in 2020 and 2021 caused the money supply to surge. At the same time, velocity fell sharply as large parts of the economy were shut down. However, if you look closely, velocity recovered while the money supply was still growing. The result was eye-popping inflation. Today, the money supply is shrinking, but velocity remains firm. The Fed’s inflation fight will not end until they get velocity to slow. That explains why they are intent on slowing the economy.
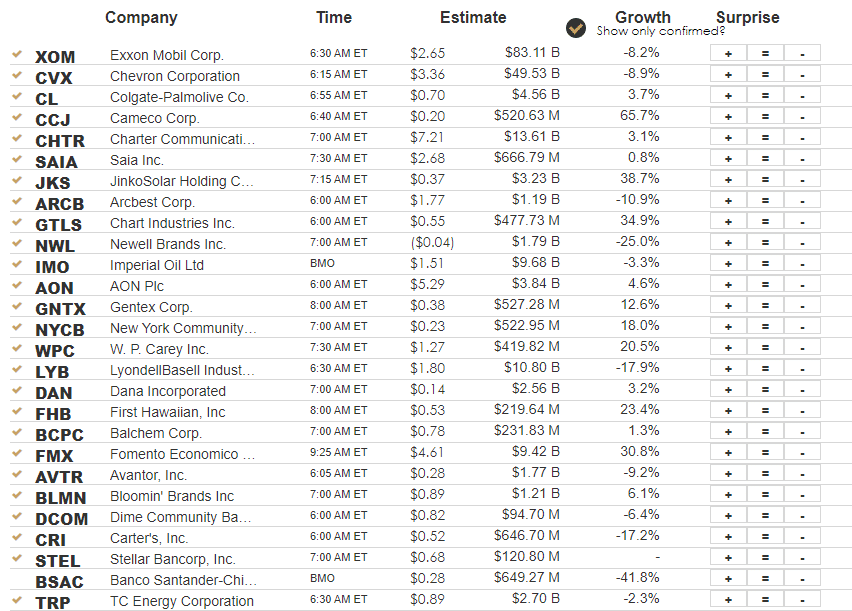
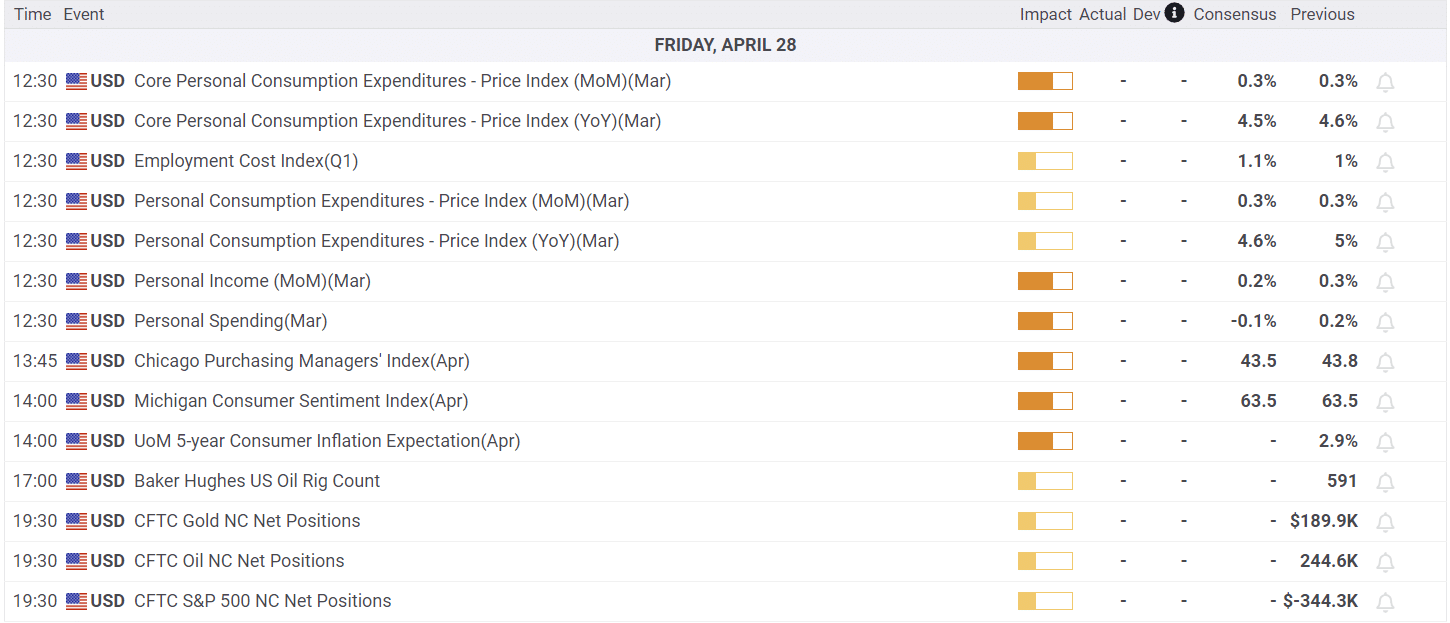
What To Watch Today
Earnings
Economy
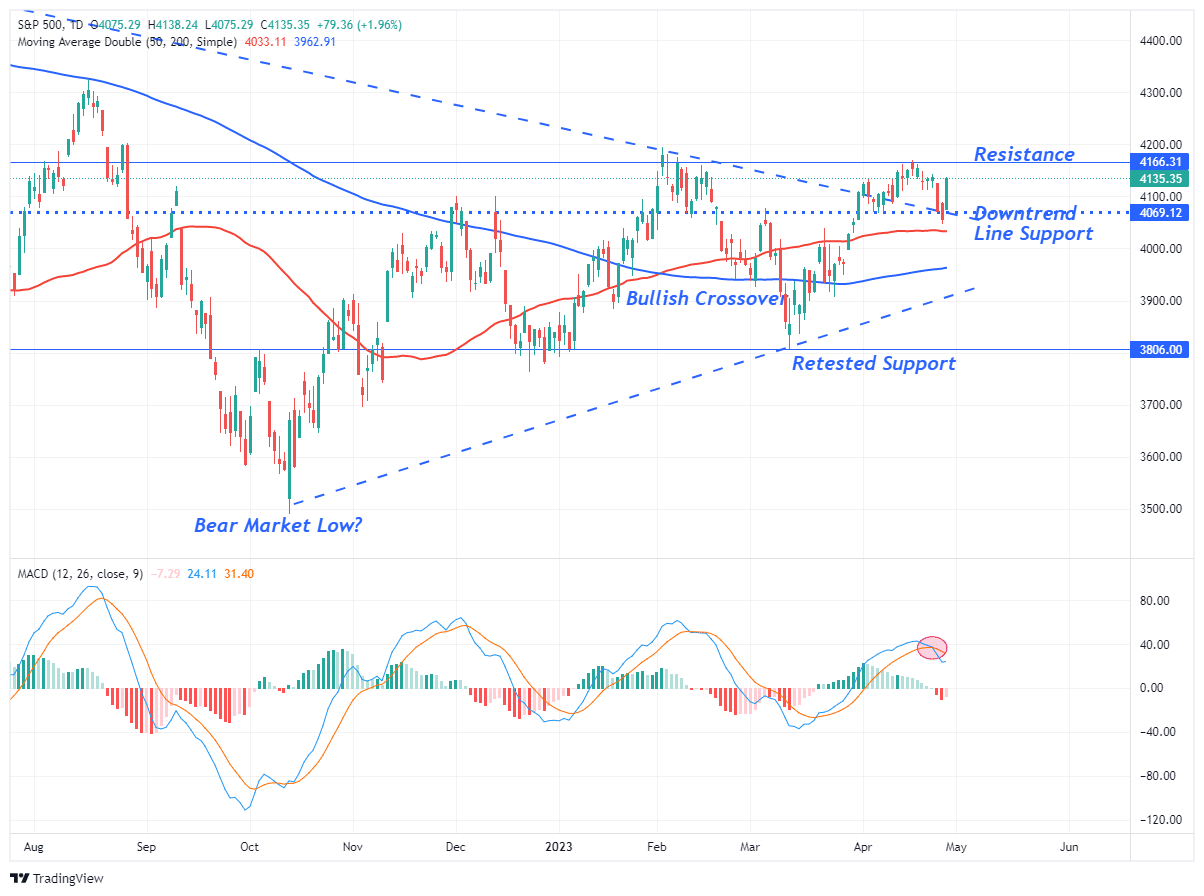
Market Trading Update
The big rally yesterday on continued earnings beats from the FANG stocks. After yesterday’s bell, Amazon (AMZN) crushed earnings with a huge beat in its cloud services. With the stock up over 8% after hours yesterday, that “not as terrible” as expected earnings are pushing buyers back into the market.
The market was selling off with our sell signal and is still confined to the recent consolidation range. However, yesterday’s rally reversed the market back to overbought conditions. The recent highs will provide initial resistance, but the good news is the downtrend line from April was defended successfully, reinforcing that support level from the recent breakout. The market remains bullishly biased, so we will continue using pullbacks to add exposure accordingly.

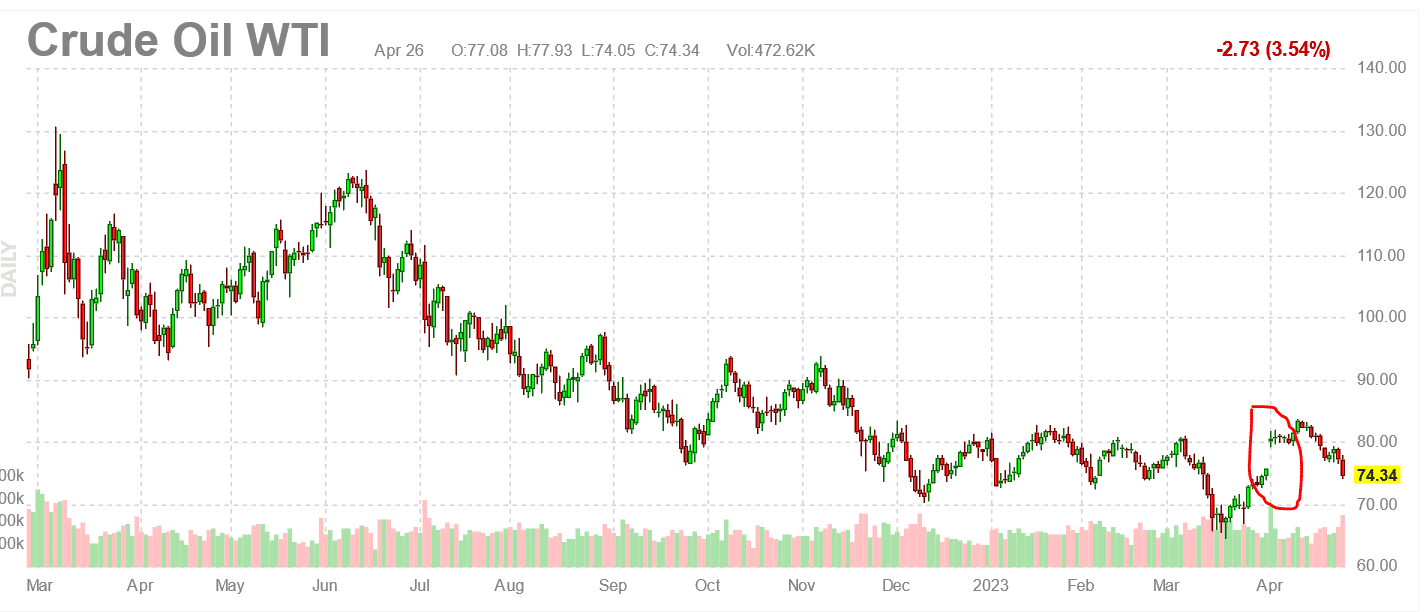
The OPEC Gap Closes
On April 4, 2023, our Daily Commentary noted the following:
On average, the price of oil drops for one, three, and six months after OPEC production cuts.
Once again, the price of crude oil fell following an OPEC supply reduction. The price of crude oil was $75 before OPEC cut production by 1.15 million barrels per day. After sitting above $80 for a couple of weeks, the price has been declining. The close below $74 closes the gap. While we think the production cut was likely a political response to President Biden not refilling the strategic reserves, we wonder if OPEC may have also cut production as they fear a recession.
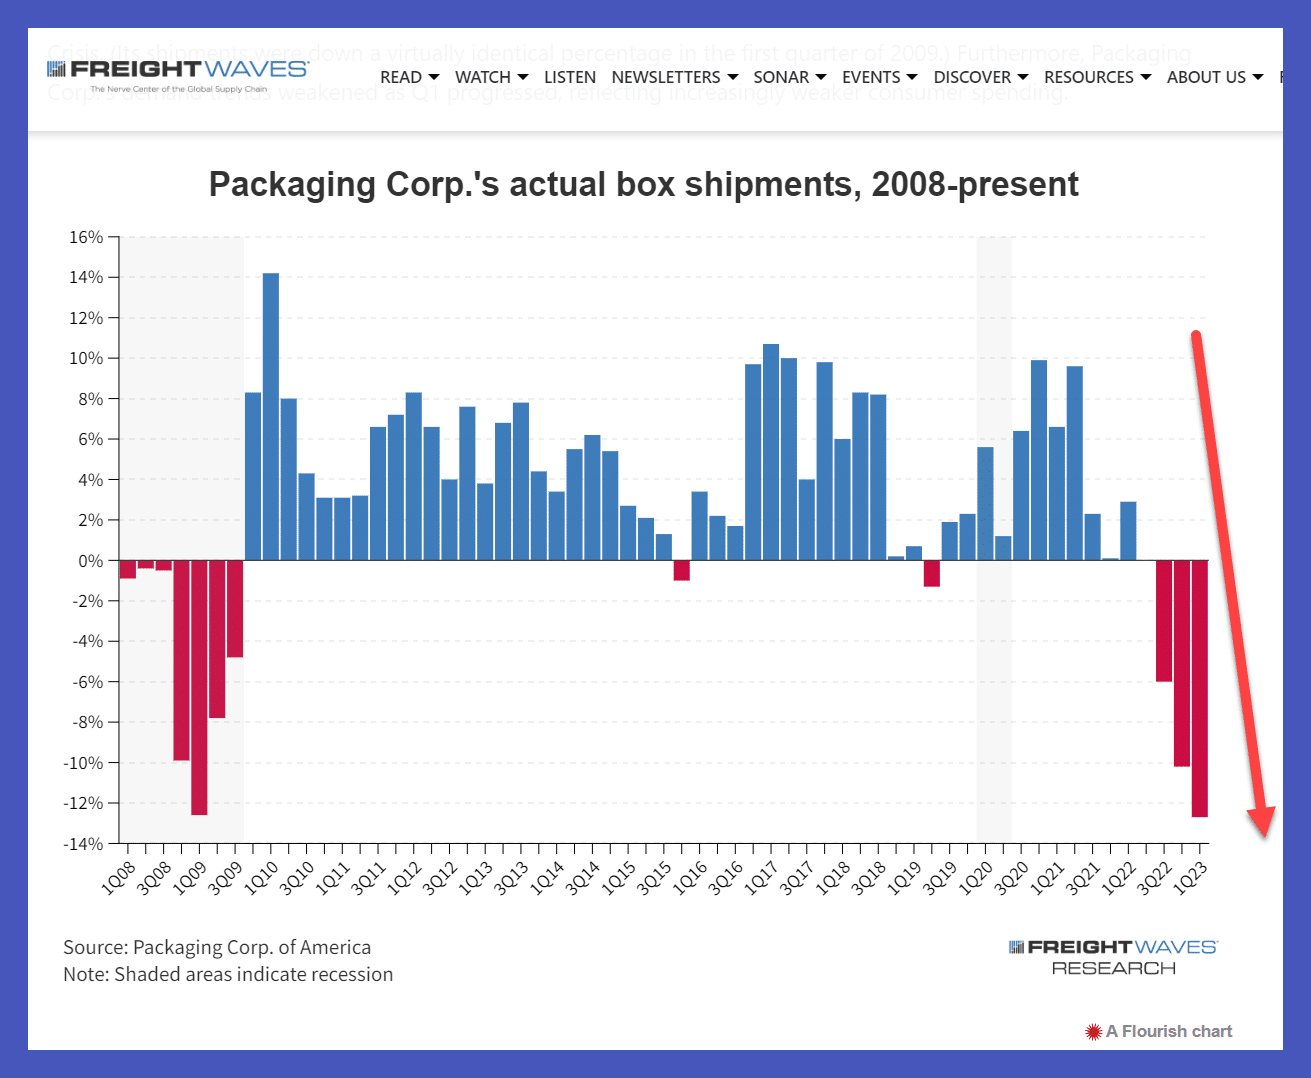
More on the Freight Recession
Yesterday we shared comments from JB Hunt’s President labeling the current state of shipping as a “freight recession.” UPS further confirmed trouble in the shipping industry with its earnings letdown. Shipping and freight are leading economic indicators. Therefore, signs of stress in the industry are worth following. Along the same lines, we came across the graph below from the Packaging Corporation of America, a leading producer of corrugated boxes. Given most freight is shipped in boxes, the chart is another sign that the freight industry is having problems.
The Cost of Monetary Policy Tomfoolery
We share the following quote from Ronnie Stoeferle:
“Thirteen years is an awfully long time for the Fed to have suspended free market interest rates in the world’s largest economy. Not to mention pinning rates at absolute zero for nine of those 13 years. Billions of economic decisions were made by millions of market participants with the faulty information of suppressed interest rates (and a debased currency) under the illusion of efficient capital allocation. What percentage of these economic decisions will stand up as rates normalize? How many were rational?”
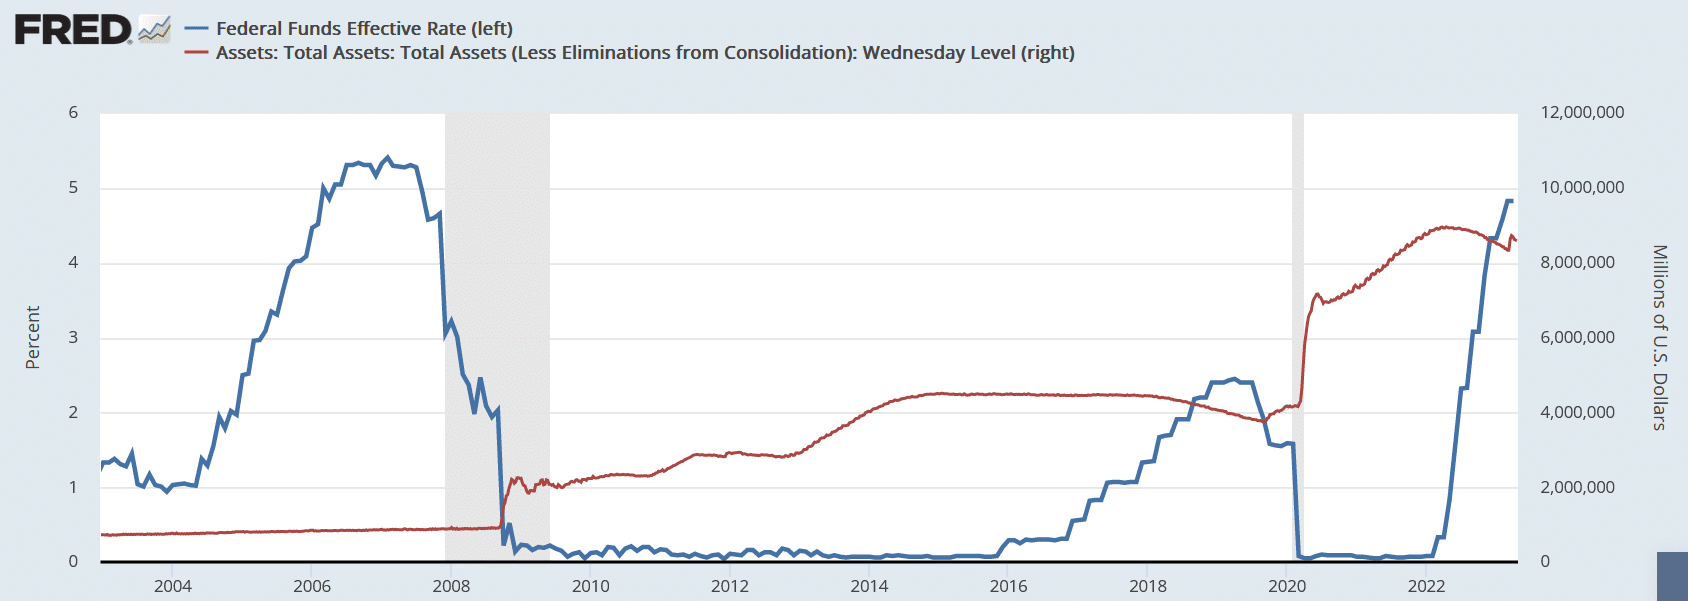
The quote does a great job of explaining the pickle the Fed is in. Their actions from 2008 to 2021 resulted in a massive misallocation of capital toward unproductive ventures. Over the next few years, the Fed will have to get rates back down or risk widespread bankruptcy among firms that were able to borrow at rates that were not appropriate.
The graph below shows Fed Funds spent most of the last fifteen years pinned near zero. At the same time, the Fed grew its balance sheet, via QE, by 10x.
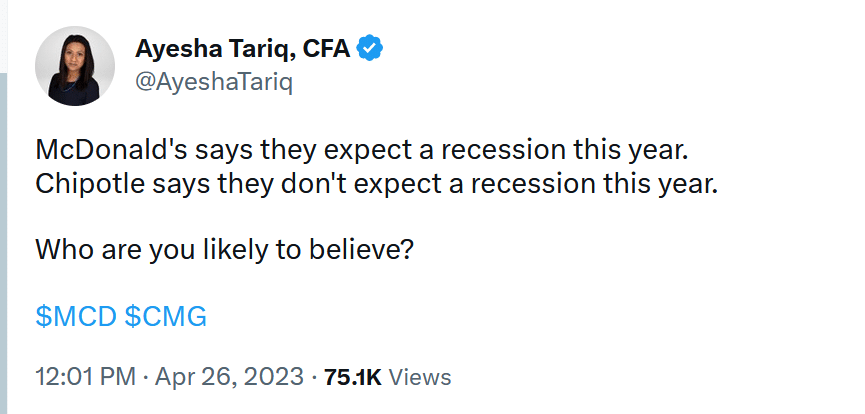
Tweet of the Day
Please subscribe to the daily commentary to receive these updates every morning before the opening bell.
If you found this blog useful, please send it to someone else, share it on social media, or contact us to set up a meeting.

