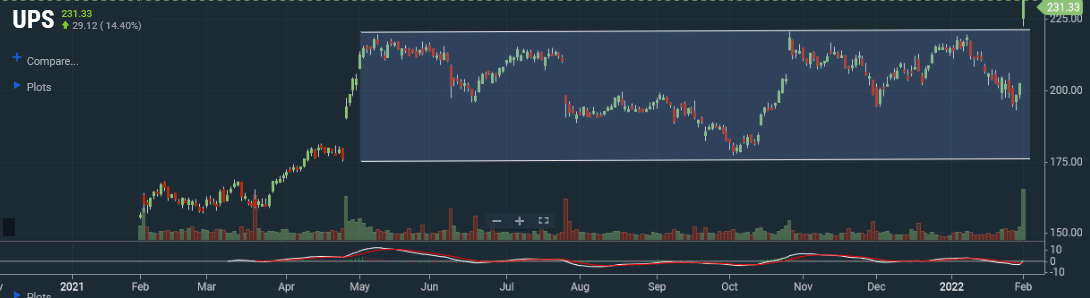
Shares of UPS rose 15% on Tuesday after reporting better than expected earnings. In addition, UPS increased its dividend by 49% to $1.52 per share and issued positive forward guidance. Inflation does not appear to be hindering UPS’s ability to profit from higher shipping revenue. To wit, it reported the highest operating profit margin in 14 years. As shown below, the stock broke out of a 9-month trading channel to new highs. The S&P 500 and Industrials sector followed UPS higher, posting .60% and 1.40% gains respectively. UPS is the second largest contributor to the industrial sector with a 5% weight.

What To Watch Today
Economy
- 7:00 a.m. ET: MBA Mortgage Applications, week ended Jan. 28 (-7.1% during prior week)
- 8:15 a.m. ET: ADP Employment Change, January (184,000 expected, 807,000 prior month)
Earnings
Pre-market
- 6:00 a.m. ET: ThermoFisher Scientific (TMO) to report adjusted earnings of $5.15 on revenue of $9.63 billion
- 6:05 a.m. ET: Marathon Petroleum (MPC) to report adjusted earnings of 56 cents on revenue of $27.97 billion
- 6:30 a.m. ET: AmerisourceBergen (ABC) to report adjusted earnings of $2.58 on revenue of $59.70 billion
- 6:30 a.m. ET: Boston Scientific (BSX) to report adjusted earnings of 44 cents on revenue of $3.11 billion
- 6:30 a.m. ET: Humana (HUM) to report adjusted earnings of $1.15 on revenue of $21.16 billion
- 7:40 a.m. ET: AbbVie (ABBV) to report adjusted earnings of $3.27 on revenue of $15.00 billion
Post-market
- 4:00 p.m. ET: T-Mobile (TMUS) to report adjusted earnings of 12 cents on revenue of $21.07 billion
- 4:00 p.m. ET: Qualcomm (QCOM) to report adjusted earnings of $3.00 on revenue of $10.45 billion
- 4:05 p.m. ET: Meta Platforms (FB) to report adjusted earnings of $4.20 on revenue of $33.43 billion
- 4:05 p.m. ET: Spotify (SPOT) to report adjusted losses of 39 cents on revenue of $2.65 billion
Sentiment Is So Bearish Its Bullish
“We’ve seen how much sentiment has soured over the past couple of weeks from multiple perspectives. On Monday, more evidence came from small options traders, who spent a record amount on protective puts last week.
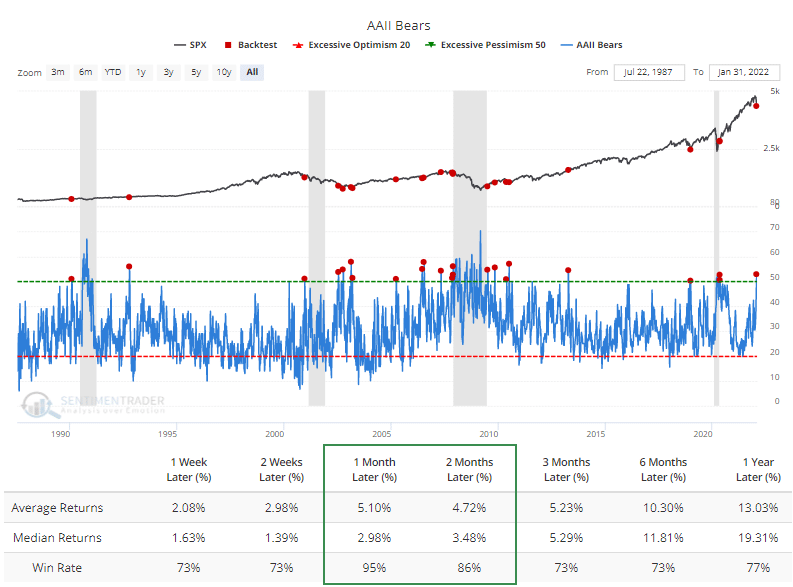
We prefer to focus on real-money gauges as opposed to surveys because people don’t always do what they say they’re going to do. Still, the survey of individual investors from AAII got quite a bit of attention last week. It showed that for one of the few times in the past decade, bears accounted for more than 50% of respondents.
When more than 50% of investors said they were bearish and the U.S. economy was not in a recession at the time, the S&P 500 rallied during the next month after 21 out of 22 signals (and that sole loss was reversed during the subsequent month).” – Sentiment Trader
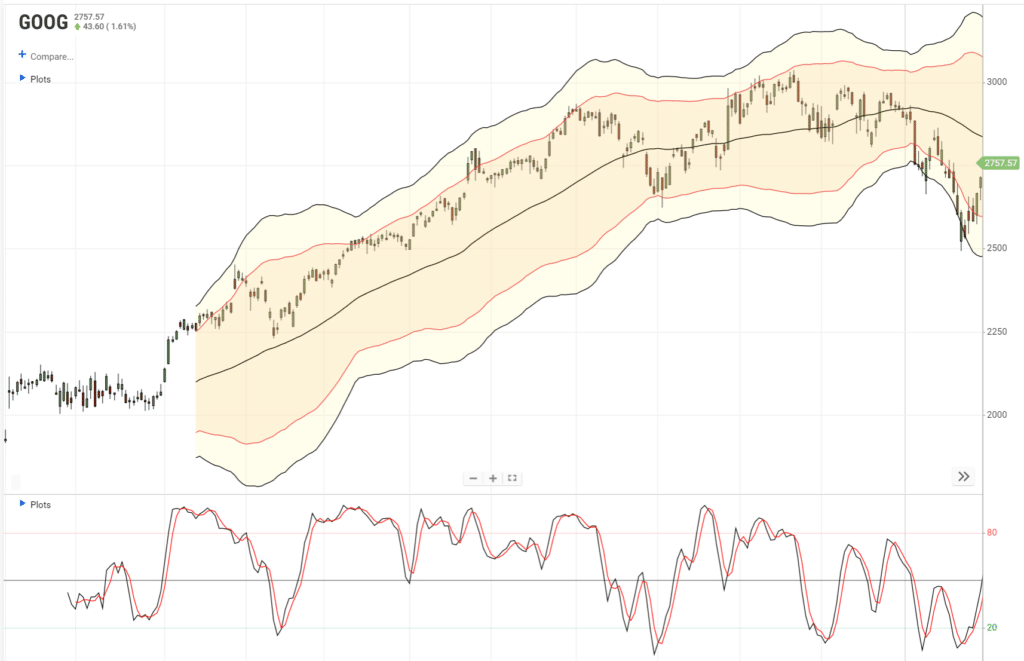
Google Crushes Earnings
Like UPS, Apple, and Microsoft, Google crushed earnings after the bell yesterday.
Google parent Alphabet reported better-than-expected fourth-quarter earnings and revenue. The shares popped more than 6% in extended trading.
The company also announced a 20-for-1 stock split that will go into effect in July.
Here are the key numbers:
- Earnings per share (EPS): $30.69 vs $27.34 expected, according to Refinitiv
- Revenue: $75.33 billion vs $72.17 billion expected, according to Refinitiv
- YouTube advertising revenue: $8.63 billion vs. $8.87 billion expected, according to StreetAccount
- Google Cloud revenue: $5.54 billion vs $5.47 billion expected, according to StreetAccount
- Traffic acquisition costs (TAC): $13.43 billion vs. $12.84 billion expected, according to StreetAccount
Alphabet reported revenue growth of 32%, proving again that it was able to withstand the pressures from the pandemic and inflation. The results follow a year of outperformance. The stock surged 65% last year, beating all other Big Tech companies and more than tripling gains in the S&P 500. – CNBC
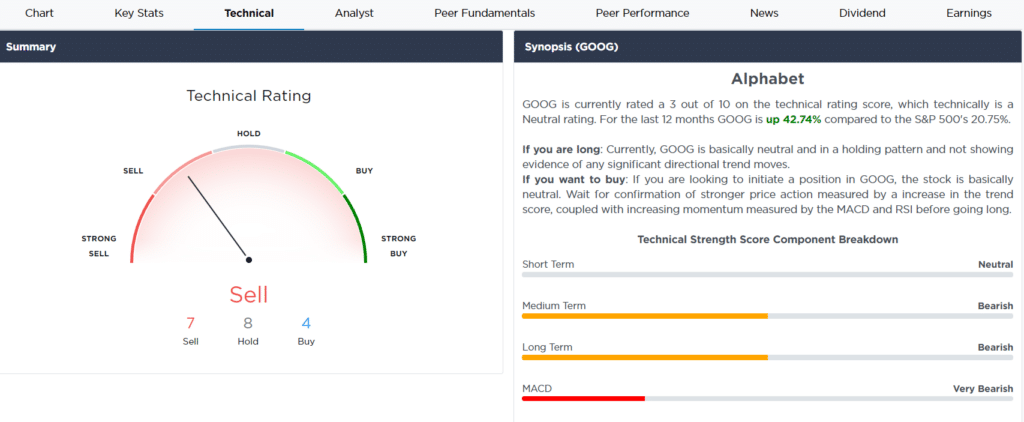
While the technical rating declined with the recent drop in the stock price, the long-term fundamental story keeps it a roughly 4.5% weighting in our equity model.
JOLTS and ISM
The JOLTS report covering the month of December shows the number of job openings rose to 10.925 million, well above expectations of 10.3 million. There are now 4.6 million more jobs openings than unemployed people. The quits rate was little changed at 2.9%. During Powell’s most recent press conference, he mentioned that the strong labor market would put upward pressure on inflation as workers demand higher wages. The latest round of JOLTS data reinforces his concerns.
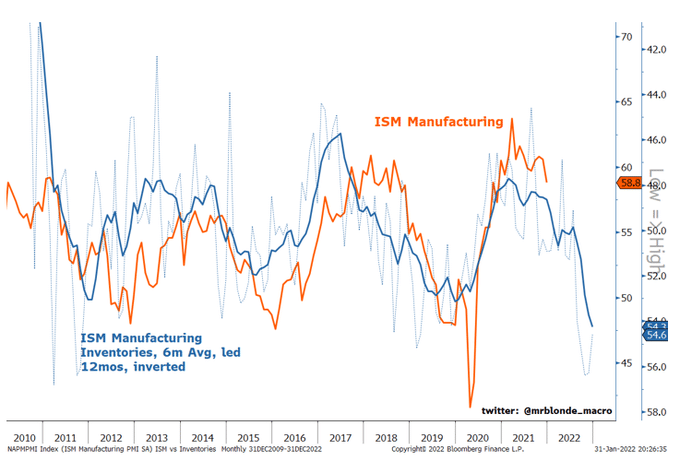
After last week’s poor PMI survey, we were concerned that ISM would fall well short of expectations. ISM met expectations but fell from 58.8 to 57.6. The details of the report, however, offer some caution. Order backlogs are back to 6-month lows. The good news is it is disinflationary, but it points to weakening demand. In the same vein, Inventories rose significantly and are back to pre-Covid levels. The graph below from @mrblonde_macro shows that inventories tend to lead the broad ISM number by six months. If the relationship holds up we should expect a contractionary ISM print (less than 50) by the summer. Prices paid show there is no relenting of price pressures. The price paid sub-index rose from 67 to 76.1. Employment also upticked, confirming the JOLTS data.
Speculators and Commercials Record Short and Long Positions- What Does it Mean?
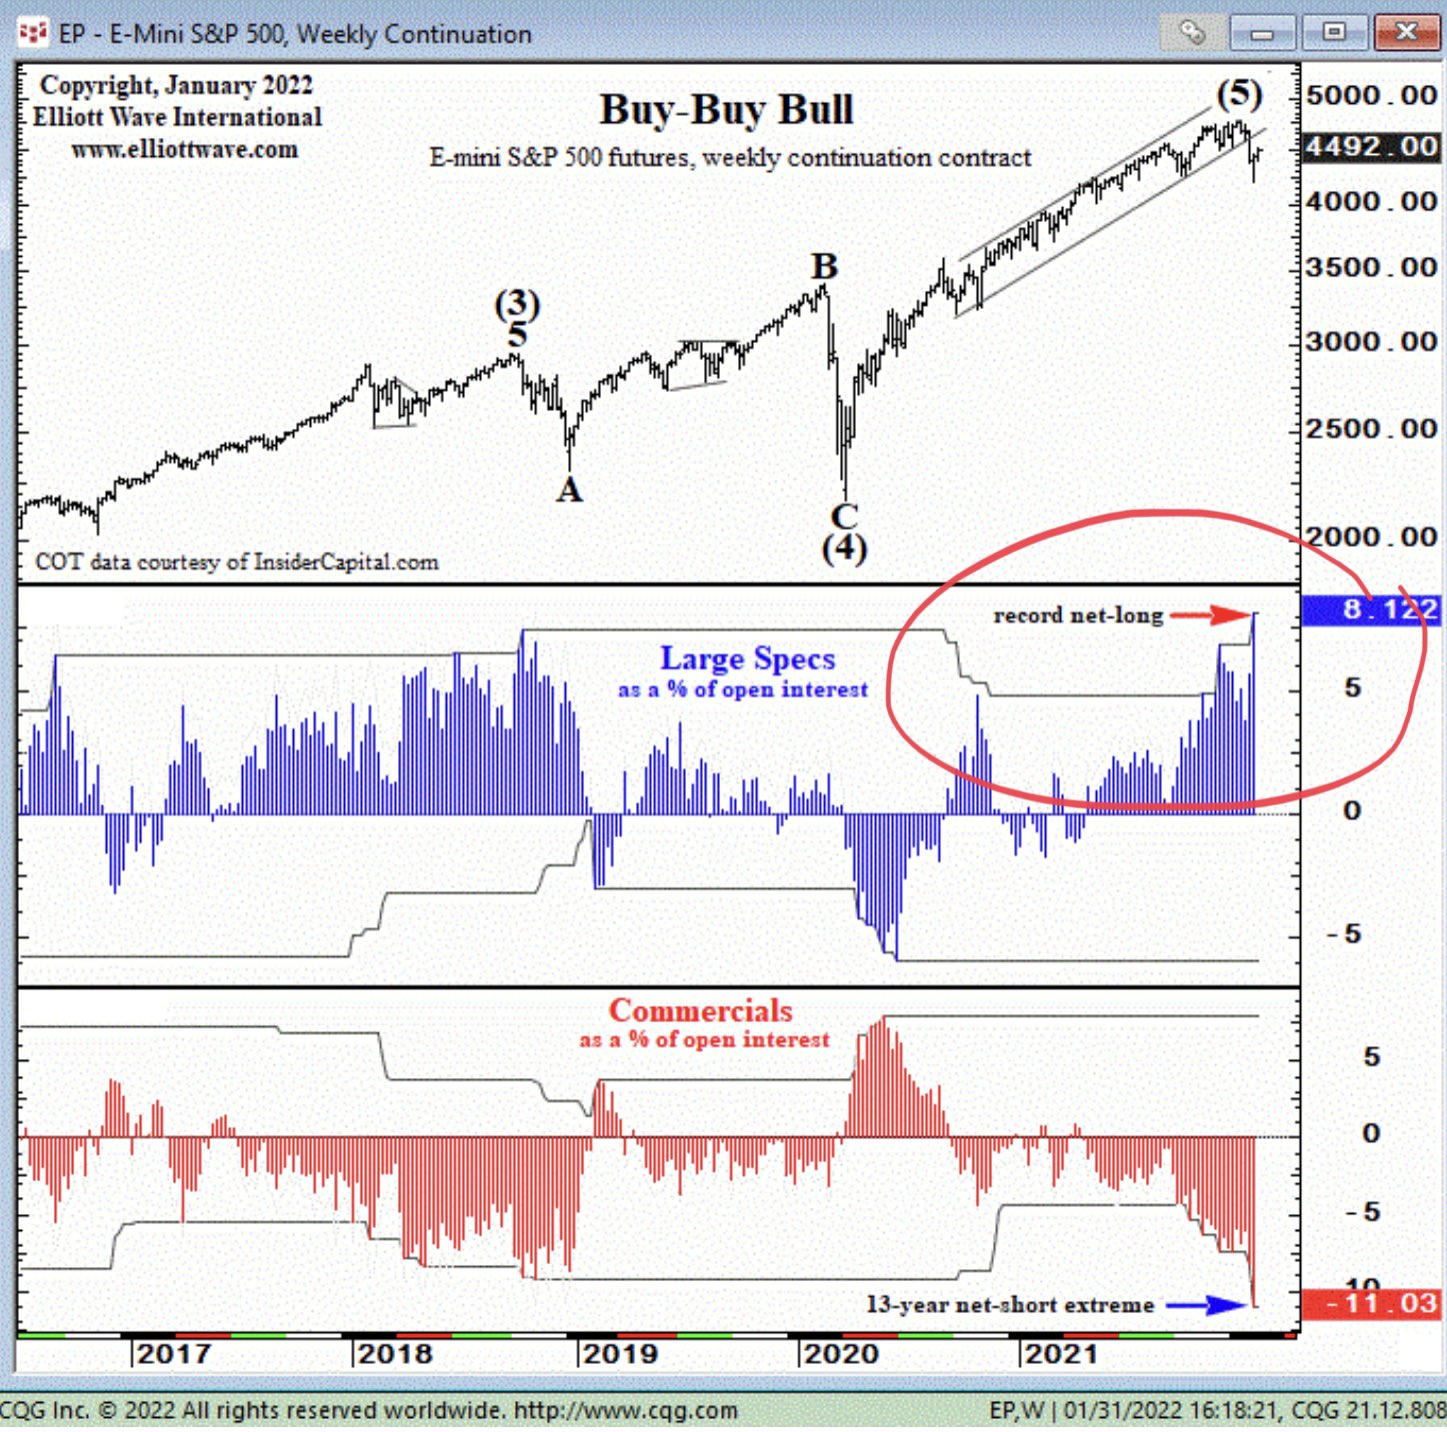
Per the latest CFTC’s Commitment of Trader Reports (COT), Large Speculative accounts are the longest of S&P 500 futures contracts in 13 years. As a result, Commercials are the shortest over the same period. Speculative accounts are institutional trading accounts such as hedge funds and CTAs. Commercials are market makers consisting of the largest banks and brokers. Bottom line- institutional speculators are betting heavily that the market bounce continues, and the banks/brokers are taking the other side of the bet.
Powell Doesn’t Have the Midas Touch
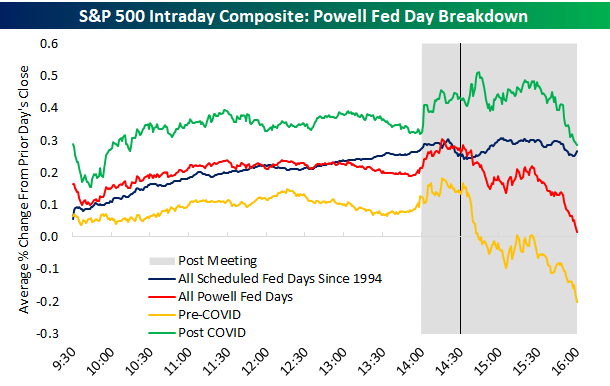
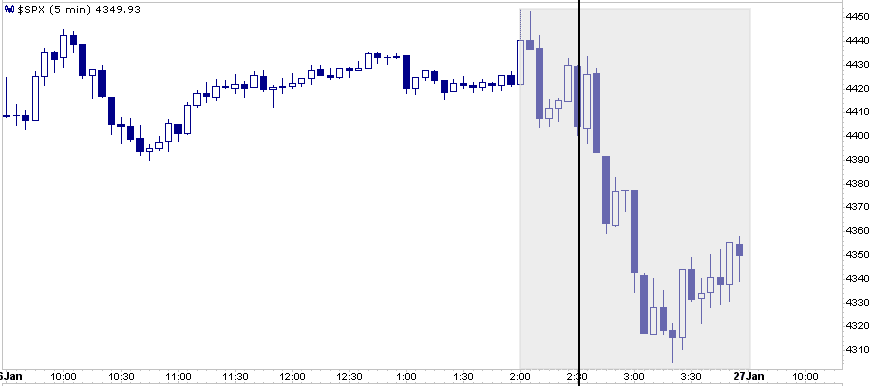
The graph below, courtesy of Bespoke Investment Group, shows the average performance of the S&P 500 on days with Fed FOMC meetings. The shaded area starts at 2 pm ET when the FOMC statement is released. The line at 2:30 pm ET marks when the Fed Chairman starts the press conference. Last Wednesday, the market followed the Powell line (red) below, as shown in the second graph. After the statement was released at 2 pm, the market surged higher with the S&P 500 peaking at up 100 points on the day. Once Powell mentioned the words “sooner and faster” regarding QT (early in the press conference), stock prices fell sharply. Significant gains became losses. The intraday high of 4453 was shortly followed by the intraday low of 4304. The message for trading around future meetings, sell before Powell begins the press conference but after the FOMC statement is released.
Please subscribe to the daily commentary to receive these updates every morning before the opening bell.
Also Read