


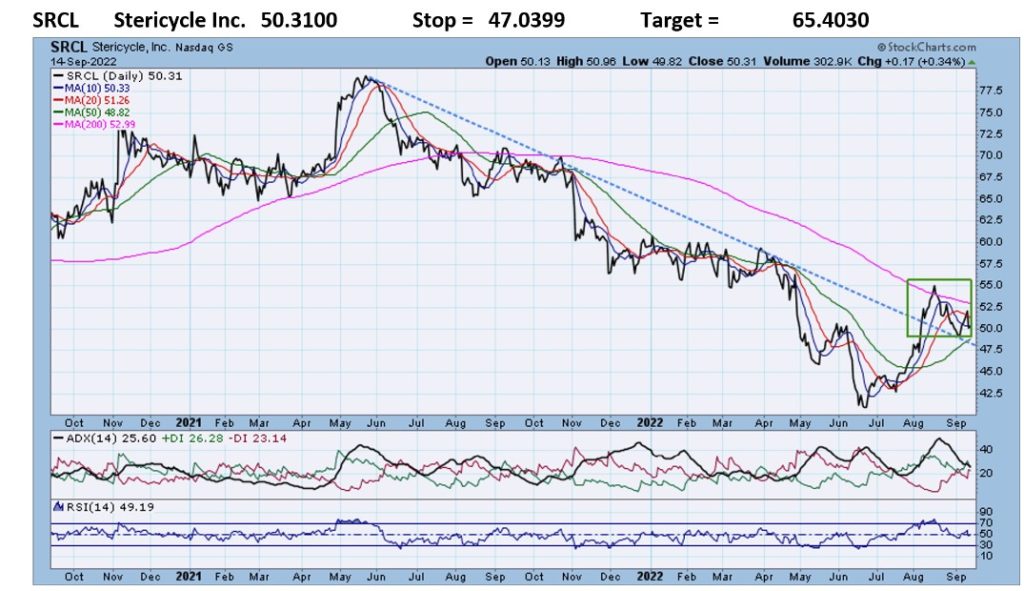
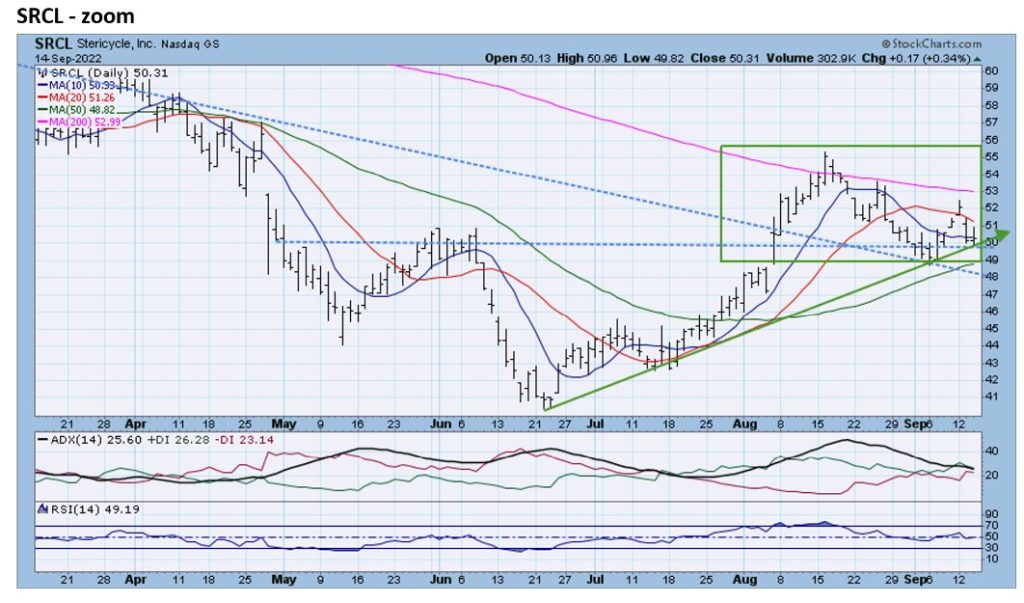
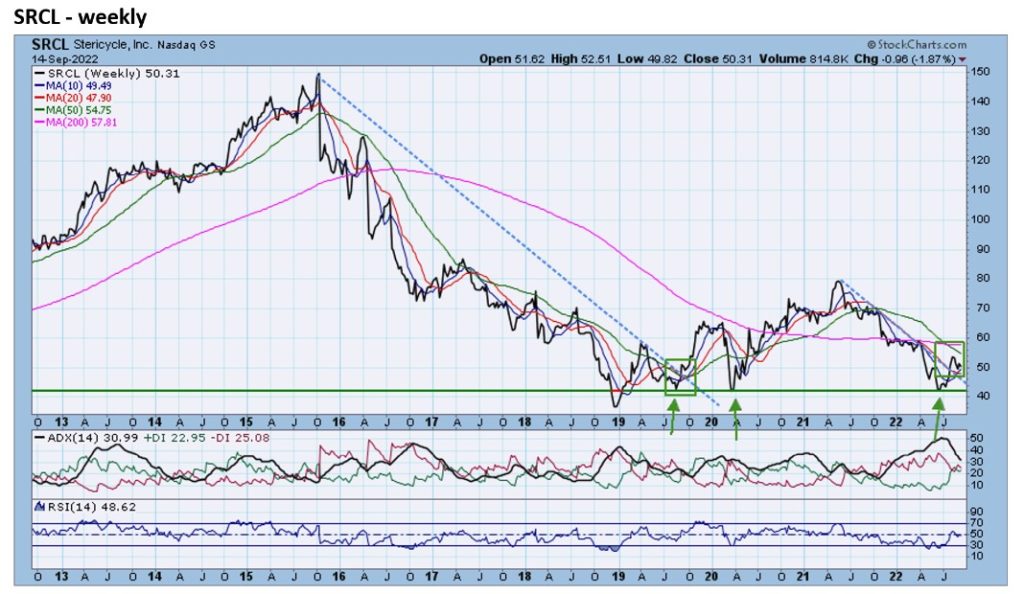
- SRCL rose above its 15-month downtrend line in August. The zoom chart reveals that the rally in August also put SRCL above 3-month resistance at the 50 level. SRCL has established a pattern of higher lows=uptrend and the recent decline puts it at uptrend support. The weekly chart shows that the low is June was a true long-term inflection point as it matches up with support from 2019 and 2020. The weekly chart also shows that SRCL is very close to the bottom of its 10-year trading range.
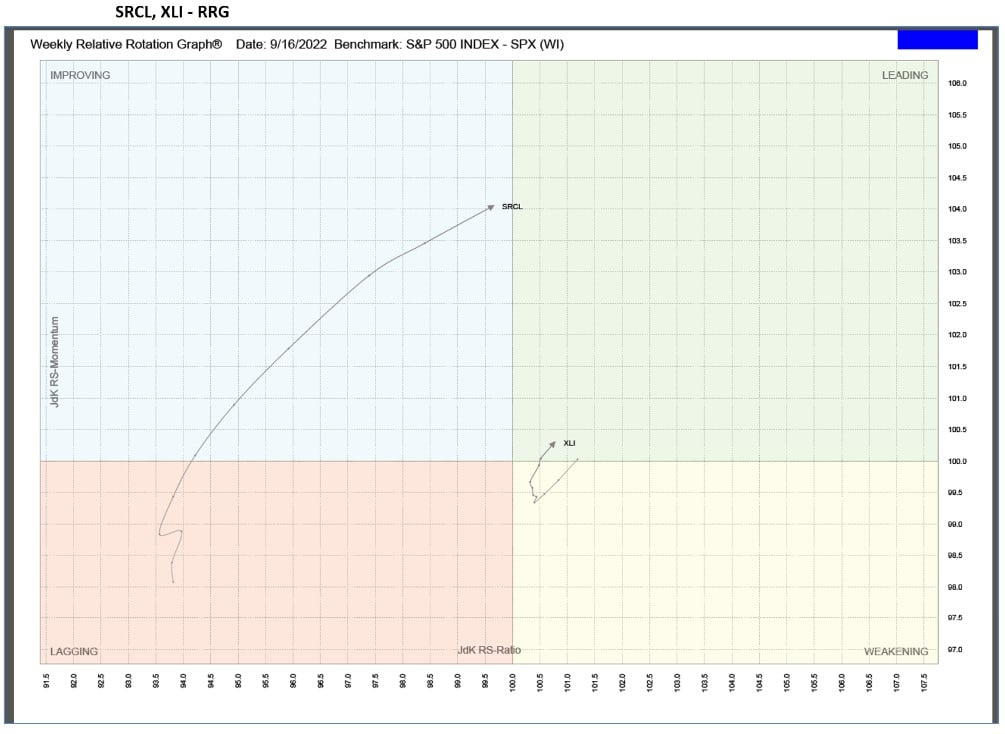
RRG analysis shows that SRCL has moved out of the Lagging quadrant, into the Improving quadrant, and is headed to the Leading quadrant. (see RRG below).
Relative Rotation Graphs (RRG) – explanation video


Jeff Marcus founded Turning Point Analytics (TPA) in 2009 after 25 years on trading desks and 13 years as a head trader to provide strategic and technical research to institutional clients. Turning Point Analytics (TPA) provides a unique strategy that works as an overlay to clients’ good fundamental analysis. After 10 years of serving only large institutions, TPA now offers its research services to mid and small managers, RIA’s, and wealthy sophisticated individuals looking for a way to increase their returns and outperform their peers.
Subscribe 2 Week Trial
Customer Relationship Summary (Form CRS)
Also Read


