


The Treasury bond yield curve has a near-perfect track record for predicting recessions. Inverted yield curves, when the yields on short-maturity bonds are greater than long-maturity bonds, are precursors to recessions. Yield curve inversions, however, are poor timing tools. The last four recessions started after an inverted yield curve un-inverted back to its normal positive slope. Yield curve inversions and uninversions are the bond markets’ way of pricing in lag effects. The task we face in predicting when the lag effects will result in a weaker economy or recession is predicting when the yield curve will uninvert.
To help us, we present a technical analysis of the 3-month/10-year yield curve. The graphs below are from an astute client of ours. The graph on the left is the yield curve with its 50, 100, and 200 dmas. The second is the recent two-year period blown up to see the curve and its averages better. Before focusing on the moving averages, notice how yield curve inversions and uninversions occur before each recession. It’s hard to see, but the turning point of those pre-recession yield curve inversions was signaled by the 50dma crossing above the 100 and 200 dmas. The graph on the right shows the 50dma is now above the 100dma and is quickly approaching the 200dma. Such a crossing, called a “golden cross,” is bullish, meaning the yield curve universion may be upon us shortly. If so, a recession may not be far behind.

What To Watch Today
Earnings
- No notable earnings releases today.
Economy

Market Trading Update
The market took a hit this week as the Fed projections of “higher for longer” killed the “rate cut hopes.” However, while there was much handwringing and teeth-gnashing over the decline, it was quite normal within any given year. As we noted in June:
“Notably, in any given year, bullish or bearish, a 5-10% correction is entirely normal and healthy. Such corrective actions are opportunities to increase portfolio equity risk.”
It took a bit longer than expected for the correction to begin, but in late July, the market peaked and has continued to correct through September. With the market still in a broader uptrend, the bullish backdrop remains, but there is a risk of a decline to 4200. However, the market is oversold on many levels, so a reflexive rally next week to the 50-DMA would be unsurprising.
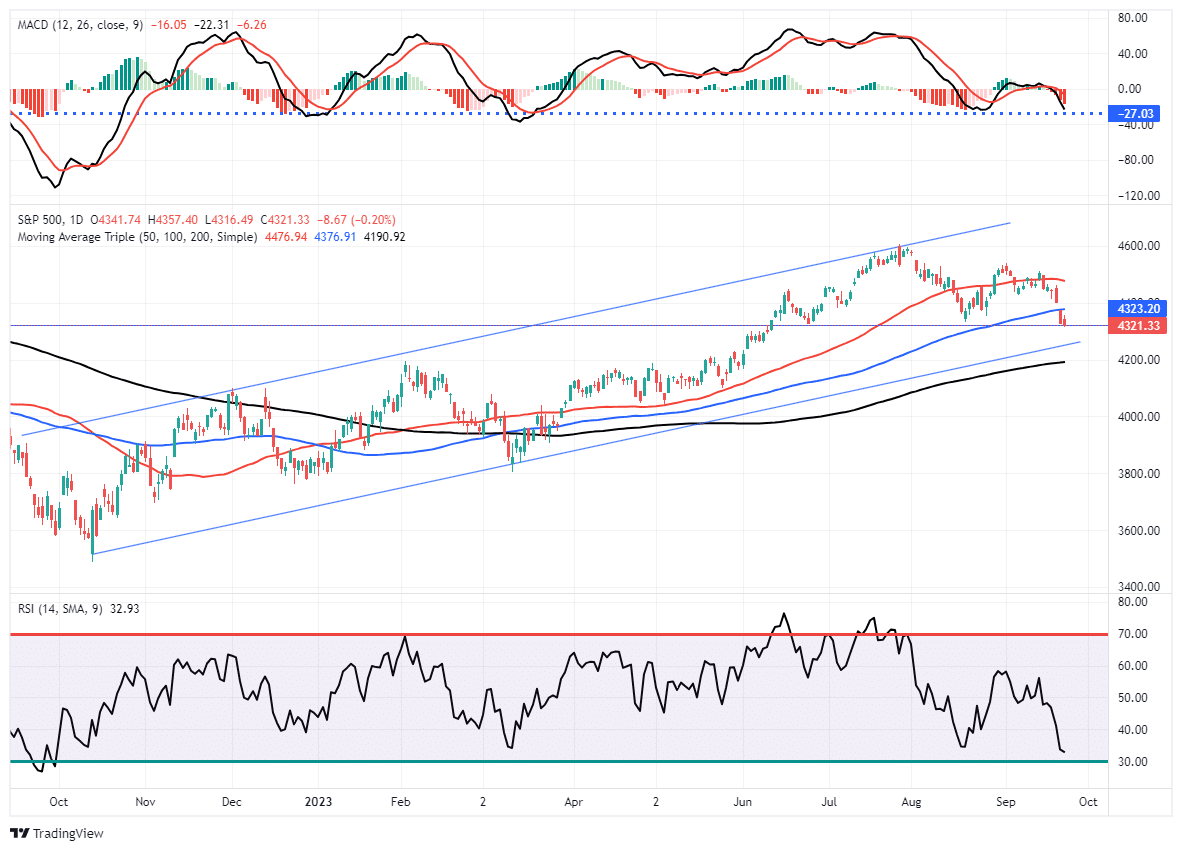
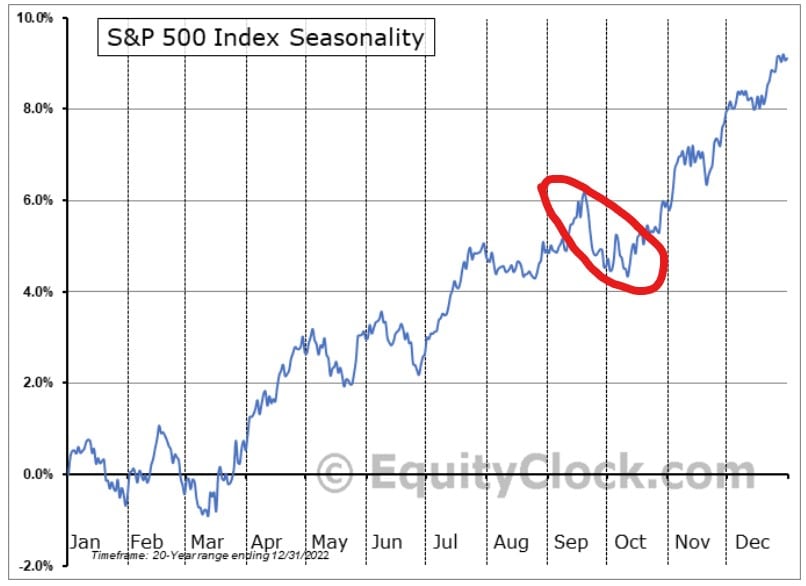
Not only is the current correction normal, but it is also well aligned with the seasonal tendencies of market returns, as we noted on Tuesday in “October Weakness.”
“While September has been a bit sloppy so far, will further weakness in October weigh on investor sentiment before the seasonally strong period begins? The S&P 500 index seasonality chart below shows weakness in the last two weeks of September and the first two weeks of October is common.”
Nonetheless, the weakness following the FOMC this weakness certainly raises concerns. However, a history review suggests that while the Fed is currently “talking a tough game,” reality tends to be very different. The reason is that the Fed projections are useless because they are always late and wrong. There is no reason to suspect this time will be different.

The Week Ahead
Jerome Powell made it clear the Fed is data-dependent as it weighs whether or not to raise rates at the coming November and December meetings. With that, the next round of employment and inflation data will be of primary importance and help the markets better assess what the Fed may do at coming meetings.
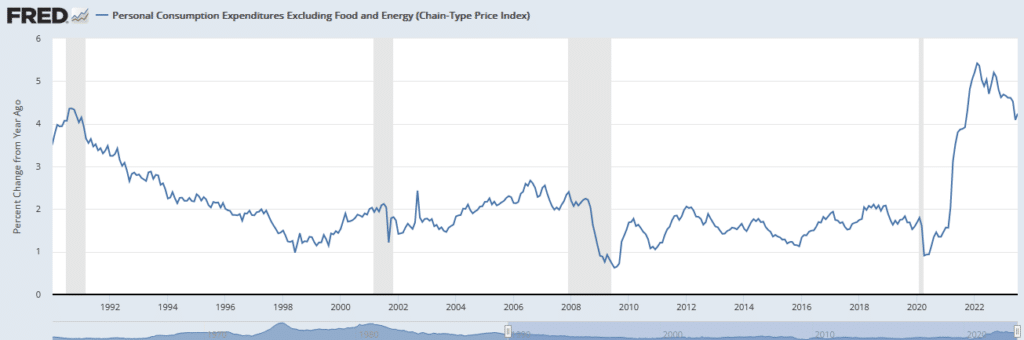
The PCE price index gets less fanfare than CPI, but the Fed prefers it to measure prices. On Friday, the core PCE is expected to increase by 0.2%, in line with last month’s reading, and decline from 4.2% to 3.8% on a year-over-year basis. The all-inclusive (non-core) number is expected to increase from 0.2% to 0.4%. Also on the inflation front will be the University of Michigan consumer sentiment survey. Inflation expectations, in the survey, fell unexpectedly from 3% to 2.7% in the last report. The Fed puts a lot of stock in the relationship between expectations and future inflation readings. The Chicago, Dallas, Richmond, and Kansas City Fed surveys will provide close to real-time sentiment of business leaders on prices and employment in the manufacturing and service sectors.
With the Fed meeting past, Fed members will be back on the speaking circuit. We suspect some will lean toward hiking rates by another 25bps, while others will want to refrain. Based on Powell’s press conference last week, it appears the Fed wants to keep the threat of 25bps out there but not necessarily use it as they are concerned about the lag effect of the prior hikes.
Friday marks the last trading day of the quarter, so expect some volatility throughout the week as investment managers “window dress” their portfolios.
Labor Weakness or Normalization?
The number of job openings is falling rapidly. At the same time, ADP and the BLS are reporting that job growth is slowing to more normal levels. The recent slowing of the labor market begs the question- is the labor market simply getting back to pre-pandemic levels, or will the recent weakness continue?
To help us consider the question, we lean on ECRI’s latest report on the job market. The Economic Cycle Research Institute (ECRI) has a long and distinguished track record of forecasting business cycles. Presidents, Fed Chairmen, and business leaders have used their information to make more informed decisions.
With that, let’s look at their recent report. Their broad labor conditions index shows that the labor market is always expanding or contracting. It rarely consolidates. Over the last year, the index has been declining, indicating a weakening of the labor market. Such always occurs before a recession. But, even with the decline, the index is still above the 30+ year peak. Instead of falling precipitously as it has done in the past, might it level out once the pandemic-related stimulus is fully exited from the economy? The following two graphs show some of the subcomponents of the index. In both cases, these leading indicators are declining but still at or above pre-pandemic levels.

ECRI sums up its report as follows:
Beyond the debate of a soft or hard landing, our forward-looking indicators offer little sign of a sustained revival. However, at least some of the non-cyclical forces still boosting the economy are liable to subside while the cyclical drag remains. The outcome of this tug-of-war will determine the hardness of the landing.
Tweet of the Day

Please subscribe to the daily commentary to receive these updates every morning before the opening bell.
If you found this blog useful, please send it to someone else, share it on social media, or contact us to set up a meeting.
Also Read


