


“Peter Cook is the author of the ‘Is That True?’ series of articles, which help explain the many statements and theories circulating in the mainstream financial media often presented as “truths.” The motives and psychology of market participants, which drives the difference between truth and partial-truth, are explored.”
The persistent rise in interest rates has become a dominant topic of the financial media. It is now common to read articles on how a rise in the 10-year Treasury bond rate to a specific level will produce some type of sea-change in perception and/or reality. Some of those points are already in the rear-view mirror (2.65%), while another was crossed this week (3.05%), and still others lie ahead (3.22%). Some commentators eschew a specific interest rate and instead specify a range, such as 3.50%-3.75%.
The focus on interest rates is understandable. Rising rates are, by definition, a negative influence on bond prices. With tens of trillions of dollars of bonds outstanding, a rise in interest rates of, say, 1%, produces market losses of hundreds of billions of dollars. If the Fed’s beloved “wealth effect” ever existed, it is now a movie that is running in reverse, perhaps more quickly than it ever ran in forward.
In addition to negatively influencing bond prices, rising rates are perceived to be a negative influence on most other assets, such as real estate, commodities, or private businesses. Of course, this is also true of stock valuations. Ever since the peak in interest rates in the early 1980s, falling interest rates have been used as a primary justification for rising stock valuations.
Oddly, investors of the Russell 2000 index (R2K), comprised of small-cap companies, don’t seem to care about the connection between rising interest rates and lower stock prices. Defying the predictions of many, R2K made a new all-time high this week while bond yields rose to 7-year highs. This combination is particularly at odds with financial theory because R2K companies have a greater exposure to rising rates than larger companies. For example, the maturity of the debt of R2K companies matures earlier and carries a higher interest rate than large companies in the S&P500 index (SPX).
Looking at other influences on stock prices, R2K historically tends to rise when the dollar is strong, but it also tends to be weak when the price of oil is rising. So recent changes in the dollar and oil largely negate each other and don’t explain the R2K’s strength.
Diving further into relative valuations, the Wall Street Journal publishes valuations on a weekly basis, as shown in the table below.

The price/earnings ratio (PE) based on the past year’s earnings is far higher for R2K (88.75) than SPX (24.28) and even the NASDAQ 100 index (24.99), an index dominated by the largest U.S. growth (technology) companies, which should presumably be valued more highly than smaller companies. Looking forward, after waving the magic wand which uses operating earnings instead of GAAP earnings, R2K (26.15) is still valued more highly than the SPX (17.05) and NASDAQ (20.25). It is important to note that the P/E calculation for the R2K throws out the earnings of companies losing money, while SPX includes them. Ergo, the true P/E of R2K is larger than it appears. The following quote was from an article written in 2016 that analyzed R2K valuations:
“As a point of comparison, the widely reported P/E ratio of 46 for the R2K appears to be much lower than our value (237x). Unlike, the market benchmark S&P 500, the reported Russell P/E ratio excludes companies with negative earnings. Our analysis appropriately includes both positive and negative earnings.” – Banks in Drag : The Russell 2000 Exposed
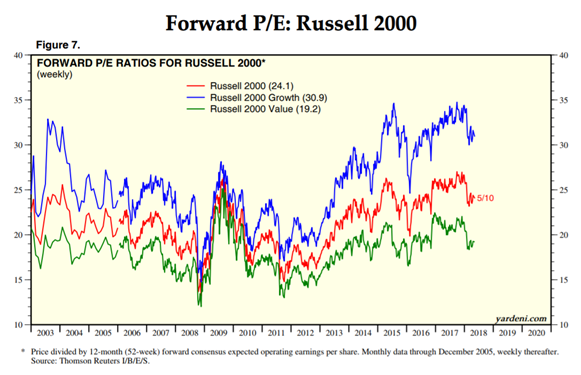
Historically, the R2K is trading near its all-time high in valuation, as shown below by the red line. Since 2003, the R2K traded at a higher valuation only a few times; during the earnings crash and recession of 2009, briefly during 2015, and again throughout 2017. Although Yardeni.com calculates a slightly different P/E for the R2K (24.1) than the WSJ, it is still higher than both the SPX and NASDAQ, and as noted above likely much higher on an apples-to-apples basis.
R2K companies are more exposed to the U.S. economy than larger companies, because larger companies derive a greater percentage of revenues and profits from overseas. So one explanation for the higher valuation of R2K companies is that U.S. economic growth will be stronger than global growth. But it is also true that the Fed is well into a tightening cycle that is designed to restrain growth and inflation, while Europe and Japan still have the monetary petal pushed to the metal, including negative interest rates. As previously explained HERE, the combination of rising interest rates and energy prices has preceded every U.S. recession of the past 45 years, and that combination is present yet again in 2018.
In conclusion, interest rates are rising, but they have not produced the expected effect on stock prices. R2K companies are trading at an all-time high in price as bond yields are breaking to multi-year highs. R2K companies are trading at a high PE multiple relative to larger, more stable companies that have less exposure to rising interest rates. R2K companies also are trading at a high PE multiple relative to historical norms. Perhaps all of these conditions will continue into the future, but that seems like a low-probability bet, which is a major source of risk for small-cap U.S. stocks.
Also Read


