


Yesterday the Federal Reserve began shrinking its balance sheet, kicking off a new QT era. The only other QT era was in 2018. In 2018, the Fed shrunk its balance sheet by about $700 billion in 15 months. The first QT era ended with equity markets falling and hedge funds demanding liquidity. The Fed responded with lower interest rates and a new QE program in which they purchased short-term Treasury bills.
The latest QT round comes on the back of unprecedented amounts of QE. As a result, the Fed’s balance sheet increased by nearly $5 trillion in two years. That is more than all of the prior QE periods combined. A while back, we wrote The Fed is Juicing Stocks to share our thoughts on how QE helps stocks. For the same reasons, QT has the opposite effect. Accordingly, buckle up; a new era of QT is upon us!


What To Watch Today
Economy
- 7:30 a.m. ET: Challenger Job Cuts, year-over-year, May (6.0% prior)
- 8:15 a.m. ET: ADP Employment Change, May (300,000 expected, 247,000 prior)
- 8:30 a.m. ET: Nonfarm Productivity, Q1 final (-7.5% expected, 7.5% prior)
- 8:30 a.m. ET: Unit Labor Costs, Q1 final (11.6% expected, 11.6% final)
- 8:30 a.m. ET: Initial Jobless Claims, week ended May 28 (210,000 expected, 210,000 prior)
- 8:30 a.m. ET: Continuing Claims, week ended May 21 (1.340 mil expected, 1.346 mil prior)
- 10:00 a.m. ET: Factory Orders, April (0.7 expected, 2.2% prior, revised to 1.8%)
- 10:00 a.m. ET: Factory Orders Excluding Transportation, April (2.5% prior, revised to 2.1%)
- 10:00 a.m. ET: Durable goods orders, April final (0.4% expected, 0.4% prior)
- 10:00 a.m. ET: Durables excluding transportation, April final (0.3%prior )
- 10:00 a.m. ET: Non-defense capital goods orders excluding aircraft, April final (0.3% prior)
- 10:00 a.m. ET: Non-defense capital goods shipments excluding aircraft, April final (0.8% prior)
Earnings
Pre-market
- Hormel Foods (HRL) to report adjusted earnings of $0.47 on revenue of $3.07 billion
Post-market
- Lululemon (LULU) to report adjusted earnings of $1.43 on revenue of $1.54 billion
- Okta (OKTA) to report an adjusted loss of $0.33 on revenue of $388.89 million
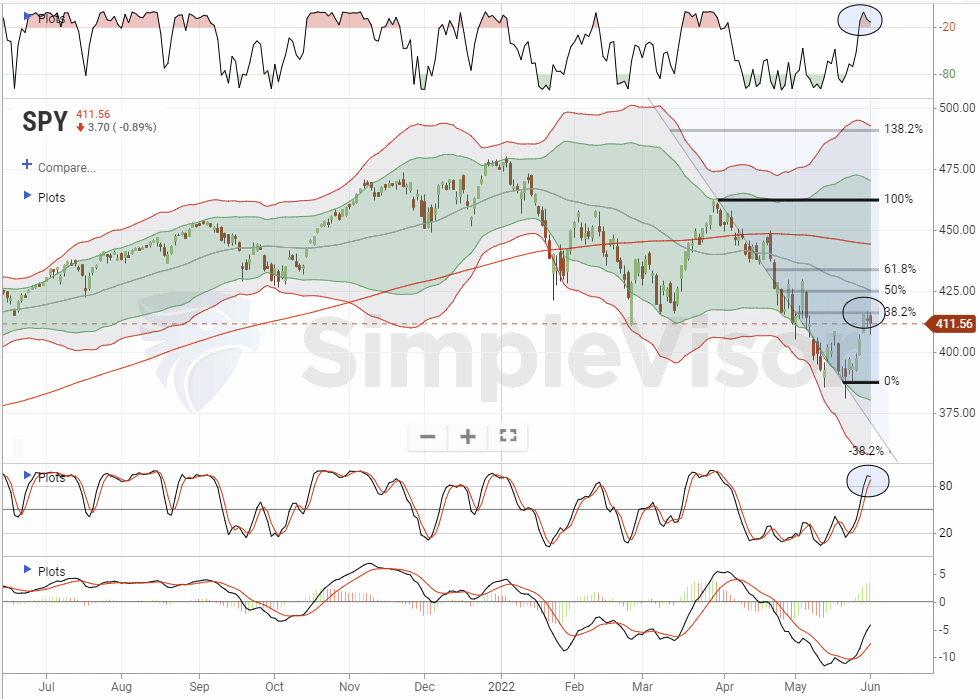
Market Trading Update – Stocks Studder On Fed Concerns
Yesterday, stocks sold off mid-day as the Fed’s Raphael Bostic walked back comments on a “Fed pause” by the end of summer. With President Biden saying he won’t interfere with the Fed, the pressure is now on Jerome Powell to squelch inflation without creating an economic disaster. Since such isn’t likely, between the end of the QT Era and higher rates, corporate profitability will weaken leading to further revaluation of asset prices.
With the failure of the rally at the downtrend line from the March highs and the 38.2% retracement levels, we continue to suggest selling rallies for now.
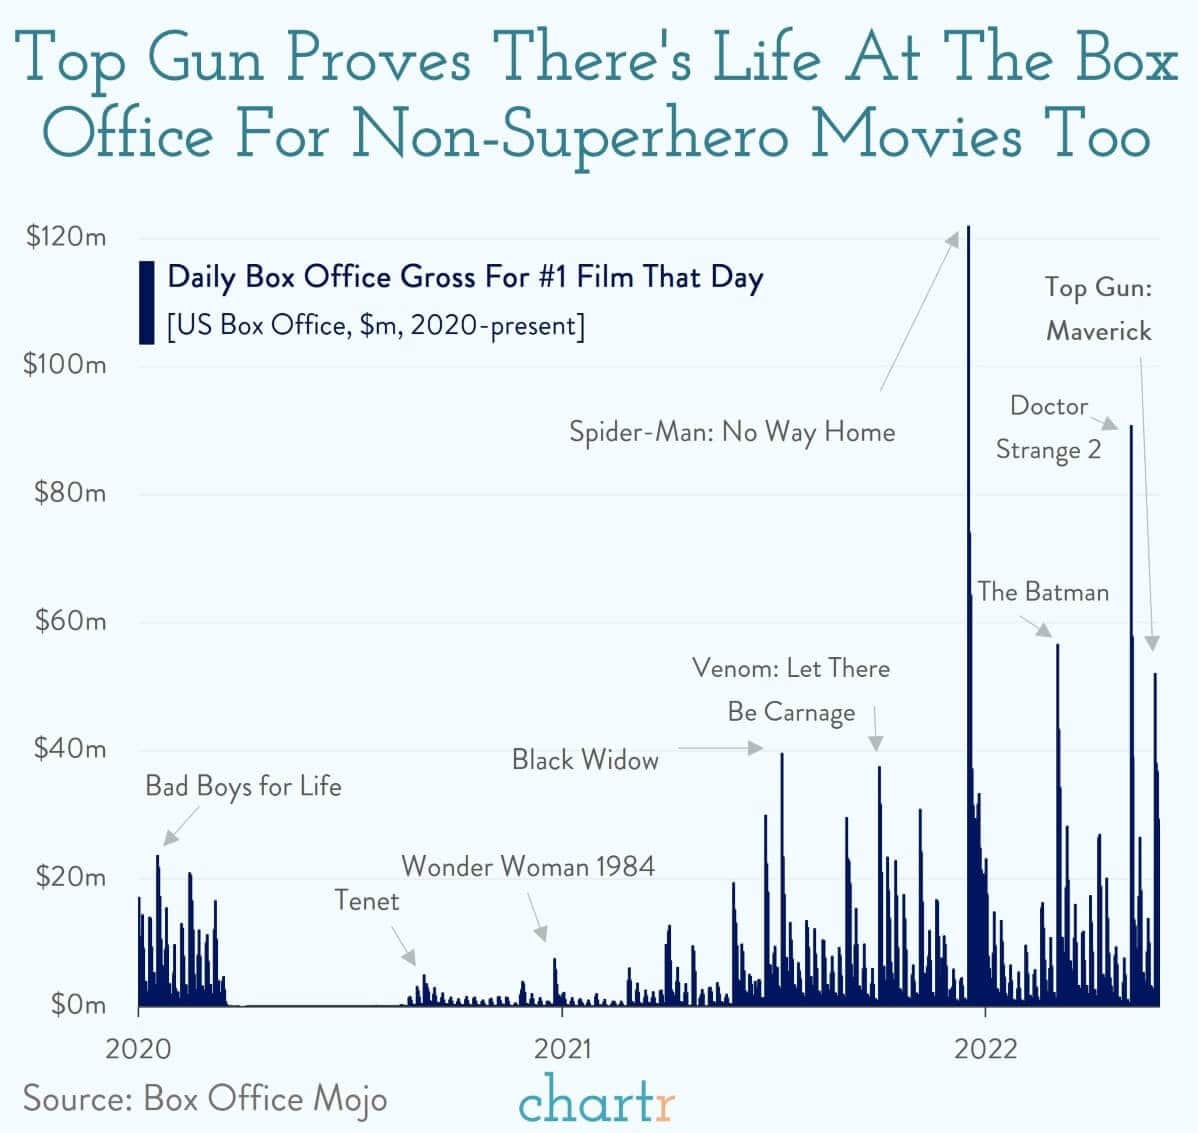
Top Gun Draws A Crowd
“Top Gun: Maverick has taken off at theatres, raking in $156m in the US over the extended Memorial Day weekend. That haul not only breaks the previous record for the holiday from 2007, but it also marks Tom Cruise’s own personal record for a box office weekend debut — which is good going for an actor that is sixth on the all-time list of highest grossing actors.
With sky-high ratings — 8.7 / 10 on IMDB and 96% fresh on Rotten Tomatoes — the coming weeks are likely to see Top Gun: Maverick go on to become one of the biggest box office hits of the year. That’s important because Top Gun is pretty much the first non-superhero movie to be a really big hit since the pandemic.” – Chartr
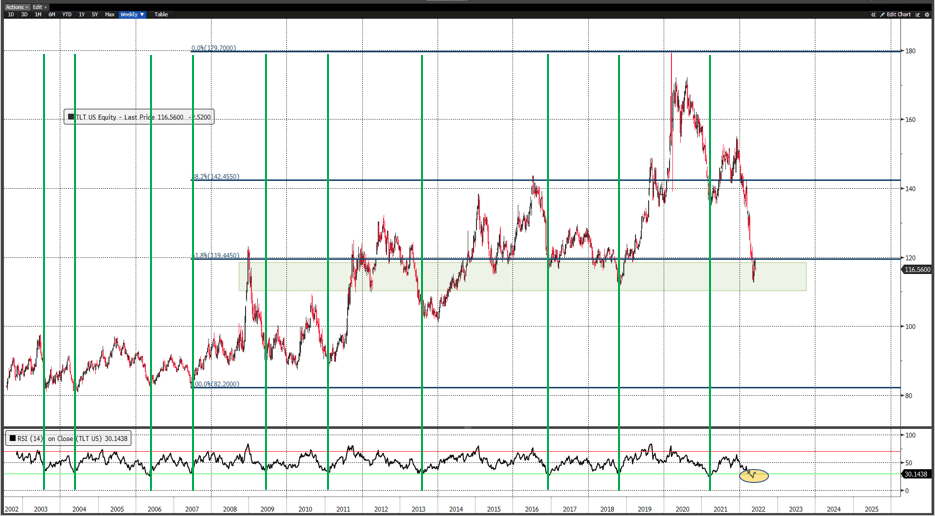
Bonds Signal Buying Opportunity
The graph below shows the weekly price of TLT and its 14-week RSI. When the RSI dips to 30 or below, TLT has bounced. In 2018 when the first QT era began, the bounce was worth over 60 points. The RSI just dipped below 30 and is now rebounding. Will this be like the ten other times TLT rallied from similar oversold levels?
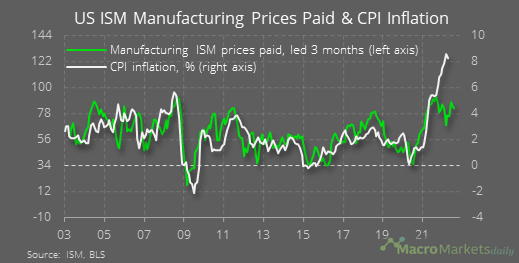
ISM Put Fed Stall on Hold
The narrative this past week was that recent weakening economic data might allow the Fed to pause its rate hikes. ISM Manufacturing, closely correlated to economic activity, came in above expectations and last month’s reading. Doing so took some wind out of the “Fed stall.” The only flies in the ointment within the report were that employment dipped into contractionary territory, and prices paid fell slightly but remained very high at 82.2. The graph below shows the strong correlation between prices paid and CPI with a 3-month lag. The Fed hopes the recent divergence between the two indicators resolves with CPI catching down to ISM.
Jamie Dimon Issues A Hurricane Warning
Jamie Dimon, CEO of JP Morgan, was outspoken on CNBC about what the American economy and financial system are facing as the Fed embarks on a new era of QT.
“It’s a hurricane… Everyone thinks the Fed can handle this. That hurricane is right out there. Down the road. Coming our way. We just don’t know if it’s a minor one or Superstorm Sandy”
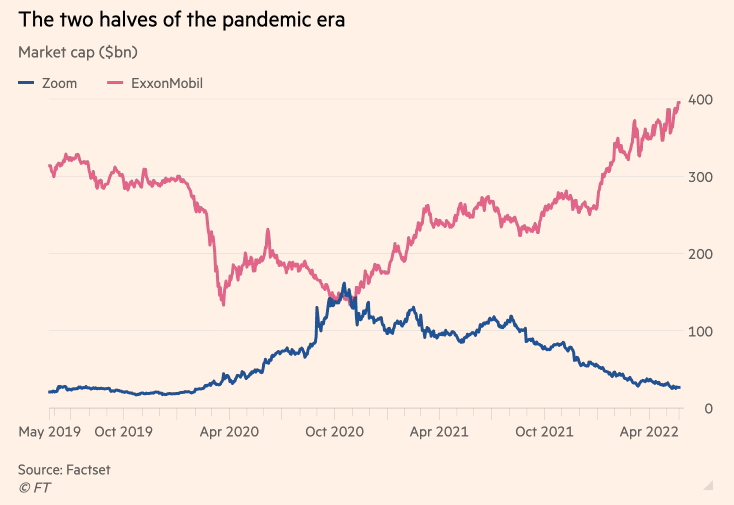
The Two Halves of the Pandemic
The FT put out the graph below showing the amazing rise and fall of Zoom and Exxon. Before the pandemic, Exxon boasted a market cap of approximately $300 billion. At the same time, Zoom was not a well-known company with a market cap nearing $20 billion. The overwhelming popularity of Zoom and the economic shutdown allowed the market cap of the two companies to converge. In October of 2021 Zoom’s market cap peaked at $159 billion. At the same time, Exxon’s market cap was slightly below $150 billion. Since then, Exxon and energy stocks have favored, while high growth tech stocks have fallen drastically. As a result, Exxon currently sports a market cap of $404 billion, over 10x that of Zoom ($32 billion).
Please subscribe to the daily commentary to receive these updates every morning before the opening bell.
If you found this blog useful, please send it to someone else, share it on social media, or contact us to set up a meeting.
Also Read


