


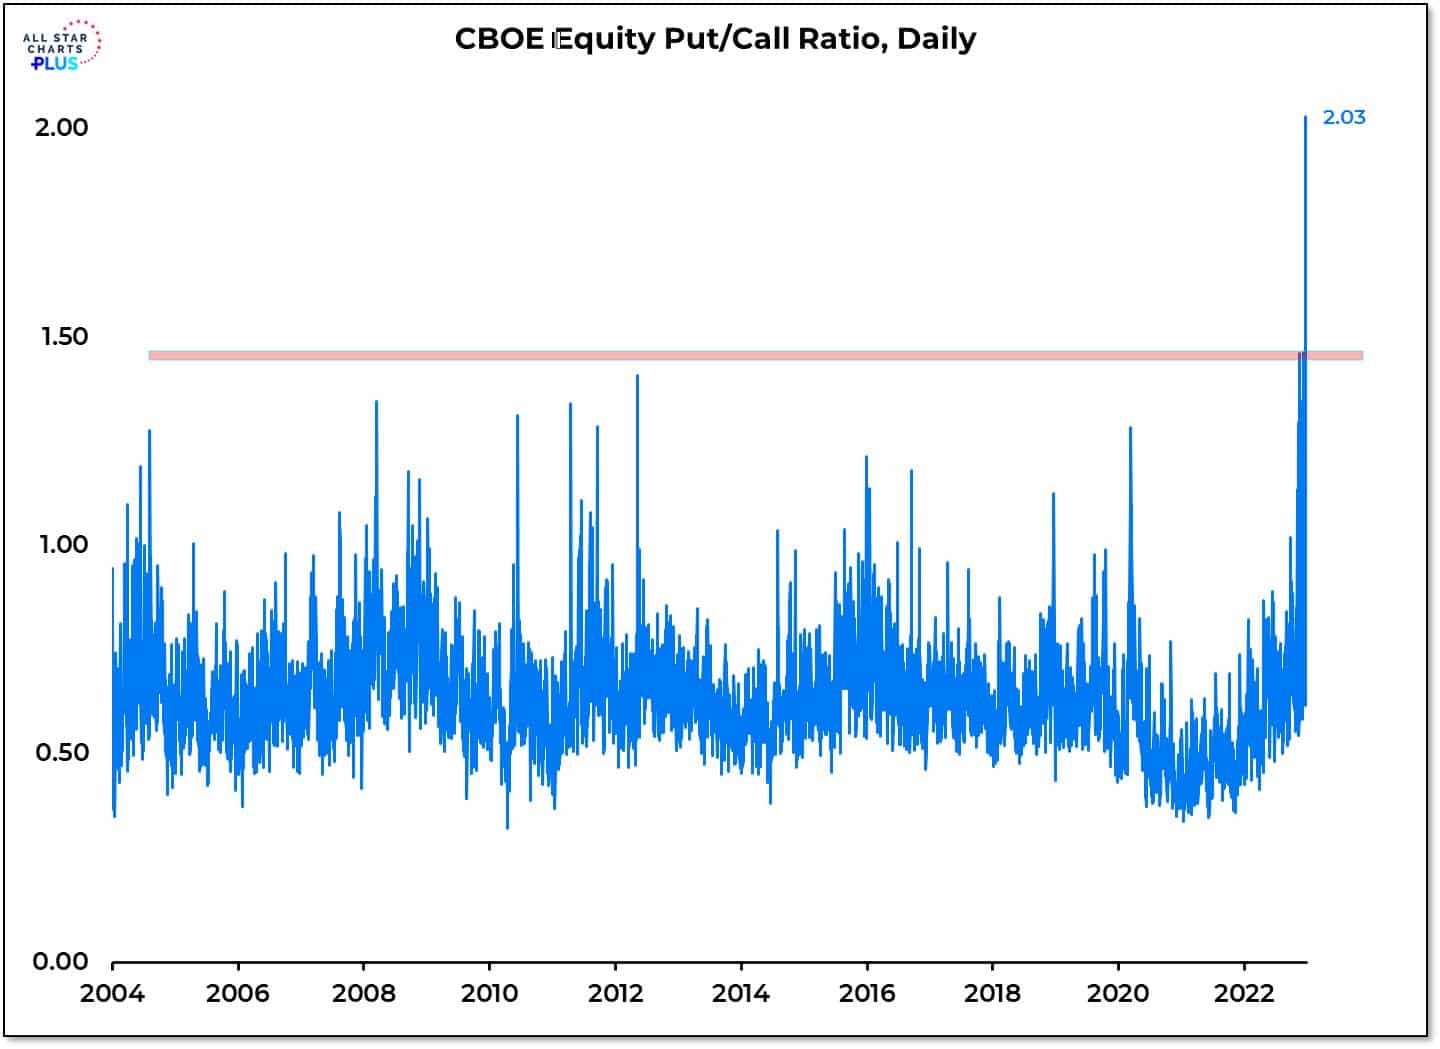
The put-call ratio is a simple calculation comparing the number of outstanding puts versus calls. Investors use it as a sentiment gauge, especially at extreme levels. A high ratio signifies that put volume well exceeds call volume, meaning that investors are excessively bearish. Often, such a circumstance is construed as a bullish contrarian indicator.
Today, as shown in the All-Star Charts graph below, the ratio is off the chart at 2.03. We have yet to hear a reasonable explanation for the recent spate of highly positive readings. Our best guess is that one-day expiry options are grossly distorting the ratio. As we shared in our Commentary from December 16: “Almost half of the volume on S&P 500 options is occurring in options that expire in less than a day. Given the extremely short time frame of said option trades, these are binary, roulette-like bets on the markets.”
These short-term directional market bets are skewing the markets and are likely responsible for the historic put-call ratio. Please don’t ignore the put-call ratio but be careful of reading too much into it.
What To Watch Today
Economy
- 8:30 a.m. ET: Personal Income, month-over-month, November (0.3% expected, 0.7% prior)
- 8:30 a.m. ET: Personal Spending, month-over-month, November (0.2% expected, 0.8% prior)
- 8:30 a.m. ET: Real Personal Spending, month-over-month, November (0.1% expected, 0.5% prior)
- 8:30 a.m. ET: PCE Deflator, month-over-month, November (0.1% expected, 0.3% prior)
- 8:30 a.m. ET: PCE Deflator, year-over-year, November (5.5% expected, 6.0% prior)
- 8:30 a.m. ET: PCE Core Deflator, month-over-month, November (0.2% expected, 0.2% prior)
- 8:30 a.m. ET: PCE Core Deflator, year-over-year, November (4.6% expected, 5.0% prior)
- 8:30 a.m. ET: Durable Goods Orders, November Preliminary (-1.0% expected, 1.1% prior)
- 8:30 a.m. ET: Durables Excluding Transportation, November Preliminary (0.0% expected, 0.5% prior)
- 8:30 a.m. ET: Non-Defense Capital Goods Orders Excluding Aircraft, November Preliminary (0.0% expected, 0.6% prior)
- 8:30 a.m. ET: Non-Defense Capital Goods Shipments Excluding Aircraft, November Preliminary (-0.3% expected, 1.5% prior)
- 10:00 a.m. ET: University of Michigan Consumer Sentiment, December final (59.1 expected, 59.1 prior)
- 10:00 a.m. ET: New Home Sales, November (600,000 expected, 632,000 prior)
- 10:00 a.m. ET: New Home Sales, month-over-month, November (-5.1% expected, 7.5% prior)
Earnings
- No notable earnings releases today.
Market Trading Update
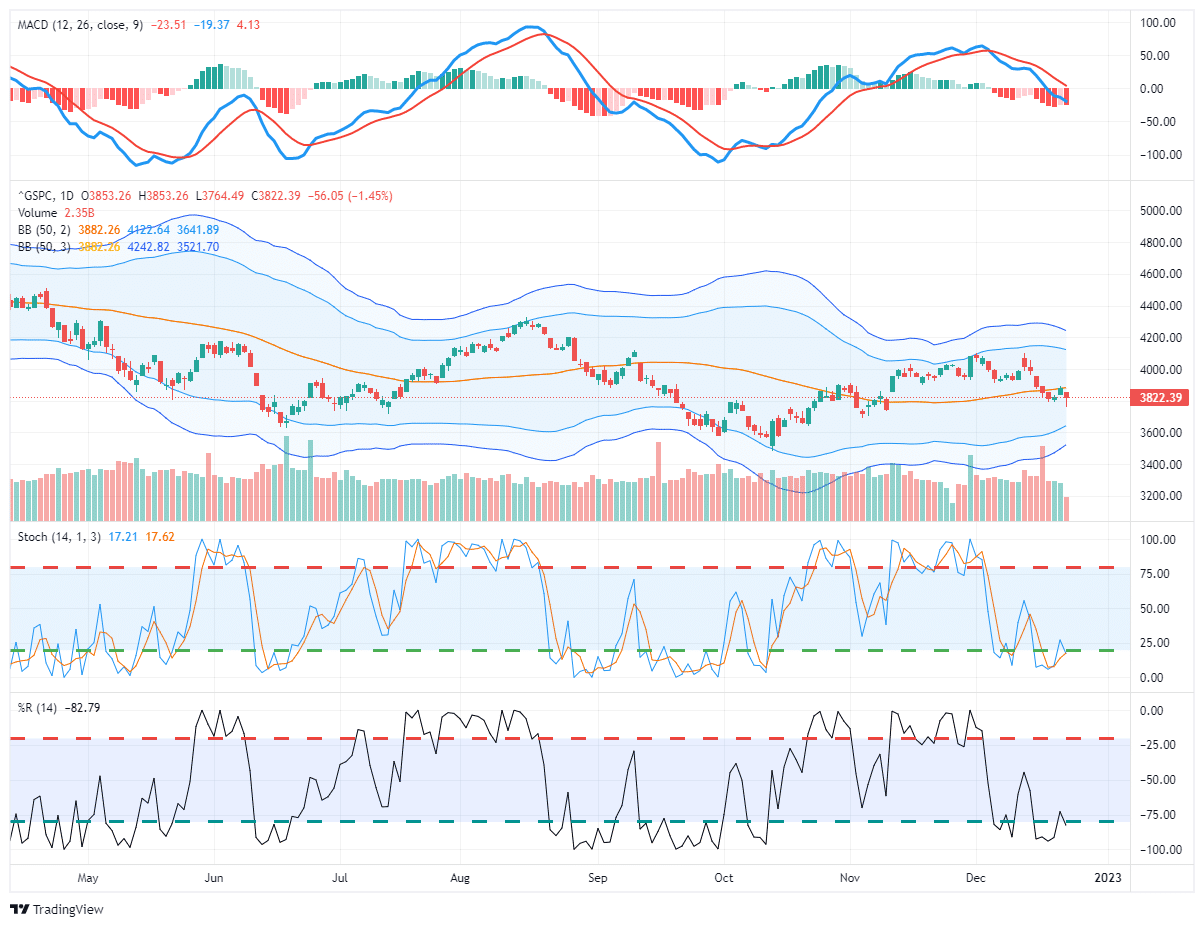
So far, “Santa Claus” has been hard to find as the year begins to close. With the market fairly negative for the month, it will take a substantial rally next week to keep it from ending in the red. Yesterday, despite the Senate passing another $1.7 Trillion in spending that we will have to issue a lot of debt to cover, the late afternoon rally failed to get the market into the green. The failure at the 50-DMA keeps short-term downward pressure on the markets along with the MACD sell signal.
The good news, if you want to call it that, is the market didn’t violate Tuesday’s lows, keeping a minor level of support intact. As shown, the market is oversold enough for a technical rally. However, as we have been cautioning over the last month, use any rally to reduce risk heading into year-end.
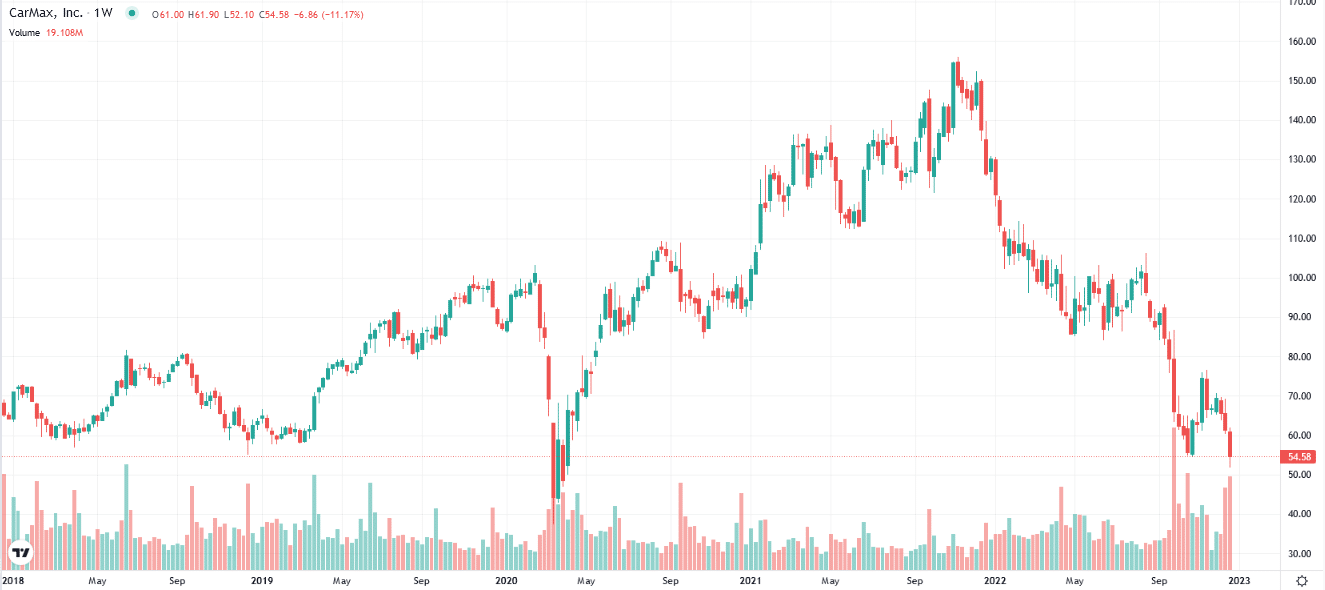
CarMax Shares Plunge
CarMax shares are down about 15% as its EPS fell well short of expectations (.24 cents vs. estimates of .65). As we wrote in Carvana Goes Kerplop, the used car industry is reeling from the hangover resulting from the massive demand and price hikes in 2020 and 2021. Per CarMax: “Vehicle affordability challenges continued to impact our third quarter unit sales performance, climbing interest rates, and low consumer confidence.” As a result of its financial difficulties, the company is suspending share repurchases to retain capital. It fears more pain to come, especially if the economy weakens. A lack of inventory was a problem in 2020 and 2021. CarMax, Carvana, and other used car dealers will have to deal with excess inventory. Such should further pressure used car prices lower.
The graph below shows that CarMax is trading well off its 2021 highs and closing in on the pandemic lows.
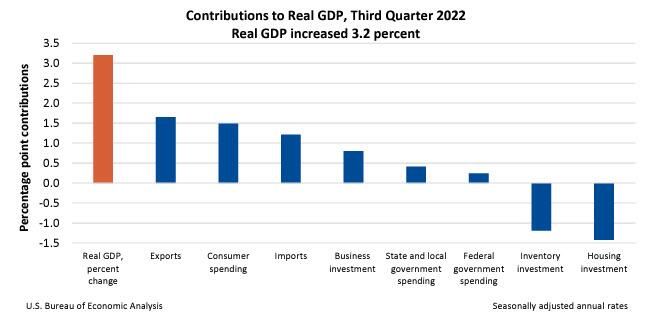
GDP Revised Higher
Q3 GDP was revised from 2.9% to 3.2%. The bulk of the revision is due to personal consumption expenditures which rose from 1.7% to 2.3%. The core PCE price index was revised by .1% to 4.7%. Judging by the strength of consumer expenditures and yesterday’s very low jobless claims data, the consumer is doing just fine. Assuming such strength continues, it will be hard for prices to fall as rapidly as the Fed prefers. The data further affirms the Fed’s projections for no pivot in 2023.

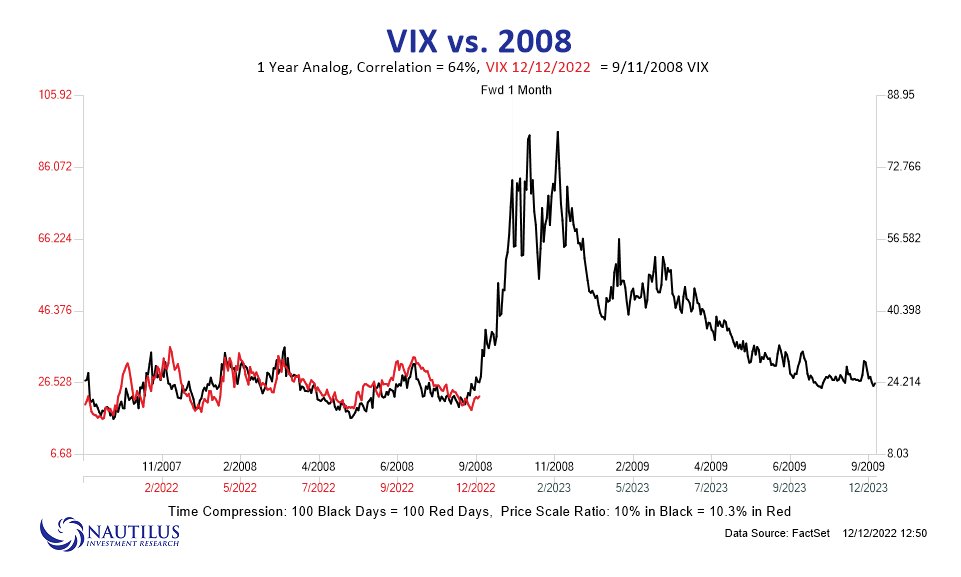
2008 vs. Today
Many analysts have compared this year’s price activity with 2007/2008. The graph below shows that the price activity in the two periods looks very similar. The obvious concern with the analog is that the market fell considerably in late August and early September 2008, setting up the Lehman failure. Will the analog continue to prove a viable road map?
Morgan Stanley’s Michael Wilson shares the table below to help us compare today with August 2008. For starters, valuations are decently higher today, as shown by the P/E ratio and the Equity Risk Premium. Those thinking the market is now cheap may want to rethink their logic. Equally important, in August 2008, the Fed was already cutting interest rates aggressively, and the yield curve was steepening. Then, the Fed already cut interest rates by 3.25%. Today they are still raising rates and want to keep them elevated for the entirety of 2023.
While the economy and financial market environments are vastly different between the two periods, we mustn’t discount the experience of 2008. The table and graphs are not a reason to sell everything and run to cash. But they should provide a warning that, despite 2022 losses, there is a lot more potential downside in the markets, especially if the Fed continues to promote hawkish policy and the economy weakens rapidly.


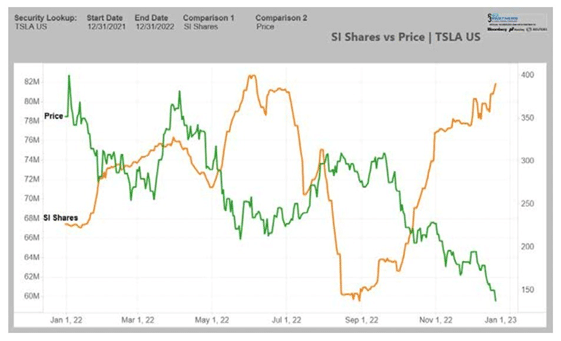
Tesla – This Year’s Most Profitable Short
Data from S3 Partners published Thursday showed that through Wednesday’s close, Tesla was the year’s most profitable short — or stock traders were betting against — with mark-to-market profits totaling $15.03 billion this year. And these figures don’t reflect Thursday’s decline.
“In December, TSLA shorts are up $4.54 billion in month-to-date mark-to-market profits, up +33.2% on an average short interest of $13.67 billion,” S3 Partners said in its report. “Since Elon Musk’s Twitter bid on 4/14/22, TSLA shorts are up $13.74 billion in mark-to-market profits, up 77.5% on an average short internet of $17.74 billion.”
Tweet of the Day
Please subscribe to the daily commentary to receive these updates every morning before the opening bell.
If you found this blog useful, please send it to someone else, share it on social media, or contact us to set up a meeting.
Also Read


