


Over the last few weeks, the market tone has changed. The S&P 500 is no longer tracking a steadily rising trend line higher. Further, the most recent market outperformers are very different from the Magnificent Seven, which led the way higher over the last six months. For investors, the changes lead to important questions. For instance, are the Magnificent Seven taking a break before retaking the outperformance throne? If not, which stocks, sectors, and factors may outperform the market? To help us answer these questions, we share analysis from the newly upgraded SimpleVisor.
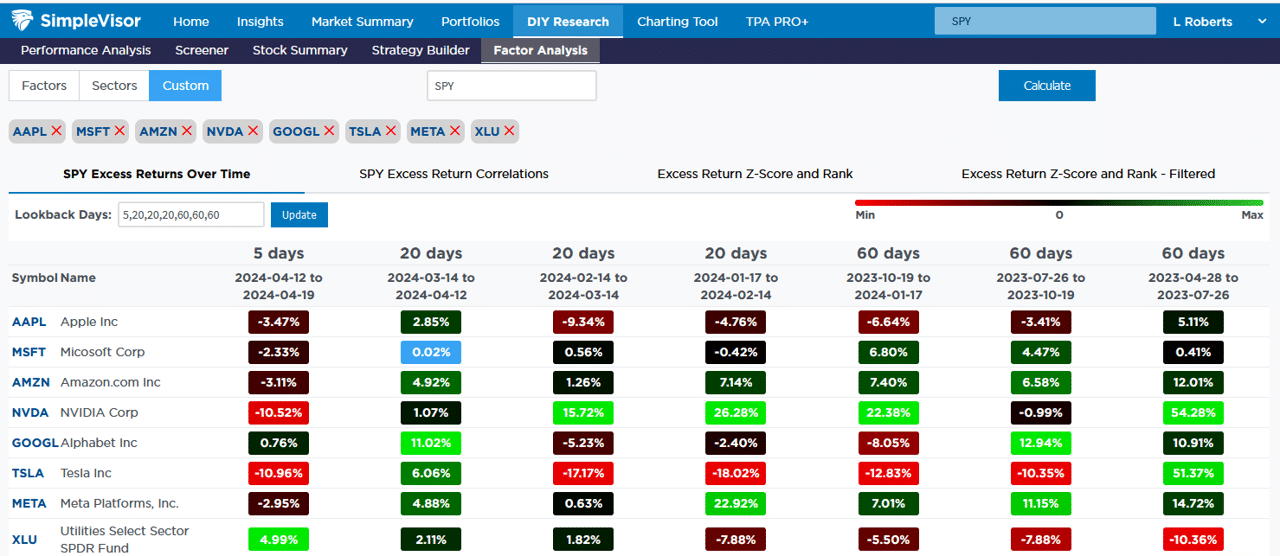
The table below shows the relative performance of the Magnificent Seven stocks versus the S&P 500. Their performance has been dreadful over the last five days, but in the previous 20 days leading up to last week, they beat the market. NVDA and TSLA had last week’s worst relative performance, giving up over 10% to the S&P 500. However, NVDA has been consistently grossly outperforming the market over prior periods, while Tesla has been giving up ground since last July. If you notice, we added XLU, the utility sector ETF, to the list of the Magnificent Seven stocks. Suppose utilities are on the cusp of leading the market for a stretch of time. In that case, the SimpleVisor analysis we share further below will help us appreciate its performance and that of its underlying stocks versus the Magnificent Seven and the rest of the market.
What To Watch Today
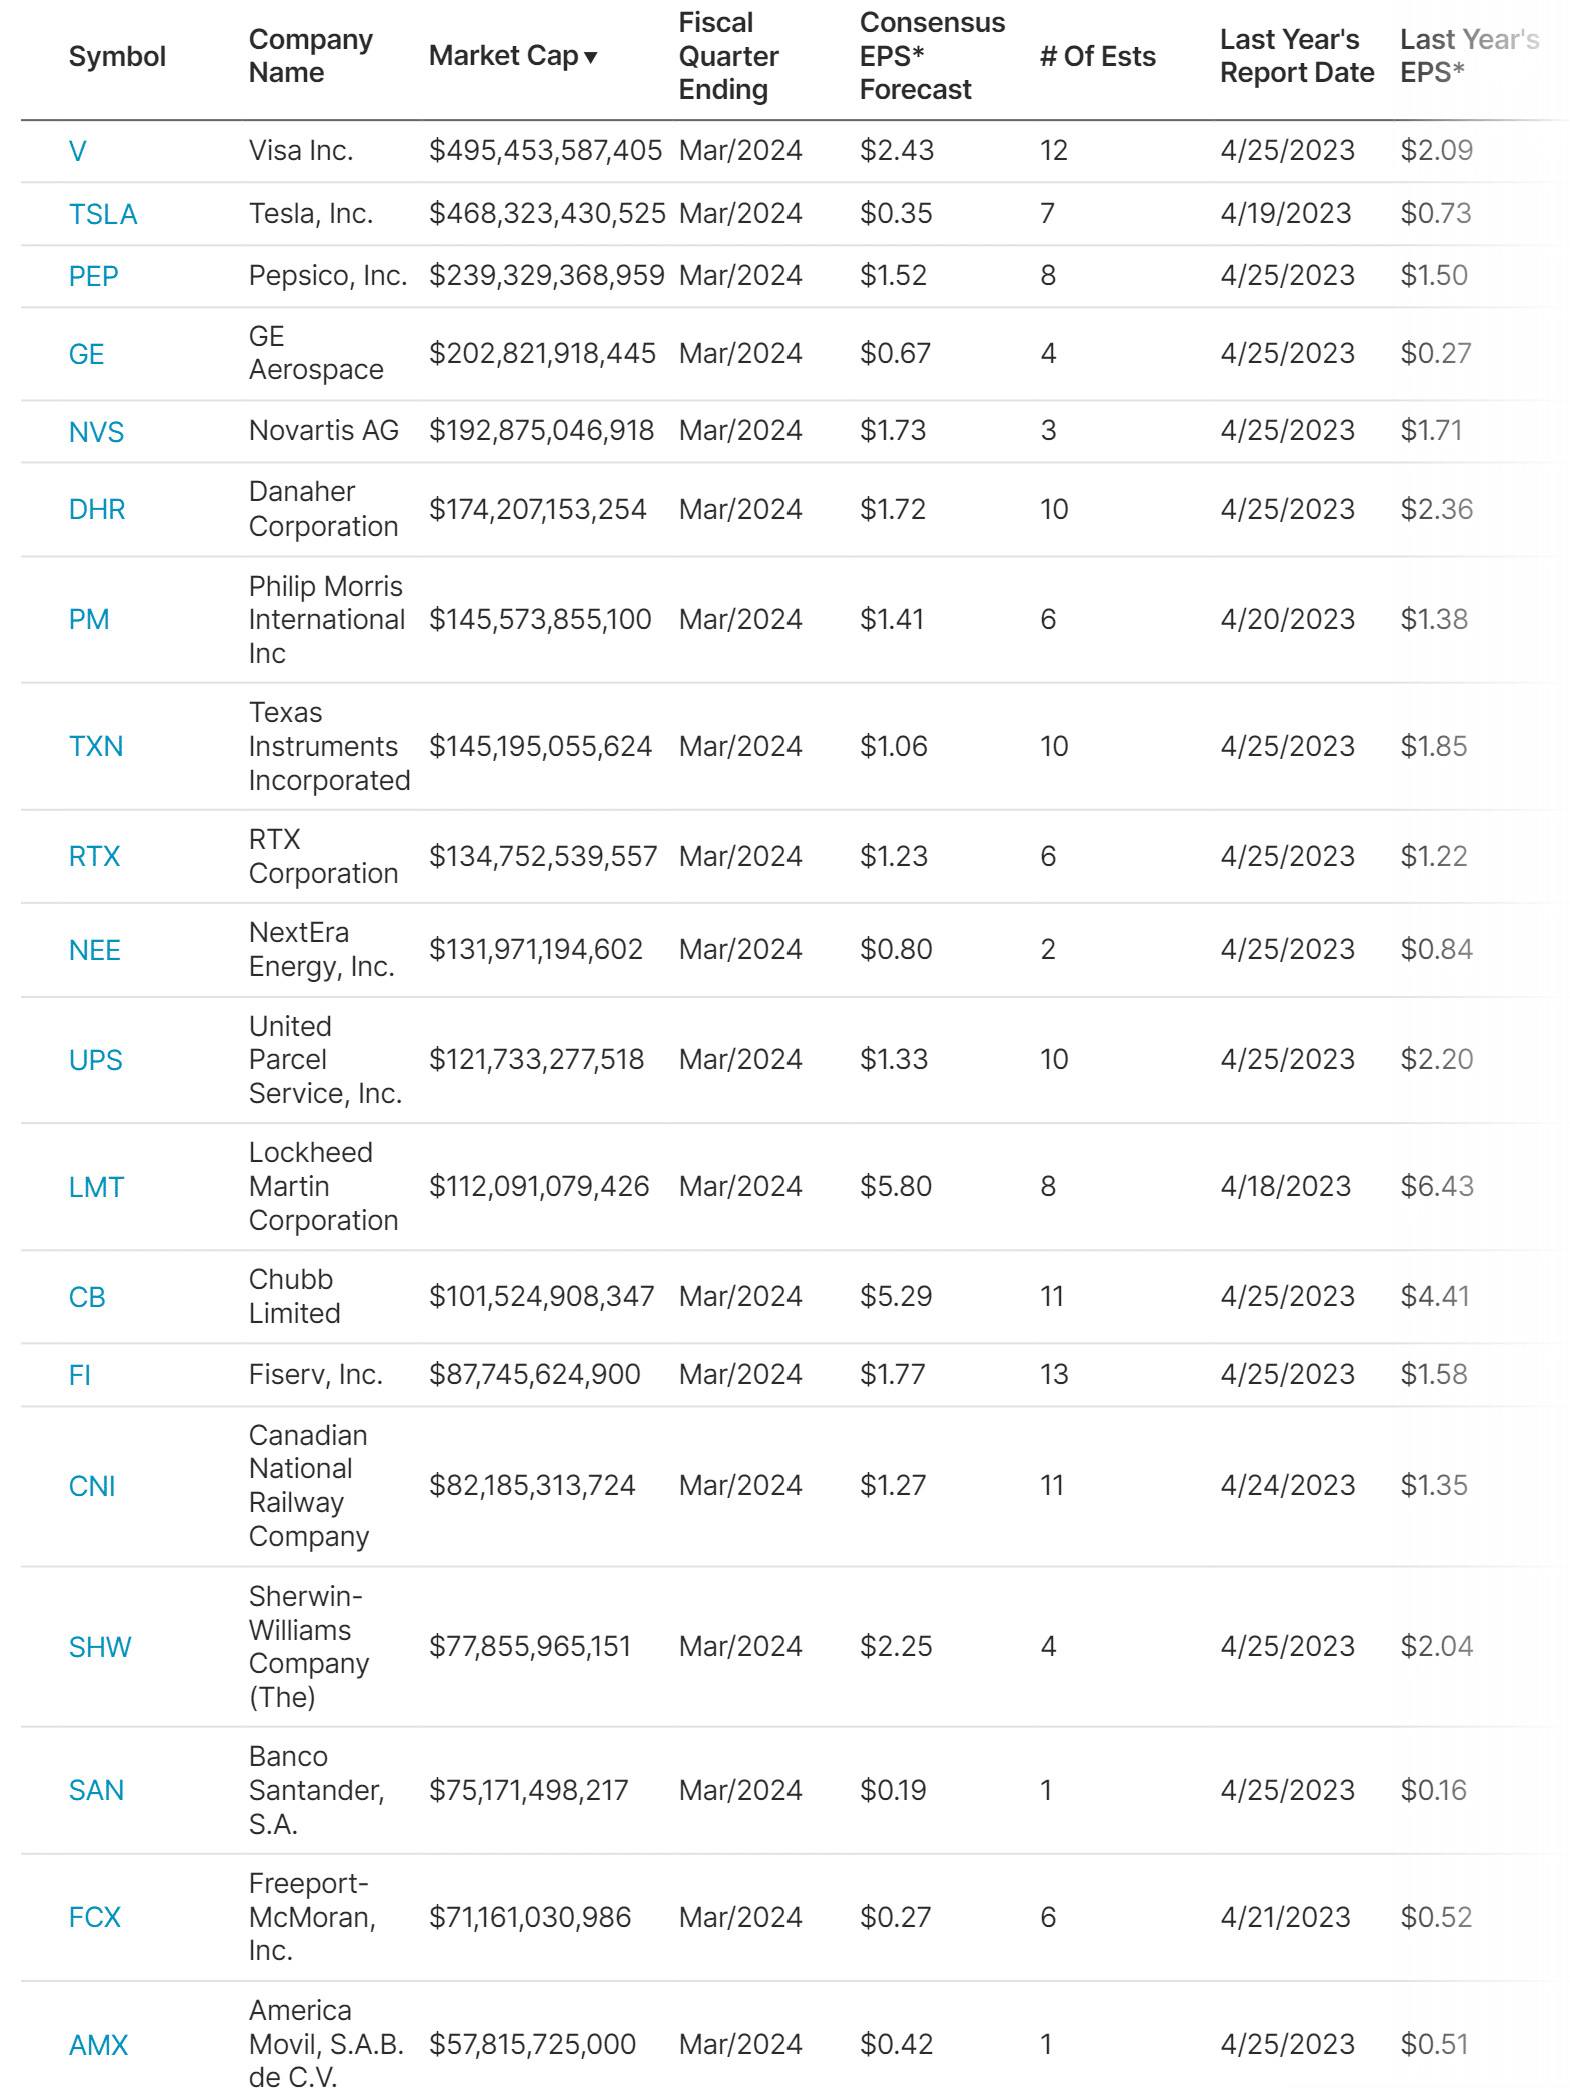
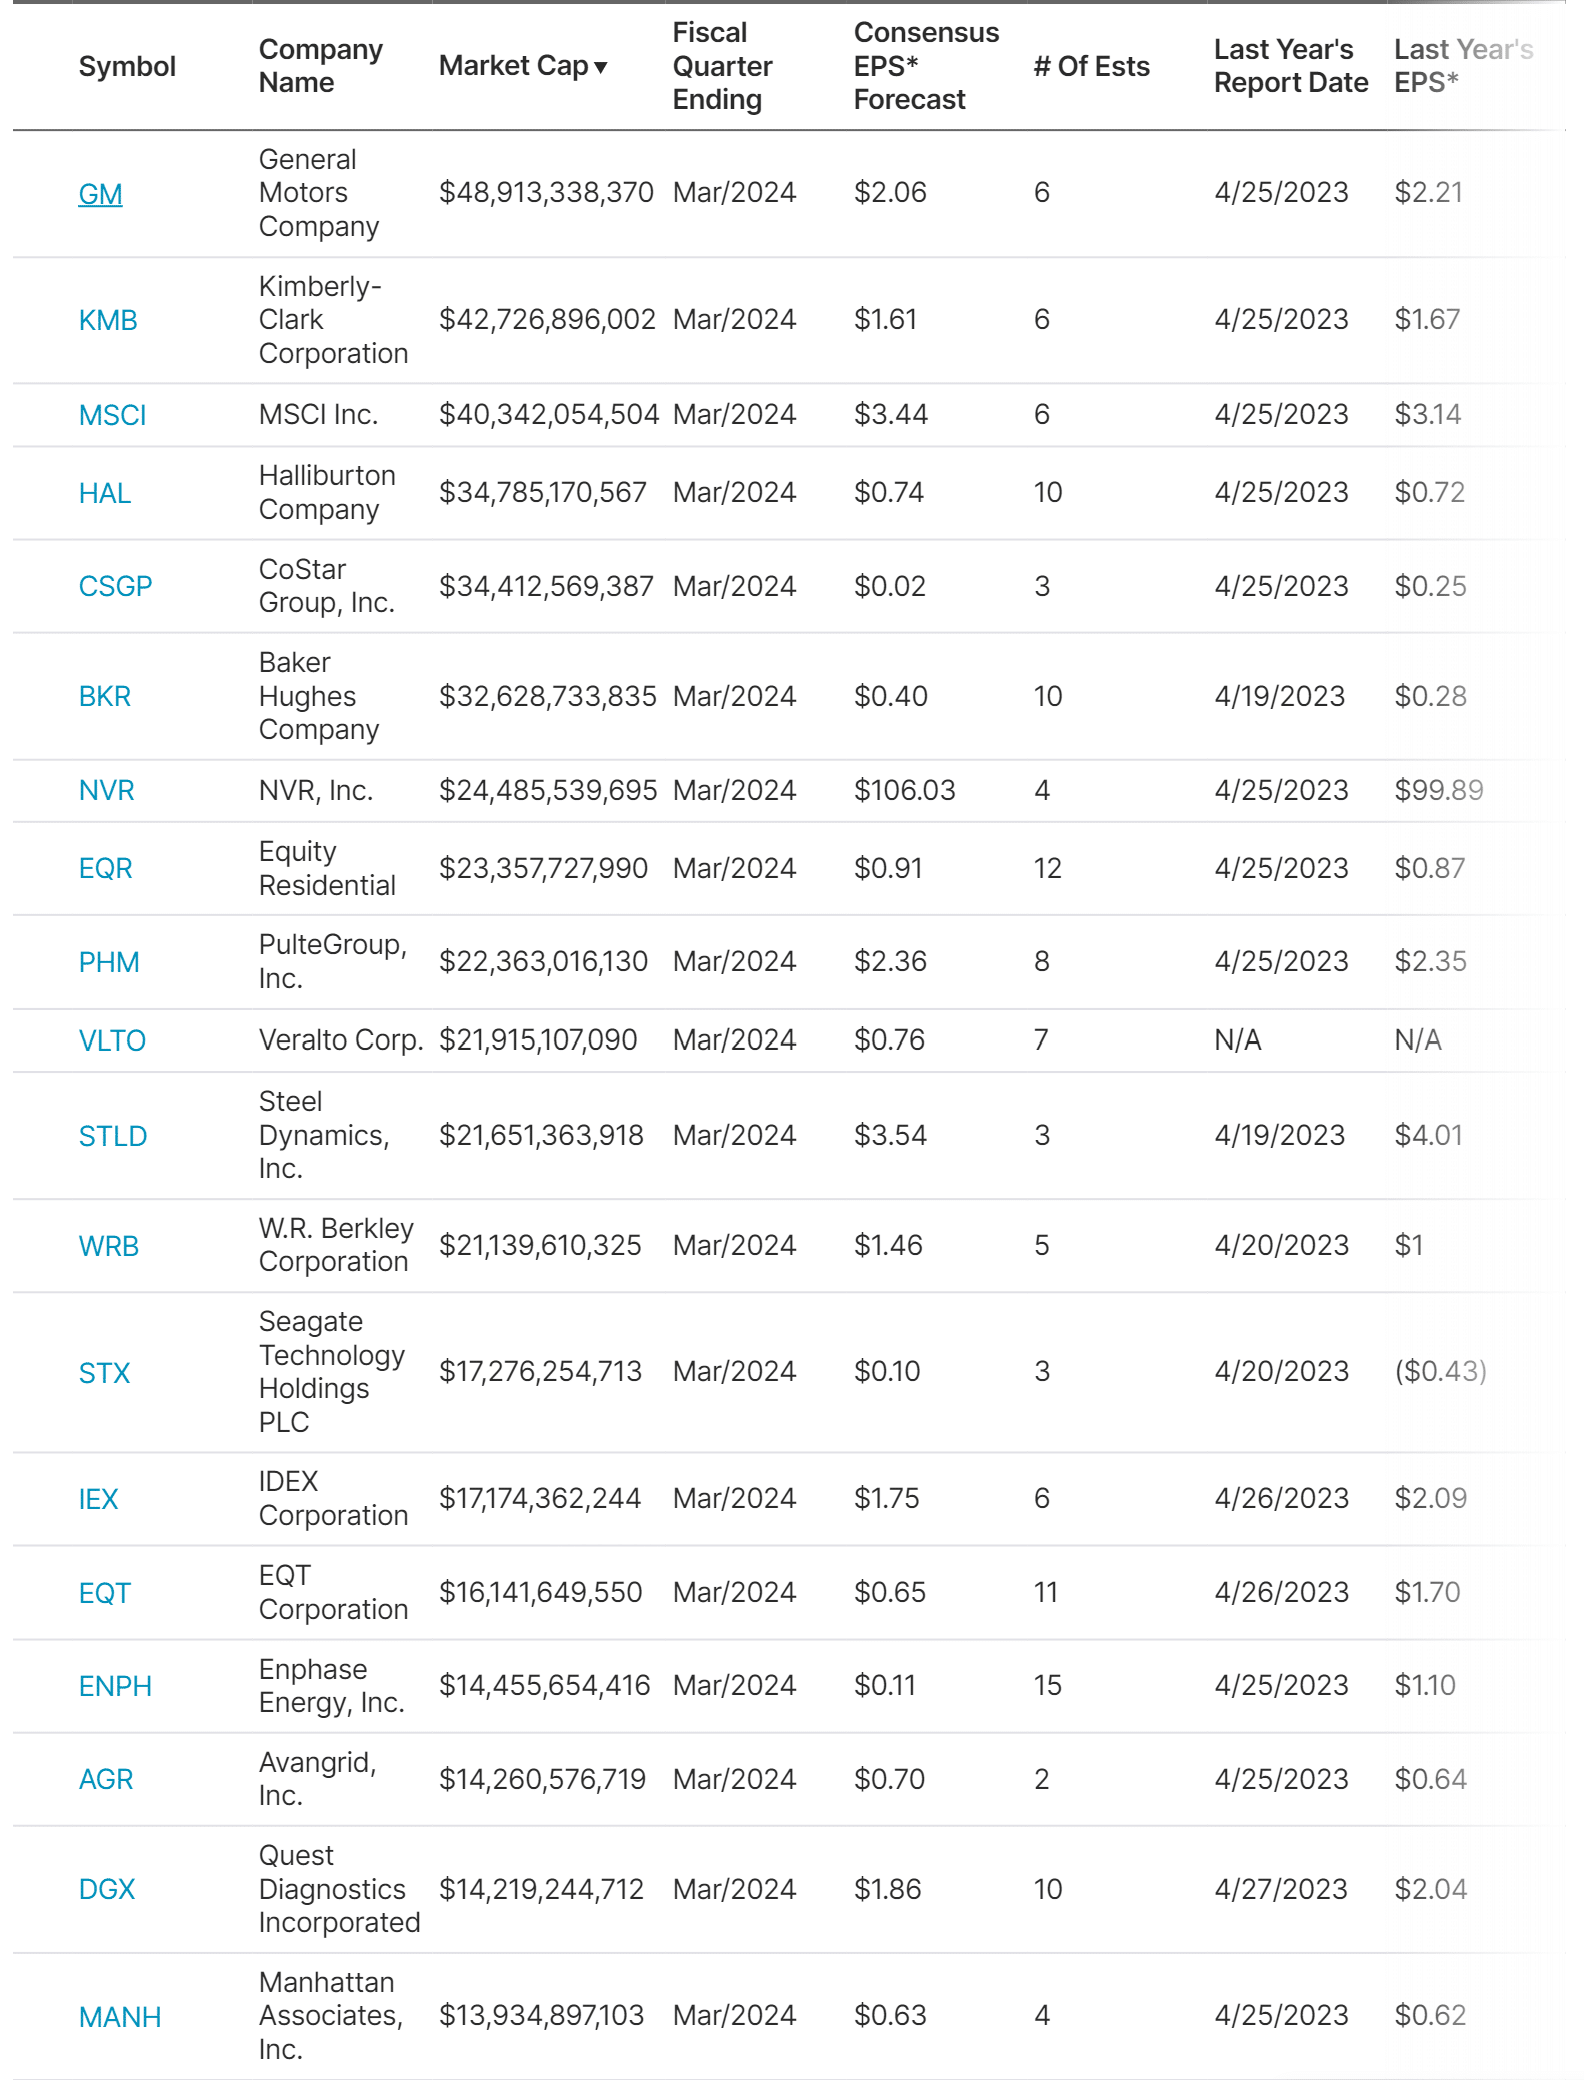
Earnings
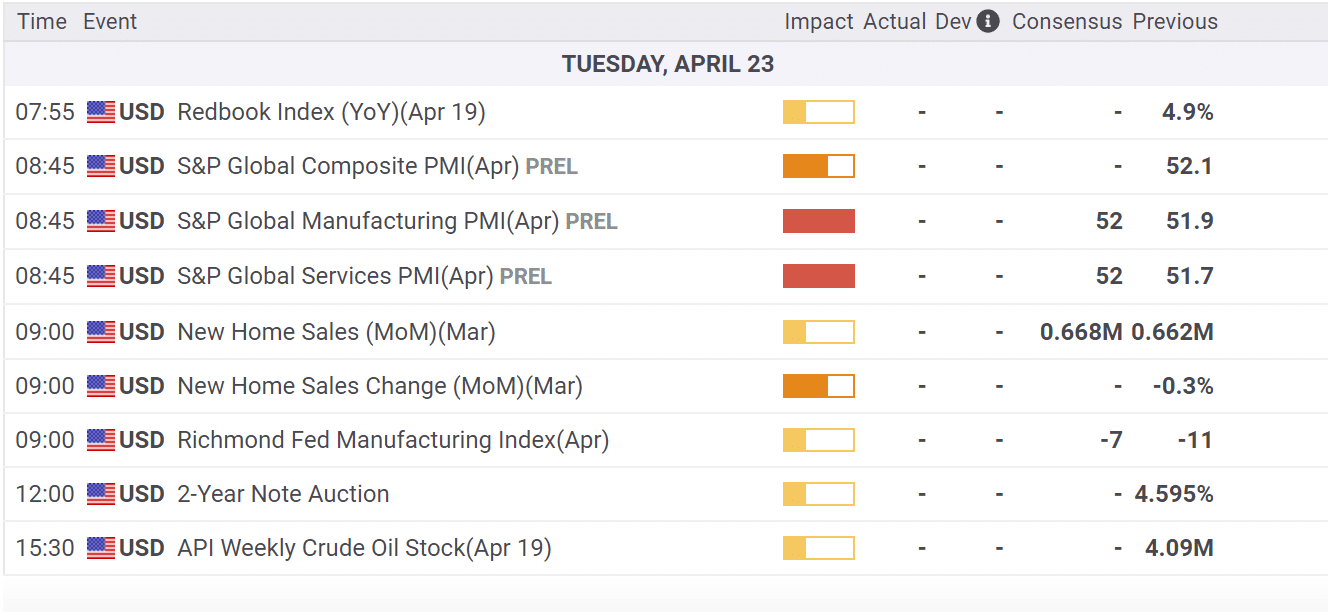
Economy
Market Trading Update
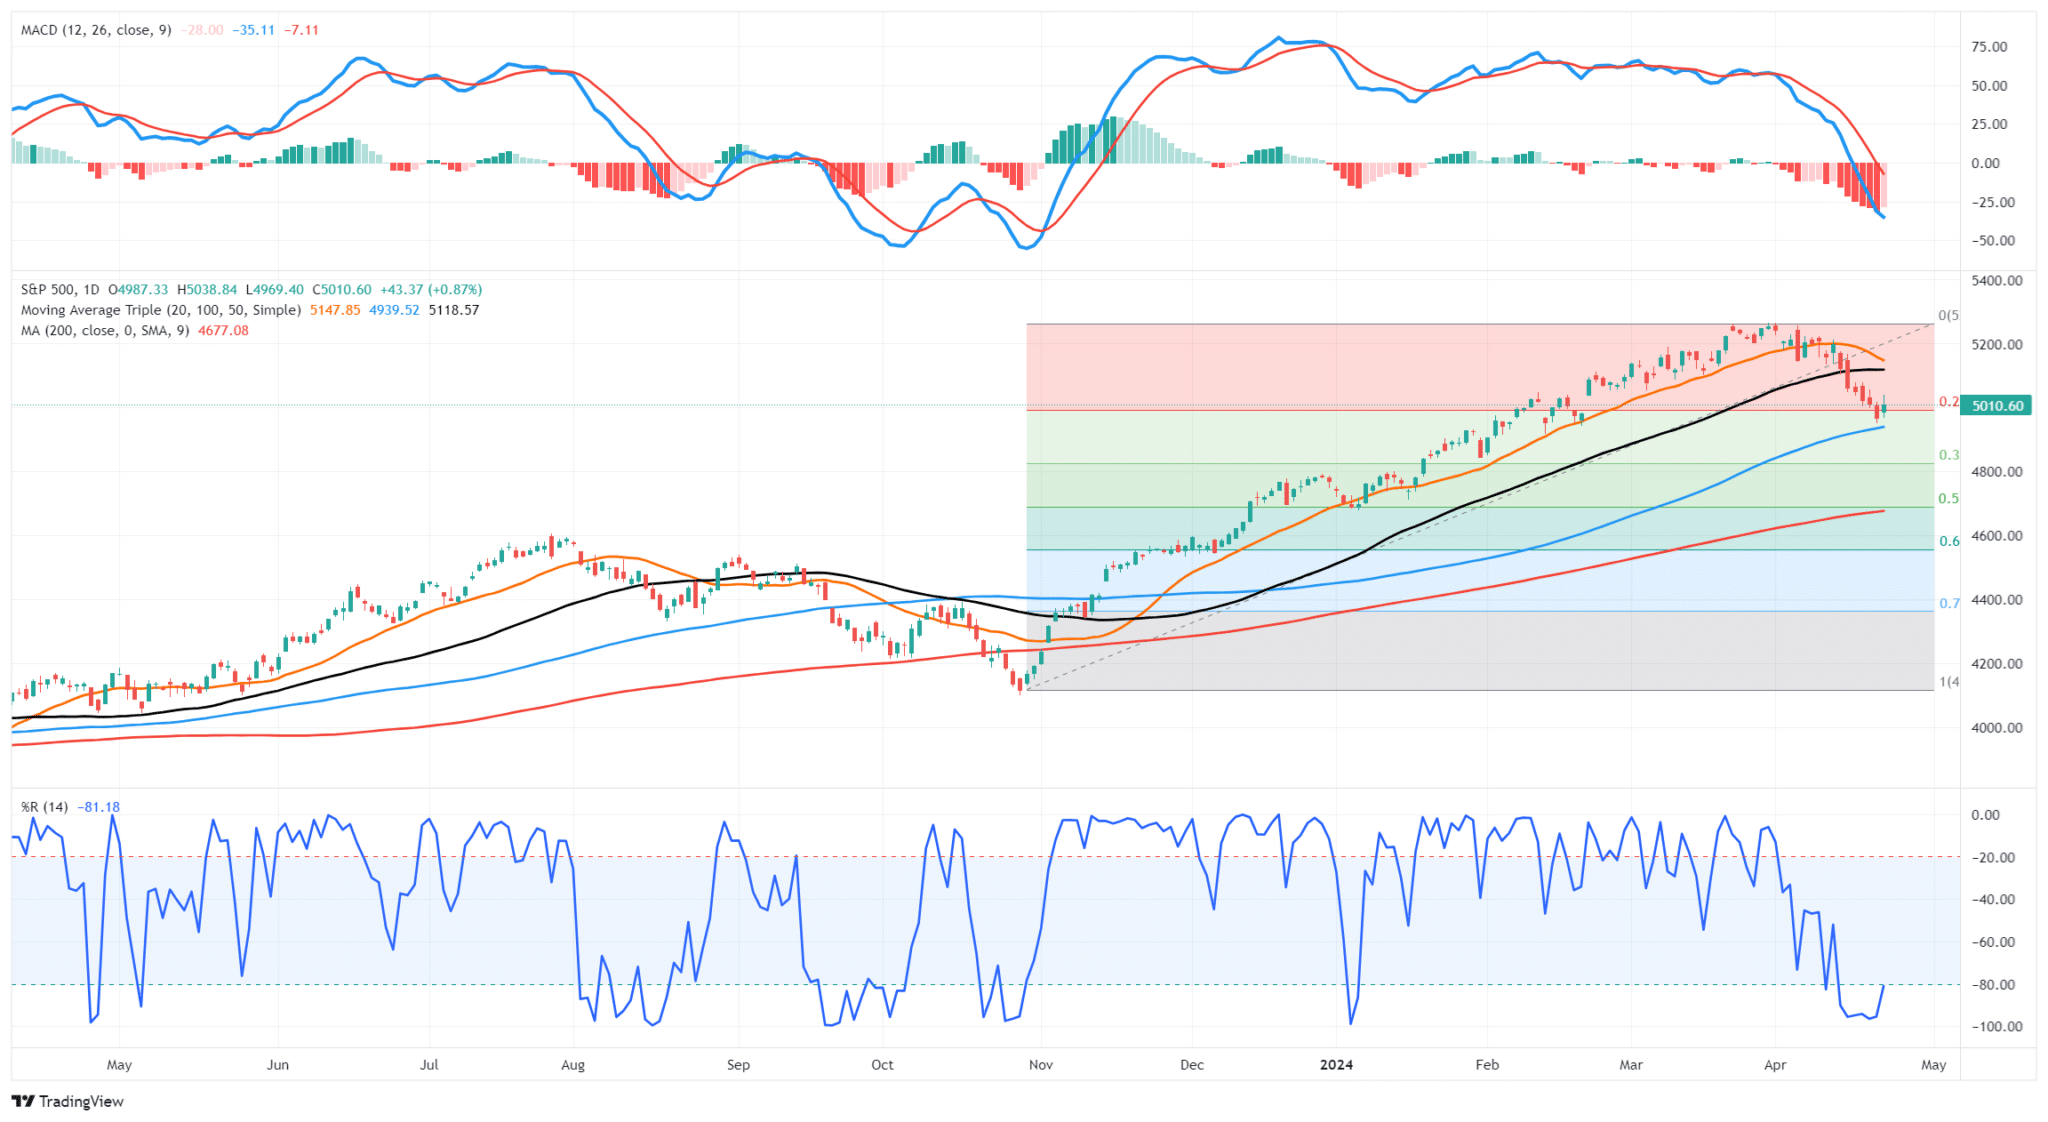
Yesterday, the market tried to rally early but sellers emerged early in the day. However, with the market has been down 6-consecutive days, a decently long stretch by historical standards, the rally into the close was unsurprising. Notably, as bearish sentiment rises, the odds of a decent reflexive rally increases. However, the first rally to resistance, which will likely fail at the 50-DMA will be an opportunity to reduce risk rather than adding exposure.
As noted yesterday, there are many “trapped longs,” that were swept up in the selloff and are now looking for an exit. The market will likely have another decline to retest current lows, or set new lows, before this correction is over. That second low will likely be a better entry point for adding exposure into year-end. As always, there are no guarantees in the market. While we expect another decline to buy into, things can and will change and we will update you accordingly.

The New SimpleVisor
We are thrilled to announce that SimpleVisor has a new look and feel as of Monday. Please let us know if you are a subscriber and have any questions. If you want to try SimpleVisor, give it a shot with a free 30-day trial. We share a little analysis of the utility sector to appreciate its value.
Utilities Are In Charge
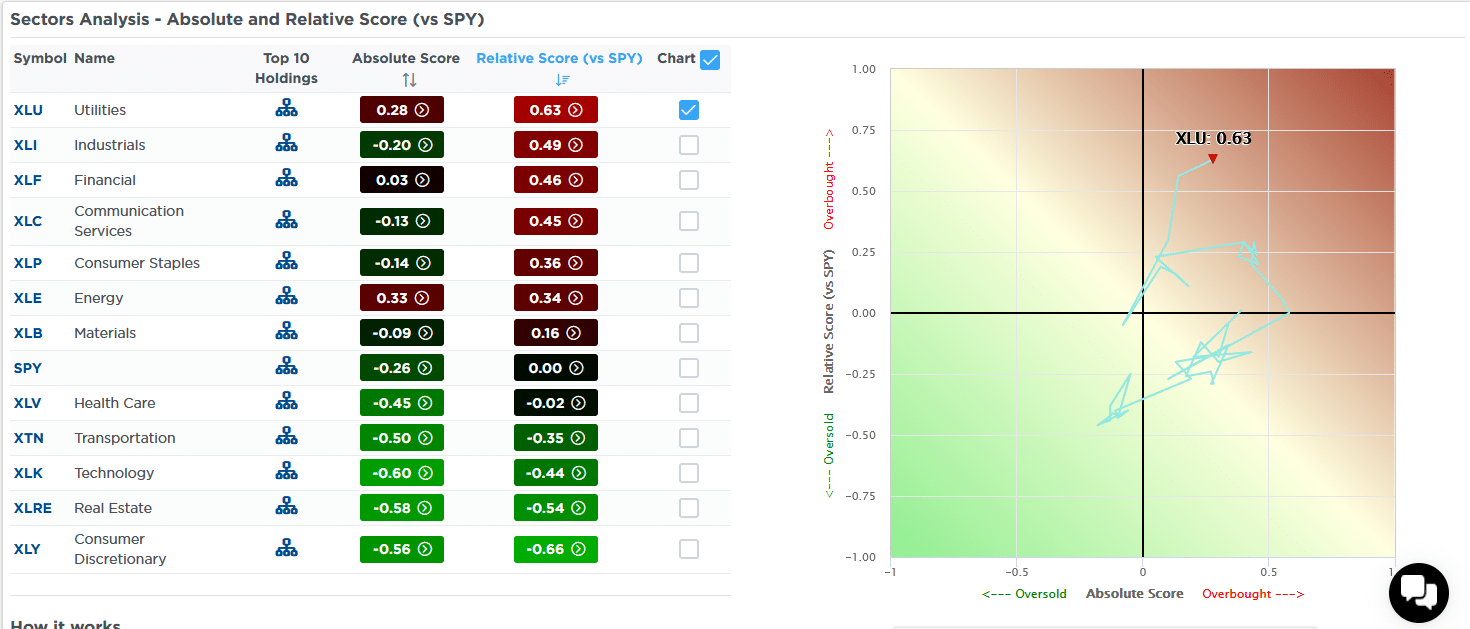
The SimpleVisor proprietary Absolute and Relative analysis uses many technical studies and assigns a relative (versus the S&P 500) and absolute score. We sorted by relative scores below. Note that utilities (XLU) are now the sector with the most overbought score versus the S&P 500 and the second most on an absolute basis, behind the energy sector. The graph on the right charts the daily absolute and relative scores over the last nine months. Accordingly, it went from decently oversold on both measures to overbought territory.
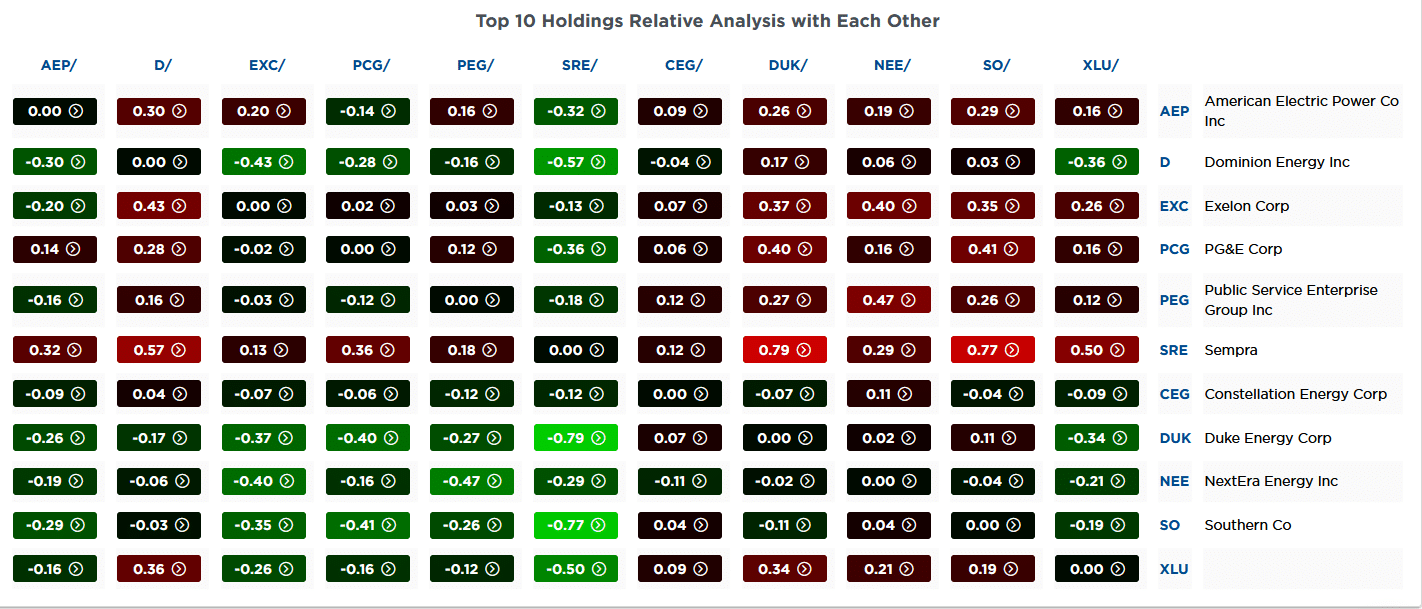
The second graphic breaks the sector down by its top ten holdings and performs a similar analysis. PEG, D, and NEE have the highest relative scores, while DUK and D have the best absolute scores. The third graph provides a relative analysis study using each utility stock against each other. This allows us to see better which utility stocks are leading the way and which are lagging.
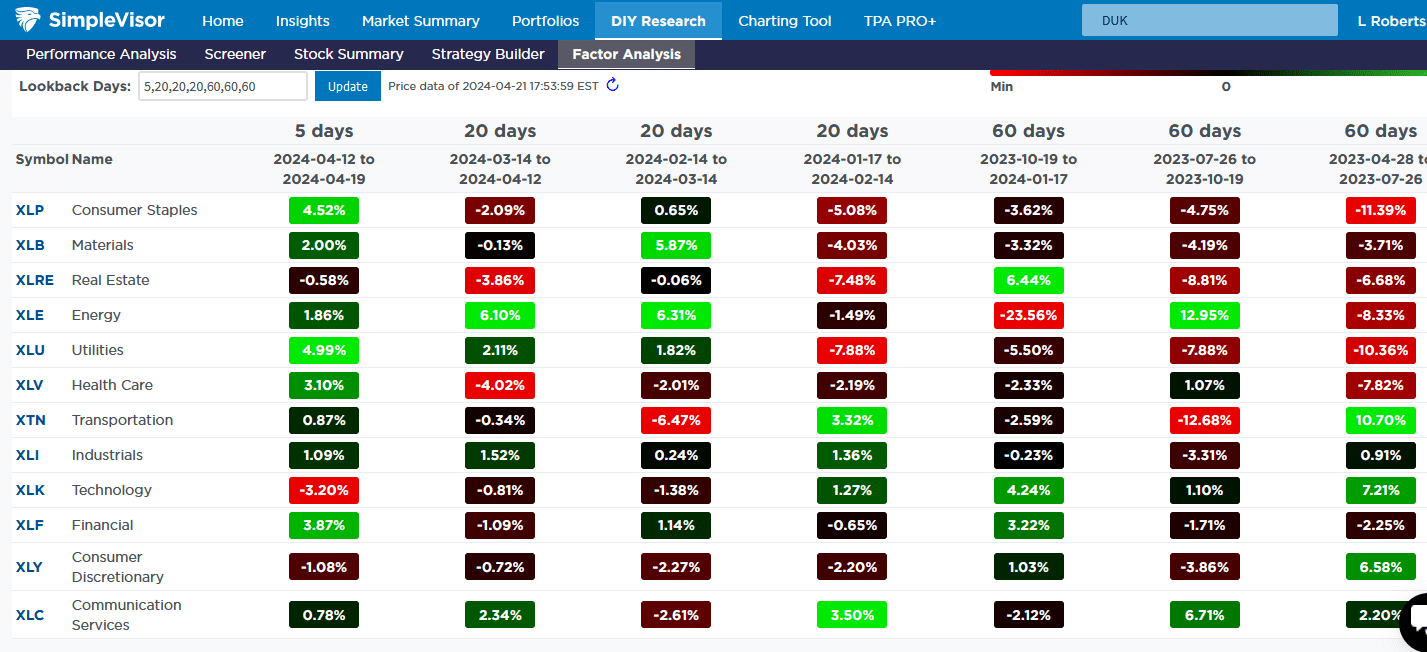
Lastly, the fourth screenshot shows the relative performance of each sector over various time frames going back a year. Over the last five days, utilities gained 4.99% on the S&P 500. While its relative performance has been good for the previous 45 days, it was atrocious from April 2023 through mid-January. The SimpleVisor data show how the market has clearly rotated since January from the mega-cap technology-oriented companies to those stocks left behind. If the market continues to decline, we expect this to continue. However, if this is a consolidation before another rally, it will be interesting to see if megacap stocks lead the way again or if the conservative sectors and factors will continue to lead.

Tesla Continues to Slip
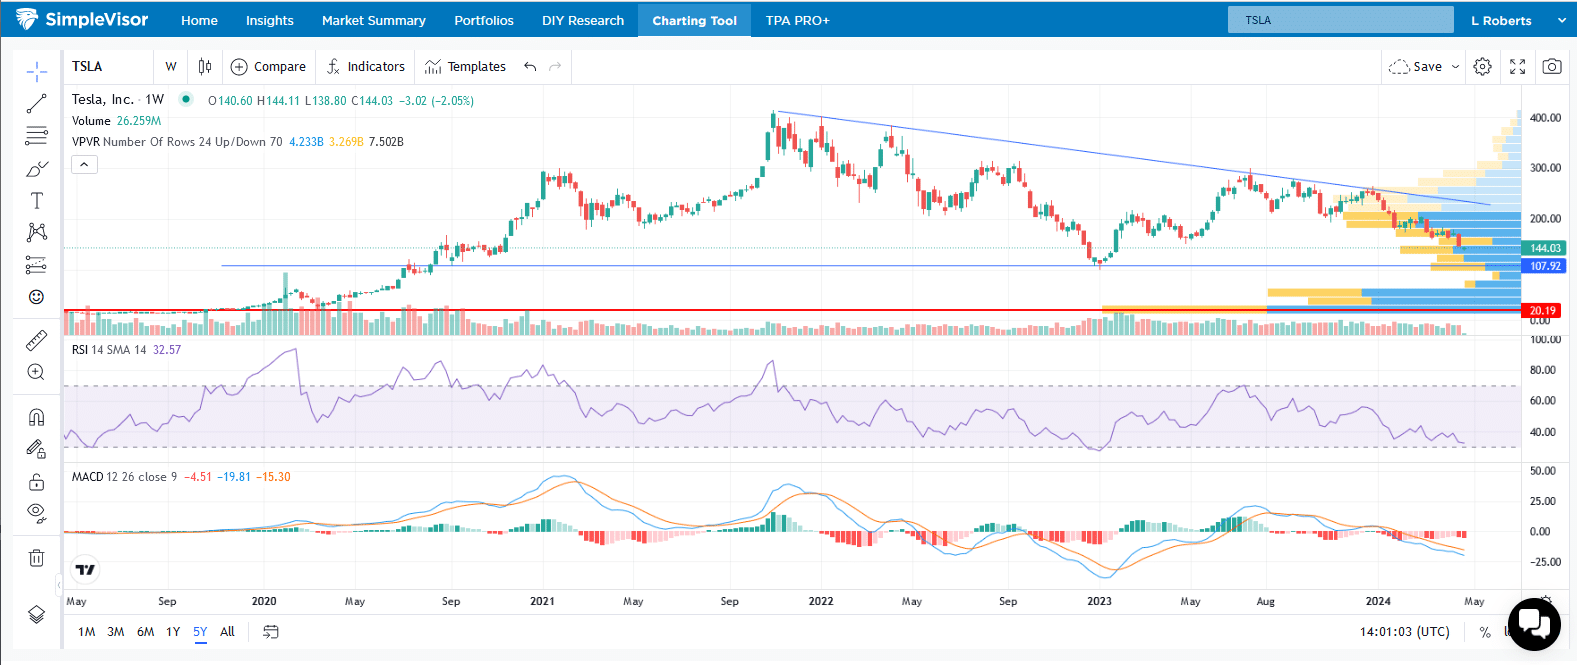
Our Daily Commentary from April 16th and others prior discussed the recent auto industry trend away from EVs. Tesla, like smaller EV makers and lithium producer shares, has been under significant pressure. As we share in the opening graphic, Tesla has been grossly underperforming the market, as well as the other Magnificent Seven stocks. Let’s look at its graph to better assess Tesla from a technical perspective.
For starters, note that the stock has fallen by over 50% since peaking in November 2021. The blue line highlights the downward resistance trend line that has kept a cap on rallies since November 2021. The horizontal bars on the right axis depict the volume occurring at each price interval. As it shows, a majority of buyers bought the stock at $75 or below or between $170 and $260. The stock is trading at $140, meaning that many holders are losing money, while those who bought it at much lower prices still have sizeable gains but are watching them erode. If Tesla continues lower, many trapped longs with losses may give in to their emotions and sell. Further, those with gains may be willing to sell to walk away with profits.
The MACD and RSI below the graph show that the stock is currently oversold, but it can certainly get more oversold. A corrective rally would not be surprising, but there is little indication that a low is in. For those inclined, the blue horizontal line at $108 may be a good place to start nibbling on Tesla shares.
Tweet of the Day
“Want to achieve better long-term success in managing your portfolio? Here are our 15-trading rules for managing market risks.”
Please subscribe to the daily commentary to receive these updates every morning before the opening bell.
If you found this blog useful, please send it to someone else, share it on social media, or contact us to set up a meeting.
Also Read


