


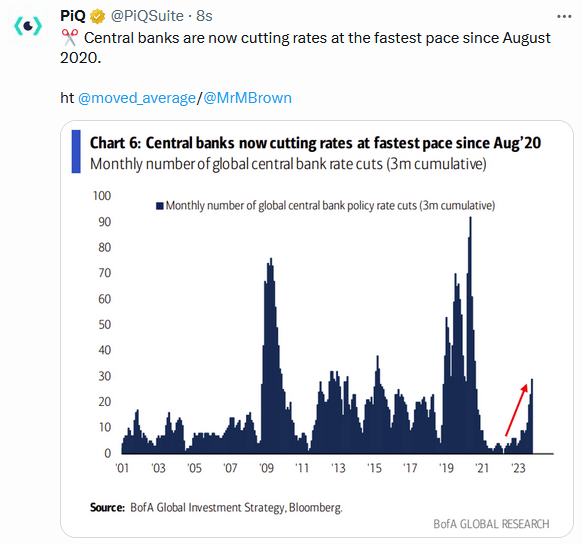
From mid-July through September, the U.S. dollar rose steadily. Over the period, the dollar’s value versus a basket of global currencies rose by 7%. Supporting the rally was a very hawkish Fed willing to keep raising rates. Equally important, other central banks were starting to back away from their inflation-fighting, hawkish policies. As we show in today’s Tweet of the Day, central banks worldwide are now cutting rates at the fastest pace since 2020. In like manner, the Fed’s tone has become a little less hawkish. Many Fed members, including Jerome Powell, now believe that higher long-term interest rates will weigh on the economy and inflation, leaving the Fed likely to pause rate hikes.
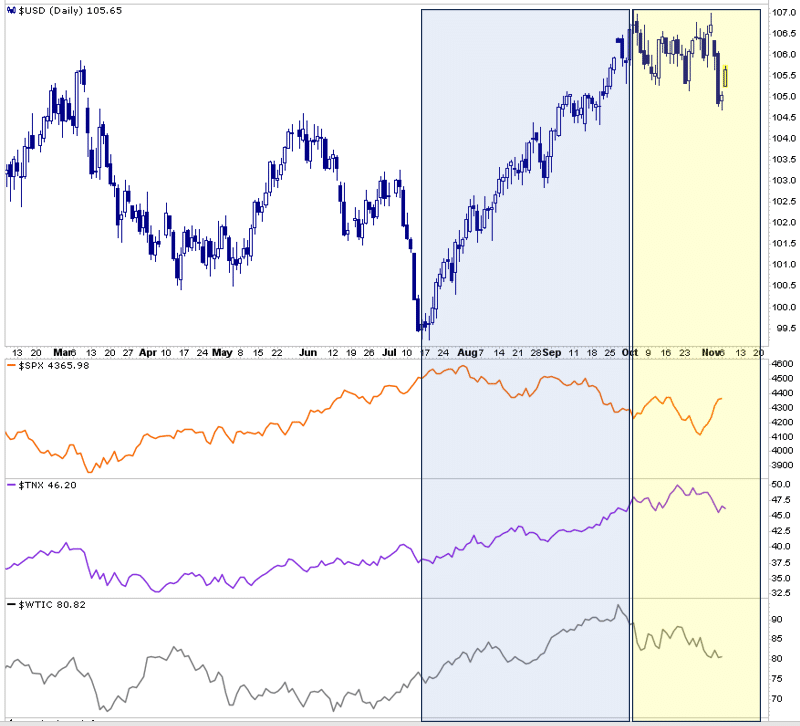
Frequently, asset classes take their cue from the dollar. Such makes sense as the dollar is the world’s reserve currency. Accordingly, a majority of trade and capital flows around the world are highly dependent on the dollar value. The graph below highlights the recent strong rally of the dollar in blue and the consolidation starting in October (yellow). The graph below the dollar shows that since October, the stock market, after declining with the dollar strength, has gained slightly and appears to be regaining its bullish footing. After steadily rising with the dollar, bond yields have been somewhat lower since the dollar consolidation. Lastly, crude oil has tracked dollar strength and recent weakness closely. Technically, the dollar is consolidating. Therefore, any break lower or a resumption of the upward trend will likely impact the assets shown below.
What To Watch Today
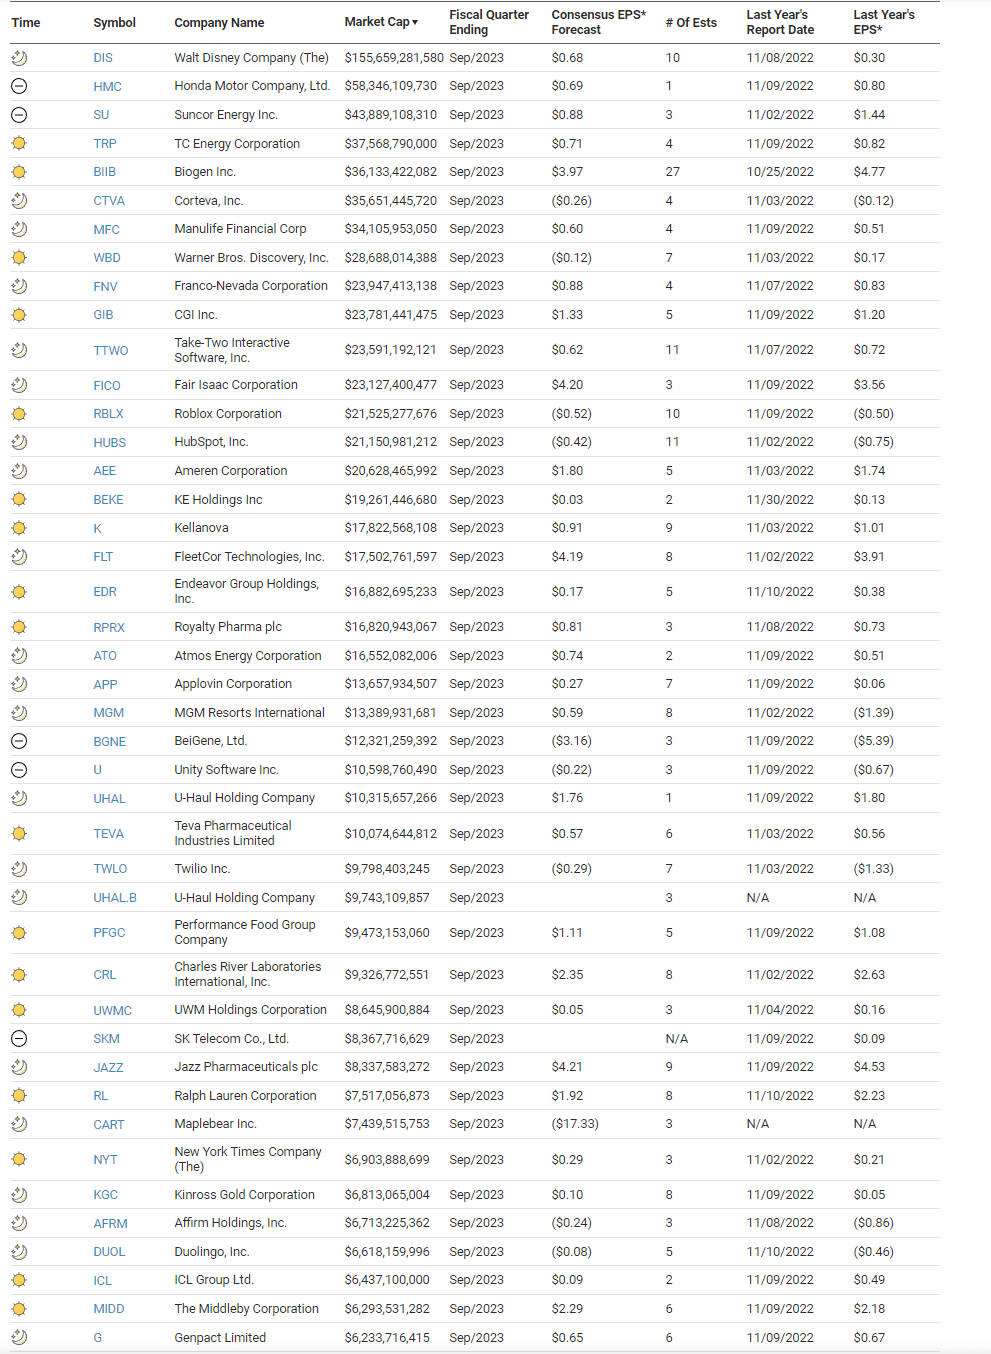
Earnings
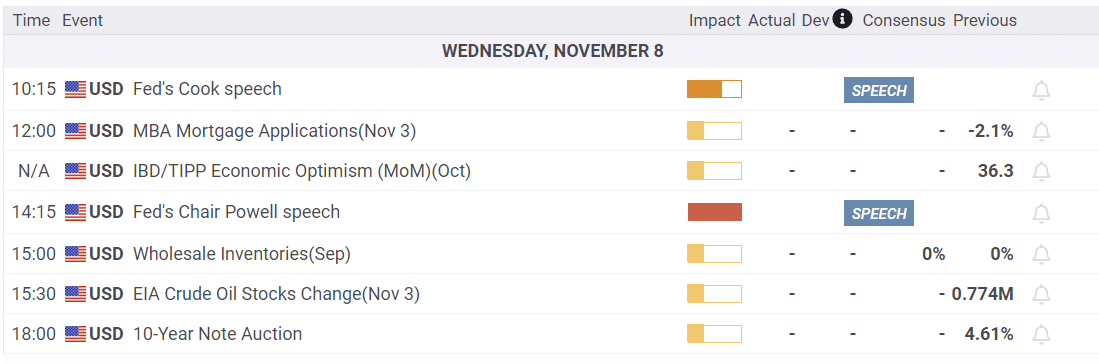
Economy
Market Trading Update
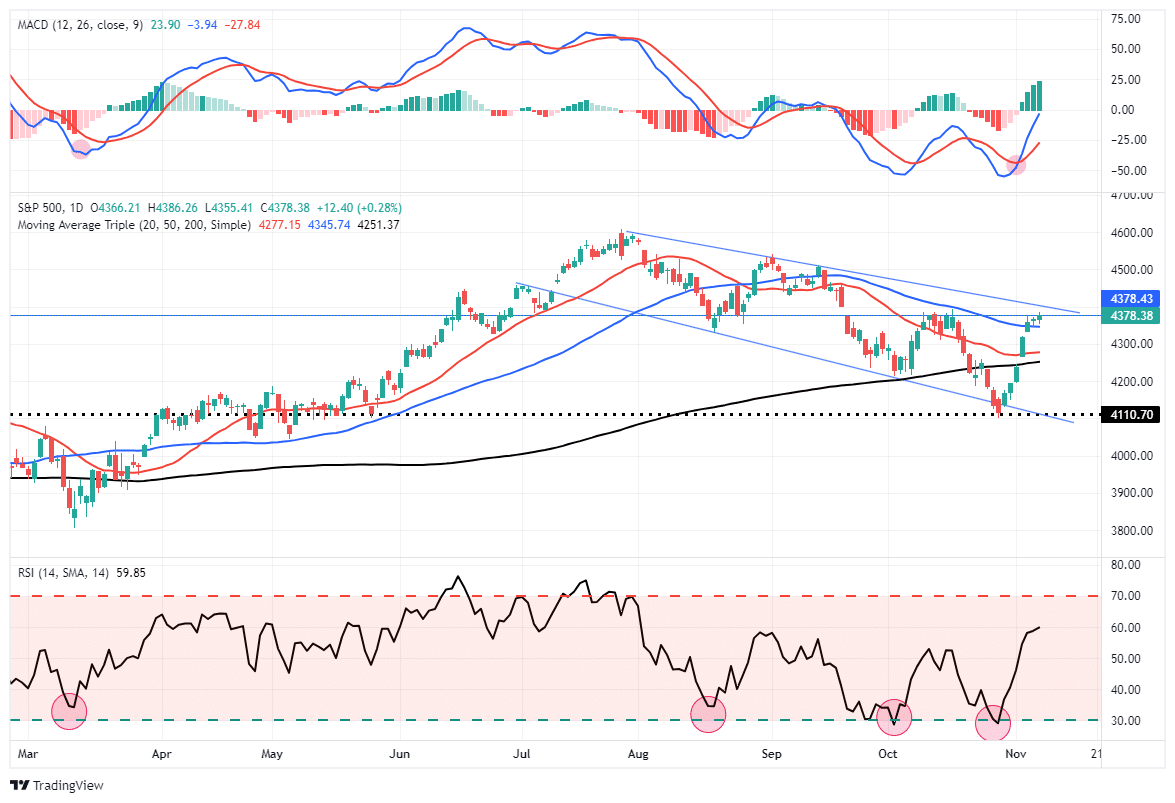
After breaking above the 200-and 50-DMA, the bullish tone has returned to the market. The MACD “buy signal” is firmly intact, with plenty of room to move higher soon. The RSI is getting more overbought short-term, which suggests this market may start to see some profit-taking over the next couple of days. As long as the market can hold the 50-DMA for now, the most likely trend is higher. However, the downtrend channel from the July peak remains a formidable challenge in the short term. A break above that channel will suggest a retest of those previous highs as probable. For now, continue to rebalance portfolio risks as needed.

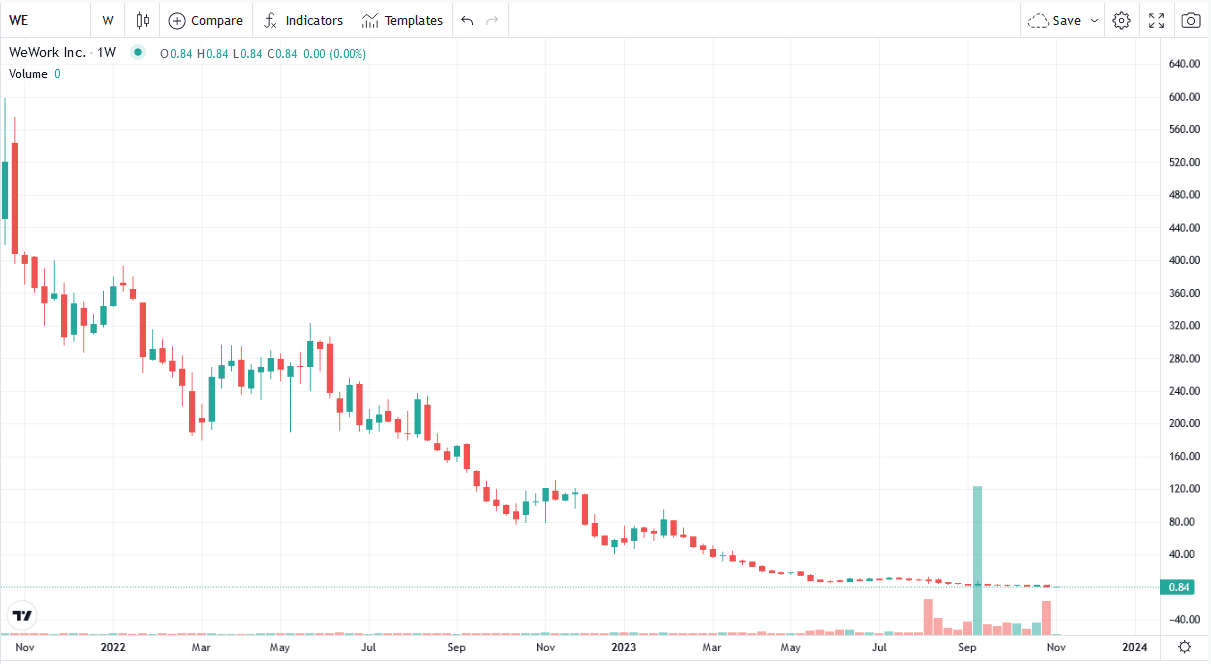
WeWork Goes WeBroke
Shares in WeWork rose to $600 after its IPO in the fall of 2021. Now, only two years later, WeWork trades for pennies and filed for bankruptcy with a reported $50 billion of debts. The bankruptcy filing was widely expected. In 2019, SoftBank valued the company at $47 billion. At its IPO in 2021, troubles were already mounting as its valuation had fallen to under $10 billion. WeWork fell victim to poor management and the pandemic. Post-pandemic, there is a glut of office space on the market, which reduces rents and increases vacancies. The company has approximately 19 million square feet of office space in the United States and nearly 50 million square feet in total. Consequently, due to its bankruptcy, it’s likely much of this space will come back on the market and add to the problems in the office building market.
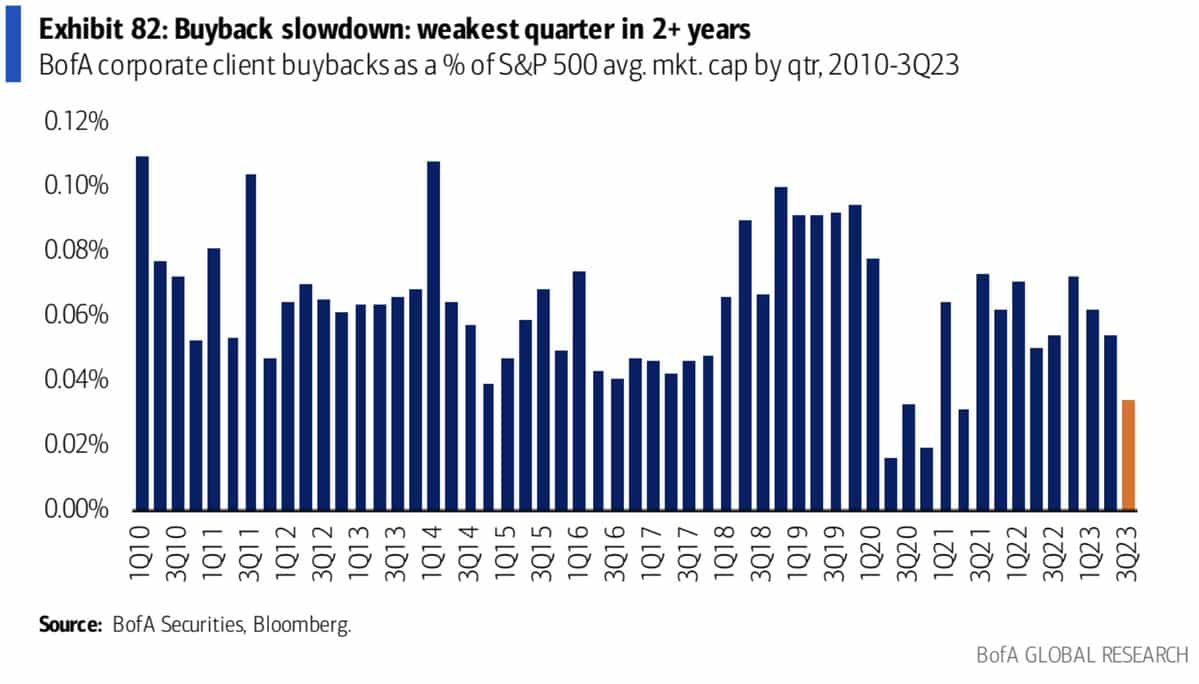
Stock Buybacks Are Slowing
As the BofA graph below shows, stock buybacks last quarter, as a percentage of market caps, were the lowest since the onset of the pandemic. Prior to that, it was the lowest quarterly amount since at least 2010. Why? Because many companies issued cheap debt to buy back their shares. But with interest rates sharply higher, the leveraged buyback trade doesn’t make much sense. Buybacks were an important factor driving stock prices higher. The longer interest rates stay high, the less this factor will contribute to stock returns.
The Fed’s Coming Dilemma
Our recent article, ‘Bond Bear Market. Is It Dead, Or Just Hibernating?’ discusses the critical factors driving the recent bond bear market to help better assess if a new bull market has started or if the bear market will reassert itself. In the article, Lance brings up an important factor that has partially driven the recent decline in yields. To wit:
In recent speeches from Federal Reserve officials and Jerome Powell himself, they specifically noted that higher yields on Treasury Bonds are acting as “defacto rate hikes.” Such is why they have “paused” on further rate hikes despite inflation still above their 2% target.
However, falling yields and rising stock prices undermine that objective by loosening financial conditions.
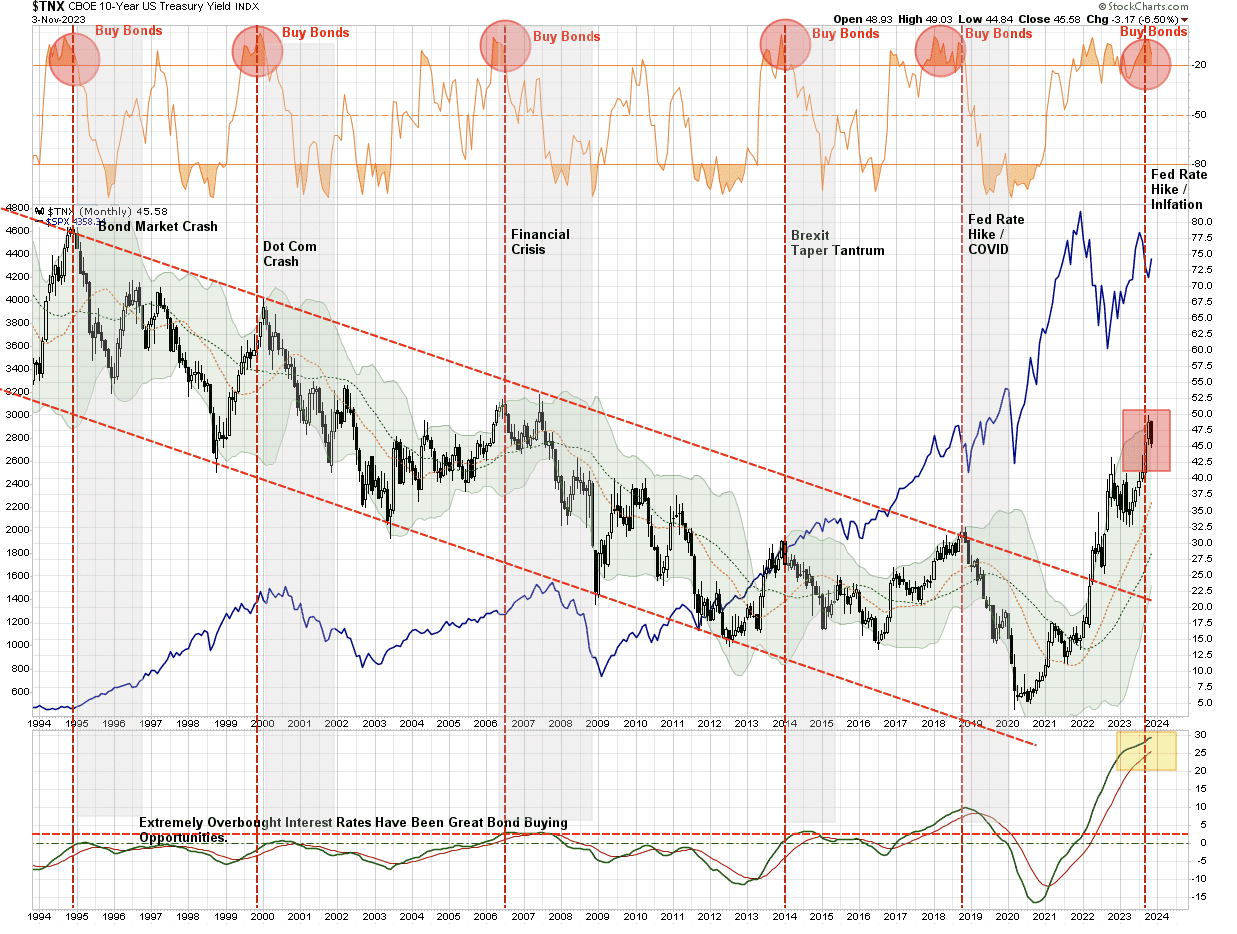
To reiterate his last point: If the Fed’s backing down from higher for longer continues to drive yields lower and stocks higher, they may have set a trap for themselves. Lower interest rates and stock market optimism may spur economic activity and rekindle higher inflation. This would force them to raise rates, to the chagrin of the stock and bond markets. He ends the article: “However, I believe that Treasury bonds will be the asset class of choice.” The graph below from the article shows that, technically, bond yields are grossly overbought, meaning bond prices are likely to rise appreciably.
Tweet of the Day
Please subscribe to the daily commentary to receive these updates every morning before the opening bell.
If you found this blog useful, please send it to someone else, share it on social media, or contact us to set up a meeting.
Also Read


