This commentary did not get emailed out yesterday, please accept our apologies. The data has been updated for this mornings reading.
Michael Burry, who made a fortune shorting the subprime market in 2008, and was made popular in Michael Lewis’s book and movie The Big Short, is at it again. The quarterly SEC 13-F holdings report for Bury’s $1.7 billion hedge fund shows that he is short approximately $1.6 billion of the S&P 500 (SPY) and Nasdaq (QQQ). Given his track record, as glorified in The Big Short, the media headlines quickly shared his seemingly massive bearish $1.6 billion trades. We presume quite a few investors may be second-guessing their equity positioning. If you are in this camp, take a step back and let us explain what he did.
To try to quantify Burry’s latest “big short,” we provide a few possibilities for what he bought and their costs. We do not know the exact options he purchased. However, our estimate below likely does a good job of approximating the cost. Assuming Burry bought the most expensive options of those listed below, providing protection for a 1-2% decline through November, his total cost would be $42,100,000. Bury’s “big short” comes at a relatively minimal cost of approximately 2.5% of the value of his portfolio. While the nominal value of the options, $1.6 billion, sounds huge, his real risk pales in comparison to his 2008 subprime bets.

What To Watch Today
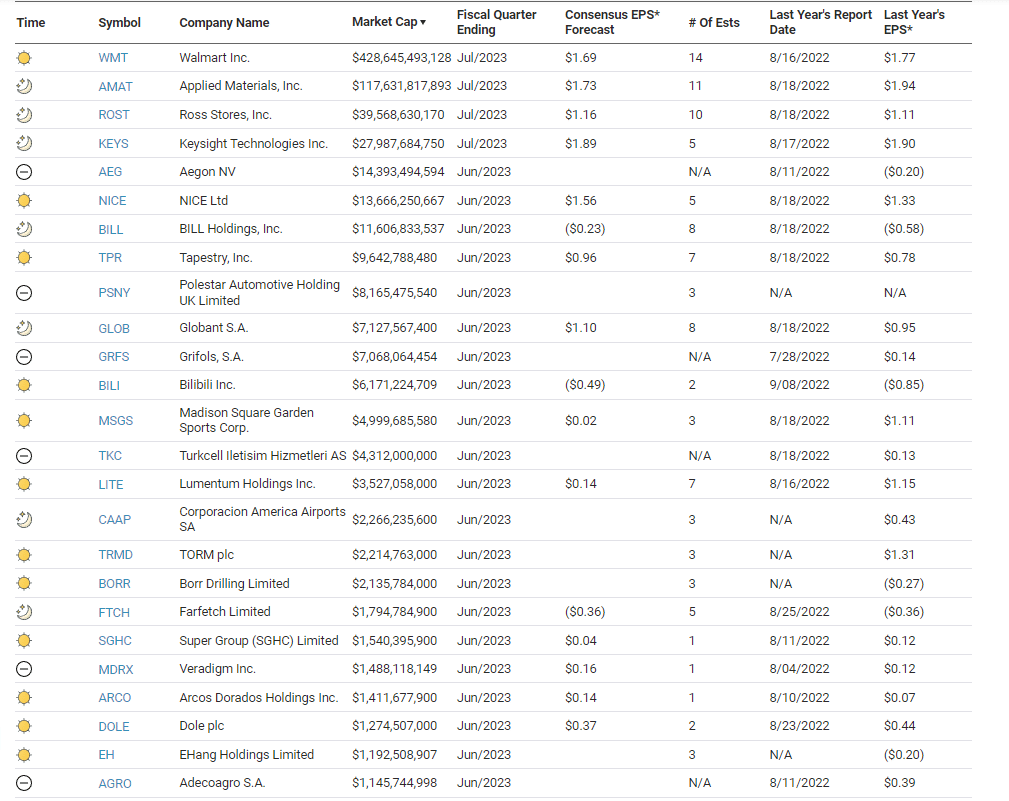
Earnings
Economics

Market Trading Update
Given the short-term oversold condition, the initial rally off the 50-DMA on Monday was unsurprising. However, Tuesday’s stronger-than-expected retail sales data ignited concerns that the Federal Reserve may have to continue hiking rates to keep inflation under control. On Wednesday, the FOMC minutes further confirmed fears the Fed may remain hawkish much longer than expected. Those worries pushed the market through the 50-DMA decisively, which now sets up the next test for the bull market.
So far, the sell-off remains orderly, and there is no reason to be overly concerned about the current correction. However, if the market cannot regain the 50-DMA by the week’s end, the next logical support level with be the 100-DMA. As we had discussed for several weeks heading into the market peak, the correction was, and remains, both expected and normal, given the runup earlier this year. We continue looking for opportunities to rebalance and increase equity exposure accordingly.


Retail Sales Are Hot
The latest retail sales report came in stronger than expected, leaving little doubt that the economy continues to remain robust. Monthly retail sales rose by +0.7% for July, better than the +0.4% estimate and the highest monthly growth rate since January. Excluding food and energy, it grew at its fastest pace since February 2022. The control group, which is used in the GDP calculation, was up 1% versus double estimates of +0.5%.
The latest Atlanta Fed’s GDPNow estimate of Q3 GDP growth is now over 4%. Interestingly, despite relatively robust economic data and higher oil prices, the Fed Funds futures market implies an 11% chance the Fed will hike rates at the next meeting. Those odds actually fell slightly from earlier in the week. We suspect Wall Street economists will up their Q3 GDP forecasts in the coming weeks.

The Empire Manufacturing Survey is Cold
In contrast to the strong Retail Sales report, the New York Fed’s August Empire Manufacturing Index was sharply lower at -19 versus estimates of -1. It was +1.1 in July. New orders sank to -19.9, shipments fell to -12.3, and the workweek dropped to -10.7. Employment is now back in contraction territory. While the survey respondents are sour on current conditions, their outlook continues to improve. As shown below, future business expectations are at their highest level in a year. As we have noted, the manufacturing sector has been in a recession for the better part of the year. However, economic activity and employment in the service sector have been more than offsetting the manufacturing sector, resulting in a relatively strong GDP.

Tweet of the Day

Please subscribe to the daily commentary to receive these updates every morning before the opening bell.
If you found this blog useful, please send it to someone else, share it on social media, or contact us to set up a meeting.
Also Read