Market rises as the economy reopens.
The question, however, is what happens next? While there has been much debate from the economic perspective, the market has risen in anticipation of the event. Is it an “all clear,” for the bulls, or are there still longer-term concerns.
To analyze what potentially happens next, let’s review where we left off.
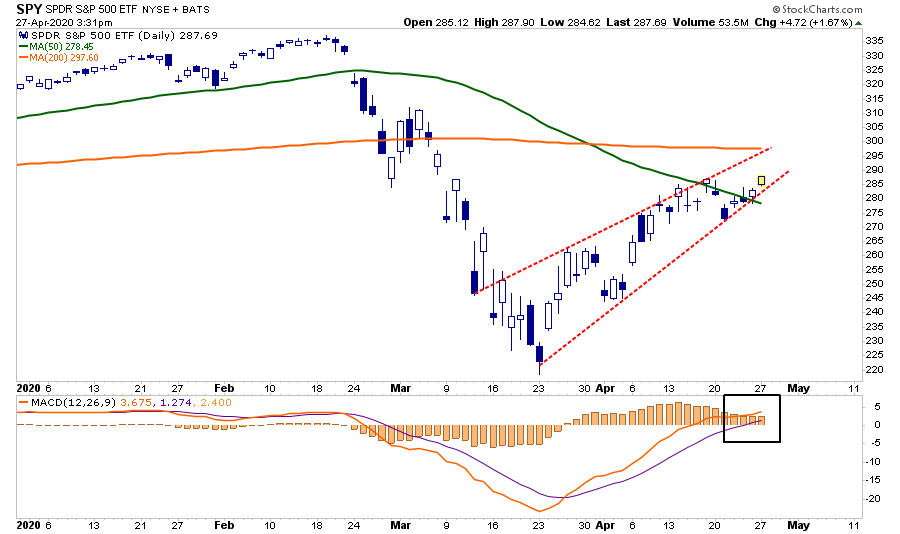
“On a very short-term basis, the previous ‘deep oversold’ condition that provided the ‘fuel’ for the rally has been reversed. Also, all primary ‘overbought/sold’ indicators are now fully extended into overbought territory.”

“If the markets can rally more on Monday and break above the downtrend, the 61.8% retracement level becomes a viable target. Above that resides the 200-day moving average. Both levels are going to provide formidable resistance to a move higher.”
Yesterday, the market did break out of that range, and moved higher, keeping the rally intact for now. However, that does not mean investors are “free from risk.”

Here Comes May
As Stocktrader’s Almanac recently noted, we are rapidly approaching that time of year where spring ends, summer begins, and stock markets have typically struggled.
“As of Friday’s close, the DJIA is now up 7.3% so far this April, which is a retreat of 0.1% since last Thursday. S&P 500 is also 0.1% lower now than one week ago at 8.2%. Thus no progress has been made at returning the current ‘Best Six Months’ to positive territory.”
“The rally has stalled out this past week, and the MACD is still positive but is now trending toward a negative crossover. Continue to hold long positions associated with DJIA’s and S&P 500’s ‘Best Six Months.’
We will issue our Seasonal MACD Sell signal when corresponding MACD Sell indicators applied to DJIA and S&P 500 both crossover.“

While not every “summer period” is a negative, the long-term history of investing during summer months is not stellar.
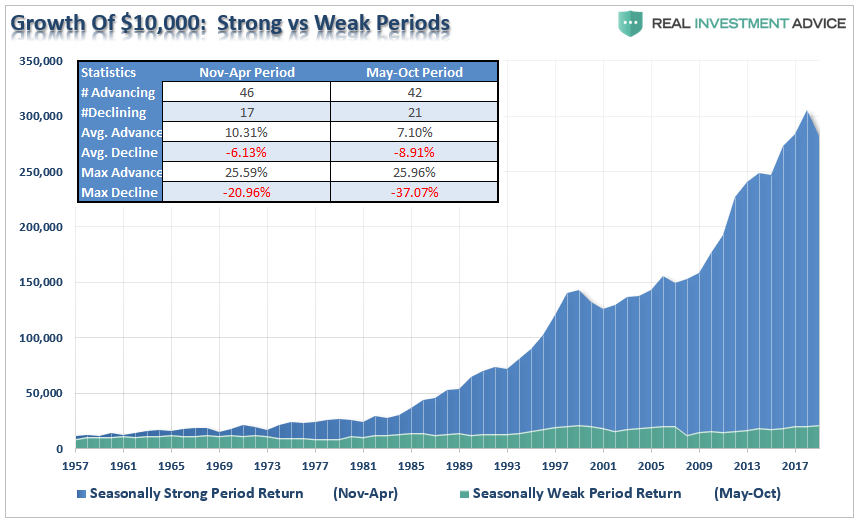
However, this summer, more than most given the state of the actual economy, earnings risk, and a potential revaluation of markets, the odds of a weak summer period has risen markedly. (This is particularly the case as we head into the Presidential election.)
Risk / Reward Turns Negative
As noted, the move higher yesterday is indeed bullish in the short-term. Such is why we added a short-term “rental trade” to our portfolios yesterday. As noted for our RIA PRO subscribers (30-day Risk-Free Trial)
“With the breakout on Monday, we added a ‘rental trade’ to our portfolios using the S&P 500 ETF (SPY) as our proxy position.”
Our trading parameters remain exceptionally tight with a stop-loss at the 50-dma. The target for the trade between is $293 and $297.
The reason the parameters are so tight is the risk and reward of the market has deteriorated further
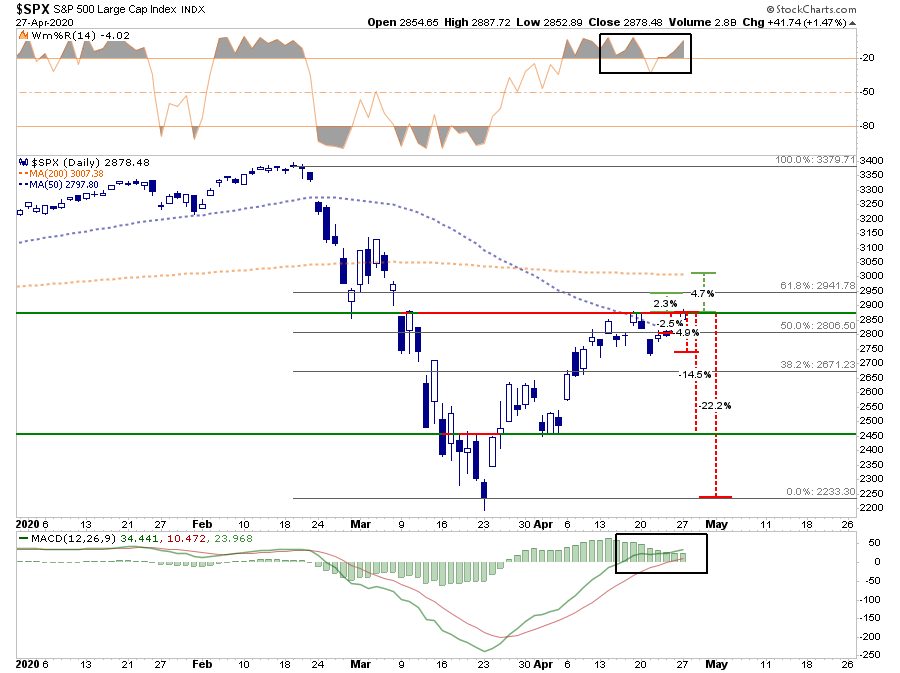
Here is the current setup:
Reward:
- 2.3% to the 61.8% retracement from the March 23rd lows.
- 4.7% to the 200-dma.
Risk:
- 2.8% to the 50% retracement (and 50-dma) from the March 23td lows.
- 4.9% to last week’s sell-off lows, which is now minor support.
- 14.5% to the sell-off lows in early April.
- 22.2% to the March 23rd lows.
“From an optimistic view, a reopening of the economy, a virus vaccine, and an immediate return to low single-digit unemployment rates would greatly expand the bullish ranges for the market.”
However, even a cursory review of the data suggests a more “realistic” view. The economic damage is going to be with us for a while. Until earnings estimates are revised substantially lower to reflect the “actual economy,” you must presume the relevant risks outweigh the current reward.
That’s what the numbers are telling us, which is why we are trading and treading carefully.

Narrow Markets Aren’t Healthy Markets
I commented on the narrowness of the market over the weekend. Narrow markets are risky as they tend to be a momentum chase that can turn quickly. As David Rosenberg noted Monday:
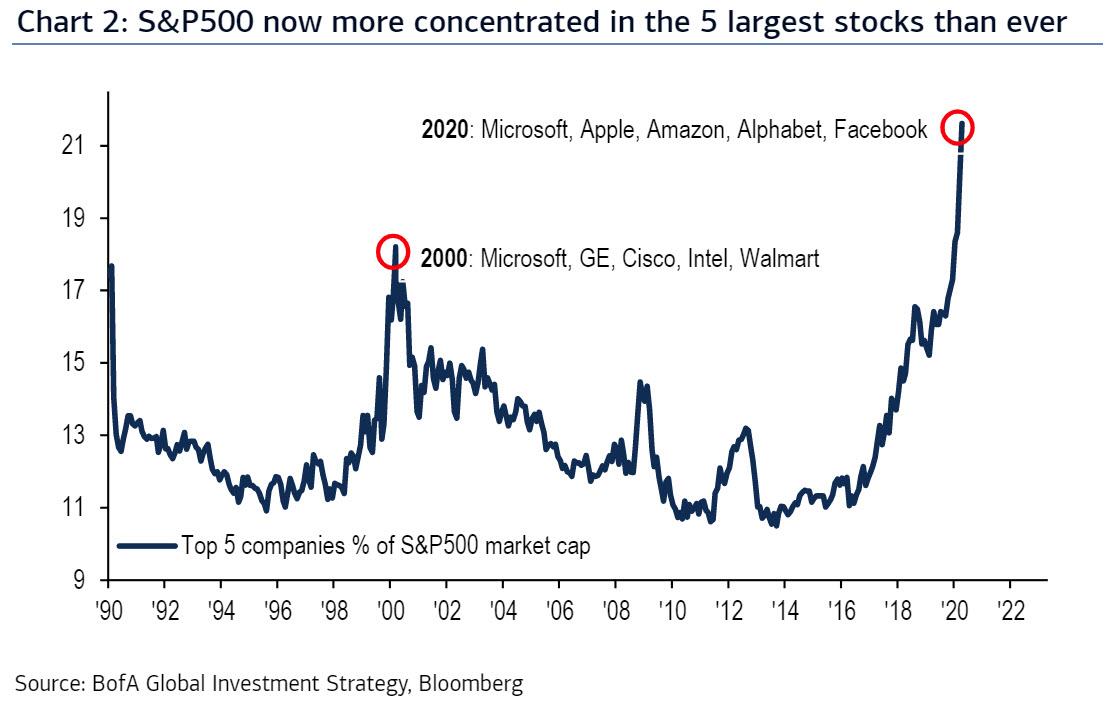
“Big Safety and Big Tech are still carrying the day as so many cyclical sectors remain in varying levels of disarray. We have three companies with nearly a $3 trillion market cap (Microsoft, Apple, and Amazon) or 16% of the total pie, and five companies now comprise 20% of the index.
That is a deeper concentration than we had at the peak of the tech bubble in March 2000! Such masks the pain ongoing in consumer-cyclical services, financials, resources, industrial, transports, and small caps.”
More importantly, as noted by Goldman Sachs, via Zerohedge:
“The gap between the three-month returns of the S&P 500 stock one standard deviation above the average vs. one standard deviation below the average has registered 40%, nearly twice the 10-year average of 23%.”
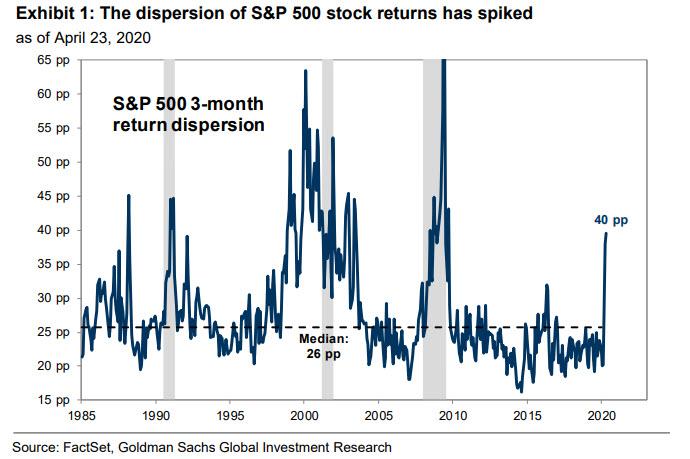
What this suggests is that “many market participants – ourselves included– have expressed incredulity at the fact that the S&P 500 trades just 17% below its all-time high amid the largest economic shock in nearly a century.”
This lack of market breadth is very concerning when the median S&P 500 constituent trades 28% below its record high, putting an 11% gap between the measures of market breadth.
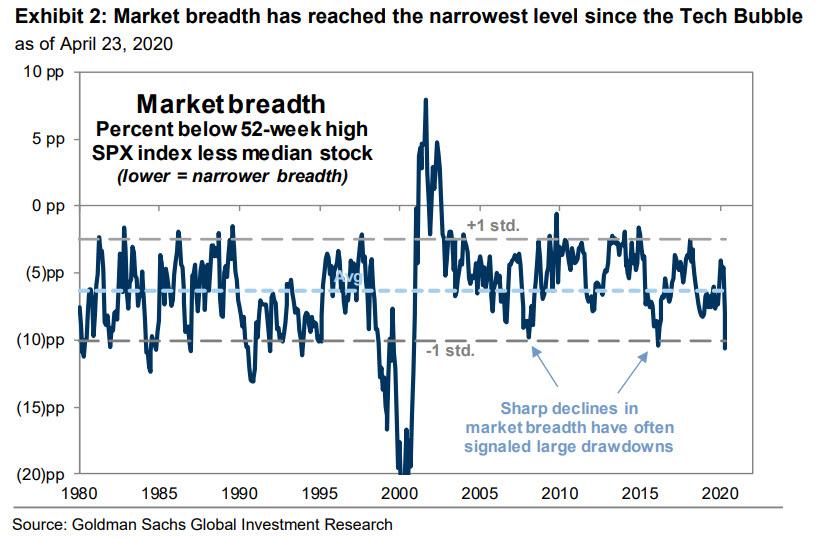
These “gaps” tend to “get filled” and not in a good way.

Credit Flashes A Warning
Another concern remains the risk of defaults in the credit markets. While the Fed is bailing out the bond market on the investment-grade side, there is a limit when it comes to supporting the junk bond market, and there is a lot of debt about to go bad.
Back to David:
“Well, I see on page B1 of today’s WSJ one forecast of what the bond market is telling us about high yield debt defaults from my old Merrill colleague Marty Fridson who says an 8% rate in the next twelve months. Moody’s is even higher at 11.8% by the end of 2020 and 13.1% by the end of 2021Q1. That is tough to square with the message from the stock market because lows tend to coincide with trough multiples, not cycle-high multiples.”
With unemployment headed to 30-million people, businesses closing, GDP dropping by 20%, and wages/incomes imploding, the amount of debt about to go bad, and be downgraded is mind-bending.

Importantly, when the debt is downgraded from investment grade (BBB to AAA) to junk status (BB to DDD) pension funds, mutual funds, and portfolio managers who are NOT allowed to own “junk bonds” will be forced to liquidate. Such is why the Fed was willing to buy “junk” bonds in March which had just been downgraded. There was literally no market.
Unsurprisingly, the liquidation event will happen again as commercial office space, retail, restaurant, auto, and credit card debt defaults surge again.
This will be a risk-off event for the stock market.
The Return Of Wyckoff
Let me conclude with this piece from Bruce Fraser.
I recently discussed the Wyckoff cycles of the market as a partial explanation of why the “bear market” is not complete yet. To wit:
“Many signs are suggesting the current Wyckoff cycle has entered into its fourth and final stage. Whether, or not, the current decline phase is complete, is the question we are all working on answering now.
As Bruce notes for StockCharts.com
“Wyckoffian trendline analysis is a potent and useful tool. The stride of a trend is often set very early in the uptrend. This analysis is fractal in nature and can be employed in time frames from very short-term to very long-term. If the stride is set early a trend can be examined and exploited for most of its duration.”
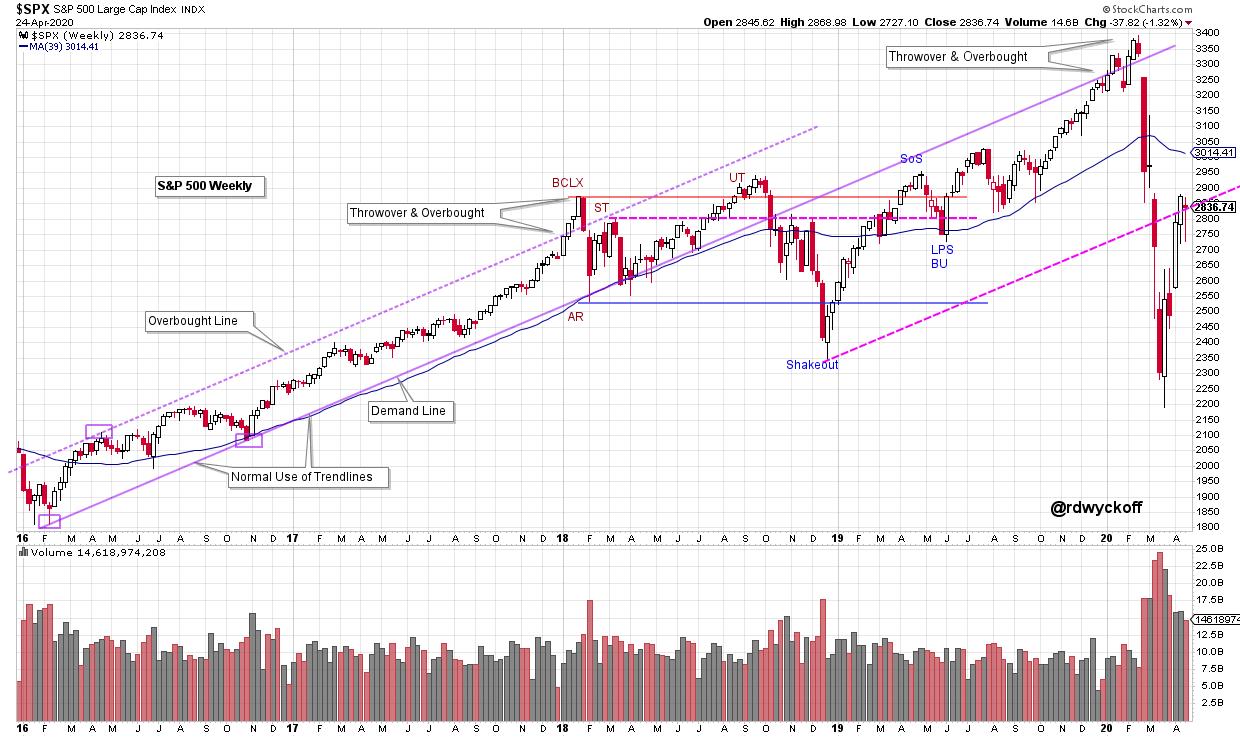
“A weekly uptrend forms in the $SPX in 2016, setting a stride for the bull run. A Demand Line extends from the two adjacent lows. The intervening April 2016 high determines the Overbought parallel line (and channel).
The throw over and Climax arrive in January of 2018 and sets a Range Bound condition for the next 21 months. The Upthrust (UT) of the BCLX sets up a decline into a December 2018 Shakeout.
The rally that followed returned to the Demand Line in Climactic fashion producing a Throwover and Overbought condition in 2020. The rally into the Demand Line from below is a position of weakness and resistance. The decline that followed is a demonstration. Note how weak the $SPX was below the Demand Line in 2018.
A parallel (to the Demand Line) extends from the Shakeout Low. The recent rally has returned the $SPX to this Oversold Trendline from underneath where it has stalled.”
Trading With A Bearish Bias
While we have added equity risk to our portfolios over the last several weeks, we have done so cautiously, and hedged, as the balance of the data continues to suggest that risk is prevalent.
Such doesn’t mean in the short-term that markets can not continue to ignore the fundamentals and trade on optimism. We have seen too many periods in history where this has been the case.
Currently, the markets are trading on confidence of the reopening of the economy.
However, after that, we are going to have to deal with reality.
Investors are “flying blind” as we head into the “dog days of summer.” We have no idea how bad the economic and earnings data is going to be, but we are going to get the first glimpse of it this week.
It’s likely not going to good.
It will probably be horrific.
The question will be if the markets can continue to ignore reality?
We guess that ultimately it won’t.

