


Relative Value Graphs
- The S&P 500 is 0.9% higher versus last Friday, as the weakness in the first half of this week was relieved by a rally yesterday where the index closed about 1.7% higher. Most cyclical sectors outperformed the index, with energy and materials leading the way. However, financials were left behind as the 10Y Treasury yield fell almost 10 bps from its recent high to 1.54% this morning.
- The third graph shows the strong excess returns in energy (XLE) and broad relative weakness in most other sectors over the last 35 trading days.
- Energy moved further into overbought territory as crude oil broke above $82. As we noted last week, on a technical basis, there is little to stop crude from rising to $100, but supply could increase should OPEC deem it appropriate.
- Small and mid-caps remain the most overbought factors, but their scores are still low enough to provide more upside. Emerging markets had a great week on a relative basis, moving from moderately oversold to slightly overbought. International markets remain oversold relative to the S&P 500 but saw a slight improvement.
- In the upper right corner in the first graph, note the inflation vs. deflation index moved well into overbought territory. TLT moved into slightly overbought territory versus IEI from deeply oversold as we saw a flattening in the yield curve last week.
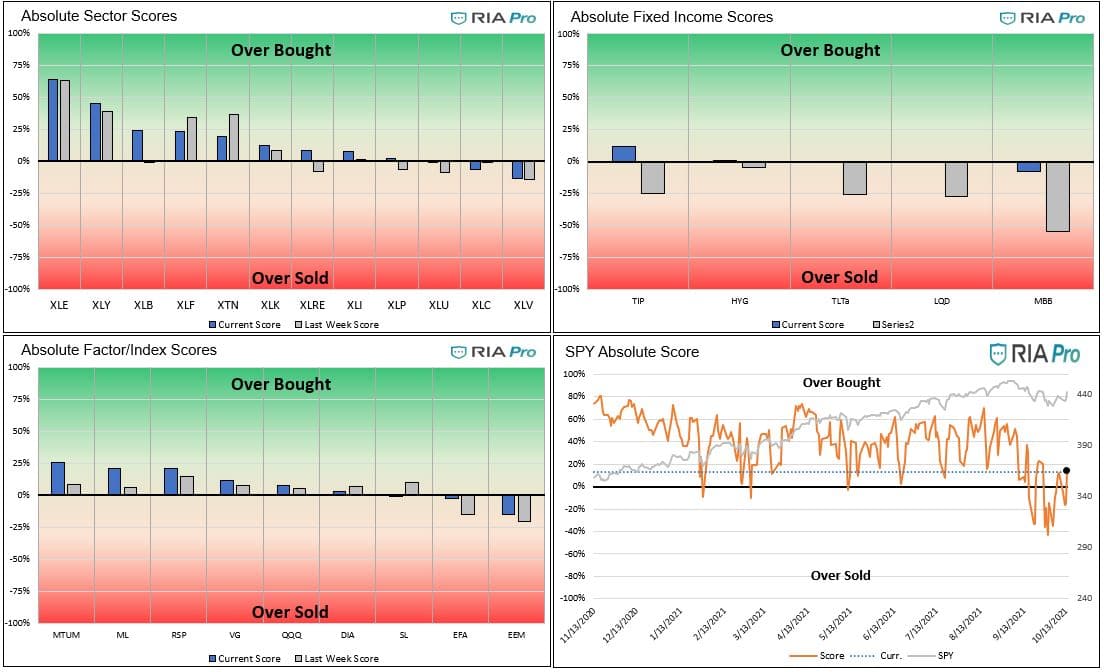
Absolute Value Graphs
- On an absolute basis, the energy sector continues nearing overbought extremes. As we noted last week, there is still more upside, but a healthy consolidation may be in store over the coming weeks. XLV is the most oversold sector on an absolute basis after struggling to find its footing over the past few weeks.
- Both materials and discretionary saw substantial increases in their absolute scores, while financials and transportation saw some relief from overbought conditions.
- TIP moved into overbought territory as inflation expectations have ticked up recently, while TLT moved to fair value from moderately oversold, reflecting some relief in the 10Y Treasury yield.
- Momentum and mid-caps are the most overbought factors, while emerging markets and international markets are the most oversold. Emerging markets saw an improvement last week but remain oversold on an absolute basis.
- The S&P 500 is still slightly overbought on an absolute basis after an intra-week dip last week.
- As shown in the fourth graph, all sectors are above their 200dma. Materials are over two standard deviations from its 20dma, and energy is over two standard deviations from its 50dma. Energy moved from 1.3 standard deviations above its 200dma last week to 1.8 standard deviations this week.


Users Guide
The technical value scorecard report is one of many tools we use to manage our portfolios. This report may send a strong buy or sell signal, but we may not take any action if other research and models do not affirm it.
The score is a percentage of the maximum score based on a series of weighted technical indicators for the last 200 trading days. Assets with scores over or under +/-70% are likely to either consolidate or change the trend. When the scatter plot in the sector graphs has an R-squared greater than .60 the signals are more reliable.
The first set of four graphs below are relative value-based, meaning the technical analysis is based on the ratio of the asset to its benchmark. The second set of graphs is computed solely on the price of the asset. At times we present “Sector spaghetti graphs” which compare momentum and our score over time to provide further current and historical indications of strength or weakness. The square at the end of each squiggle is the current reading. The top right corner is the most bullish, while the bottom left corner is the most bearish.
The ETFs used in the model are as follows:
- Staples XLP
- Utilities XLU
- Health Care XLV
- Real Estate XLRE
- Materials XLB
- Industrials XLI
- Communications XLC
- Banking XLF
- Transportation XTN
- Energy XLE
- Discretionary XLY
- S&P 500 SPY
- Value IVE
- Growth IVW
- Small Cap SLY
- Mid Cap MDY
- Momentum MTUM
- Equal Weighted S&P 500 RSP
- NASDAQ QQQ
- Dow Jones DIA
- Emerg. Markets EEM
- Foreign Markets EFA
- IG Corp Bonds LQD
- High Yield Bonds HYG
- Long Tsy Bonds TLT
- Med Term Tsy IEI
- Mortgages MBB
- Inflation TIP
- Inflation Index- XLB, XLE, XLF, and Value (IVE)
- Deflation Index- XLP, XLU, XLK, and Growth (IWE)

Nick Lane
Nick Lane Investment Analyst
A native of Kingwood, Texas Nick attended college at the University of Houston. He completed a BBA in Accounting and Finance and 2018 and then a Masters of Science in Finance in 2020. Outside of work, Nick enjoys both saltwater and freshwater fishing as well as following various professional sports leagues.
Also Read


