The Technical Value Scorecard Report uses 6-technical readings to score and gauge which sectors, factors, indexes, and bond classes are overbought or oversold. We present the data on a relative basis (versus the assets benchmark) and on an absolute stand-alone basis. You can find more detail on the model and the specific tickers below the charts.
Commentary 2-26-21
- Last week we introduced our Relative inflation/deflation indicator. It is found in the upper right Fixed Income graph on the first set of charts. We made some adjustments to the index constituents this past week which can be found at the bottom of this report. The inflationary versus deflationary sectors were largely unchanged last week despite the volatility. A big reason for this was the weakness in the technology and growth sector/factors, which tend to benefit from deflation. XLU and XLP, the other deflationary sectors performed better. On the inflationary front, XLE, XLF, and XLB all outperformed the S&P. As yields move higher we will watch these sectors closely for signs that the reflationary trade may be ending. For what it’s worth there are longer-term market-implied inflation indicators, as shown in the third graph below, that turned lower in the last week.
- Energy, Transportation, and Banks are grossly overbought, while Technology, Discretionary, Utilities, and Staples are oversold. Again, we are on the lookout for a rotation to the “deflationary” sectors.
- The factor/index graph tells a similar story of the “haves’ and “have nots.” Momentum and QQQ are grossly oversold, while value, small/mid-cap are overbought. Keep in mind value tends to be heavily allocated to energy and financials.
- The scatter plot continues to show a high r-squared denoting the model scores are well characterizing relative returns.
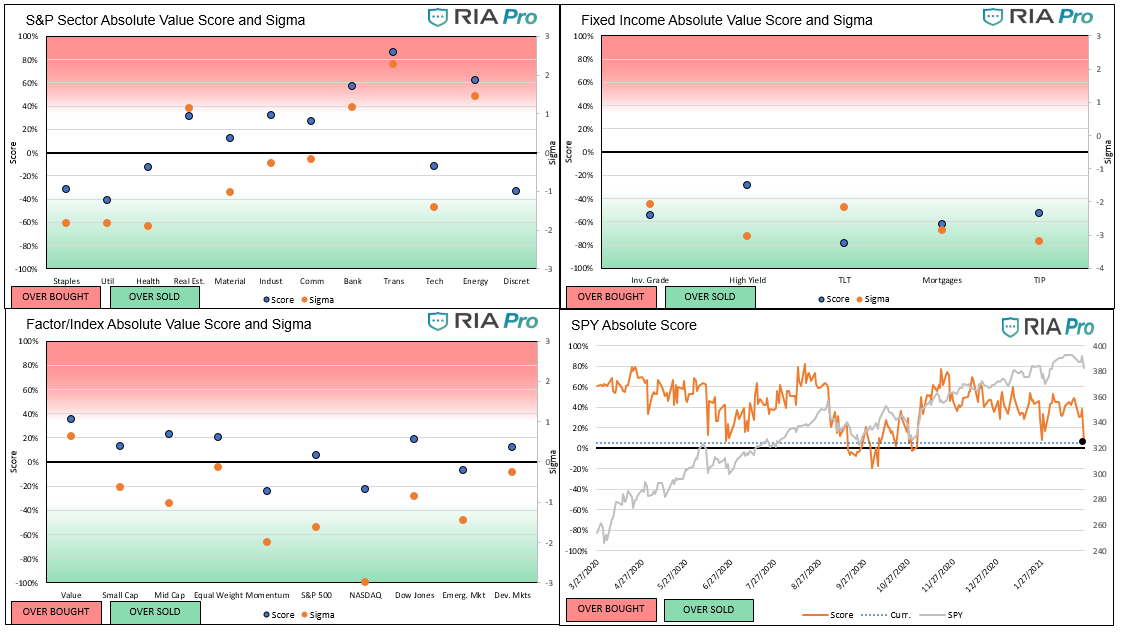
- On an absolute basis, Transportation stocks are the most overbought with banks and energy following. Staples, utilities, healthcare, and technology are oversold, but not extremely so.
- Discretionary now has an absolute sigma score of -4, which is off the chart and denoting a very oversold condition.
- Most factors and indexes are hovering around fair value, as is the S&P 500 in the lower right of the second set of graphs. The NASDAQ is as oversold as it has been in at least the last 200 trading days.
- Not surprisingly, the fixed income sectors are all grossly oversold. Note, we had to adjust the sigma scale on this graph to -4 to include a few of the sectors. High yield bonds are now oversold for the first time in a long while.
Graphs (Click on the graphs to expand)


Users Guide
The score is a percentage of the maximum/minimum score, as well as on a normalized basis (sigma) for the last 200 trading days. Assets with scores over or under +/-60% and sigmas over or under +/-2 are likely to either consolidate or change trend. When both the score and sigma are above or below those key levels simultaneously, the signal is stronger.
The first set of four graphs below are relative value-based, meaning the technical analysis score and sigma is based on the ratio of the asset to its benchmark. The second set of graphs is computed solely on the price of the asset. Lastly, we present “Sector spaghetti graphs” which compare momentum and our score over time to provide further current and historical indications of strength or weakness. The square at the end of each squiggle is the current reading. The top right corner is the most bullish, while the bottom left corner the most bearish.
The technical value scorecard report is just one of many tools that we use to assess our holdings and decide on potential trades. This report may send a strong buy or sell signal, but we may not take any action if other research and models do not affirm it.
The ETFs used in the model are as follows:
- Staples XLP
- Utilities XLU
- Health Care XLV
- Real Estate XLRE
- Materials XLB
- Industrials XLI
- Communications XLC
- Banking XLF
- Transportation XTN
- Energy XLE
- Discretionary XLY
- S&P 500 SPY
- Value IVE
- Growth IVW
- Small Cap SLY
- Mid Cap MDY
- Momentum MTUM
- Equal Weighted S&P 500 RSP
- NASDAQ QQQ
- Dow Jones DIA
- Emerg. Markets EEM
- Foreign Markets EFA
- IG Corp Bonds LQD
- High Yield Bonds HYG
- Long Tsy Bonds TLT
- Med Term Tsy IEI
- Mortgages MBB
- Inflation TIP
- Inflation Index- XLB, XLE, XLF, and Value (IVE)
- Deflation Index- XLP, XLU, XLK, and Growth (IWE)


Michael Lebowitz, CFA is an Investment Analyst and Portfolio Manager for RIA Advisors. specializing in macroeconomic research, valuations, asset allocation, and risk management. RIA Contributing Editor and Research Director. CFA is an Investment Analyst and Portfolio Manager; Co-founder of 720 Global Research.
Follow Michael on Twitter or go to 720global.com for more research and analysis.
Customer Relationship Summary (Form CRS)