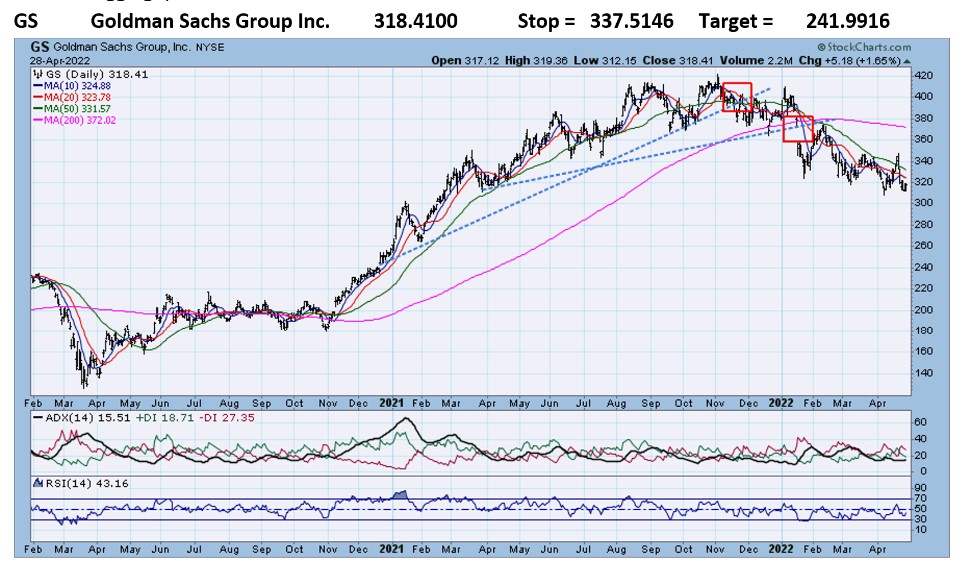
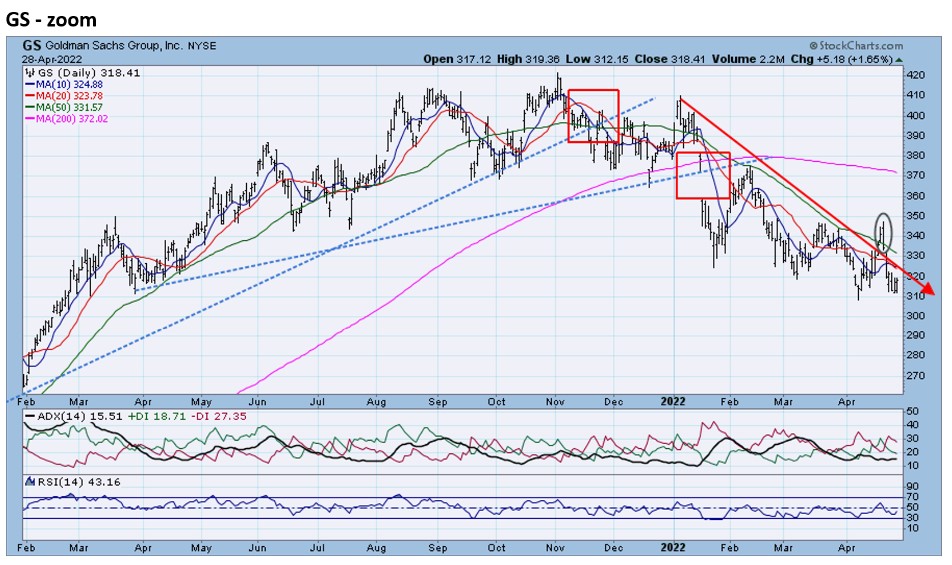
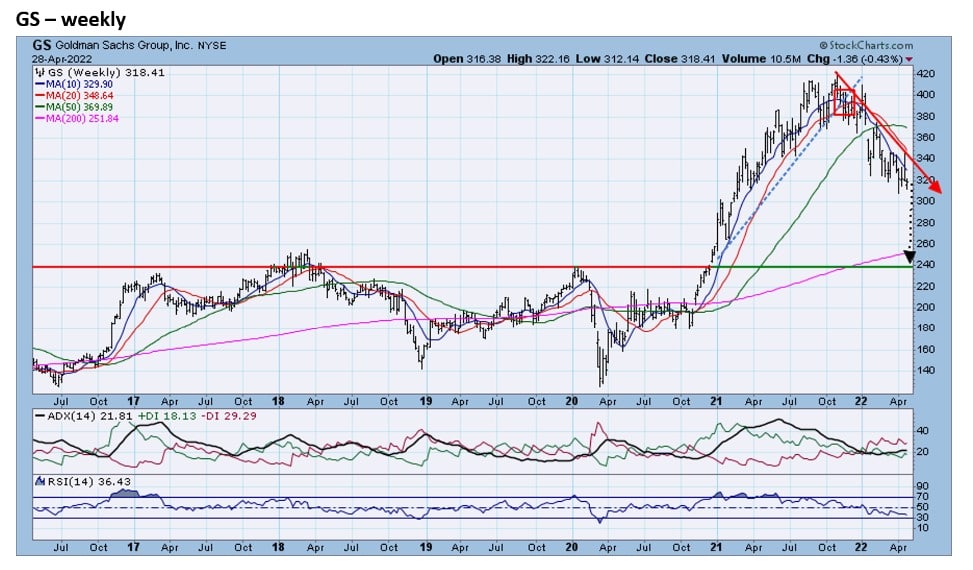
GS rallied over 130% from the end of November 2020 to its apex at the end of October 2021. GS then fell below its 10-month uptrend in November 2021 and another uptrend line in January 2022. The January 2022 decline was particularly bad given its gap-down nature. The zoom chart shows that GS has established a pattern of lower highs and lower lows=downtrend. The weekly chart reveals that, after these breaks, long-term support for GS is 25% lower at approximately the 240 level.
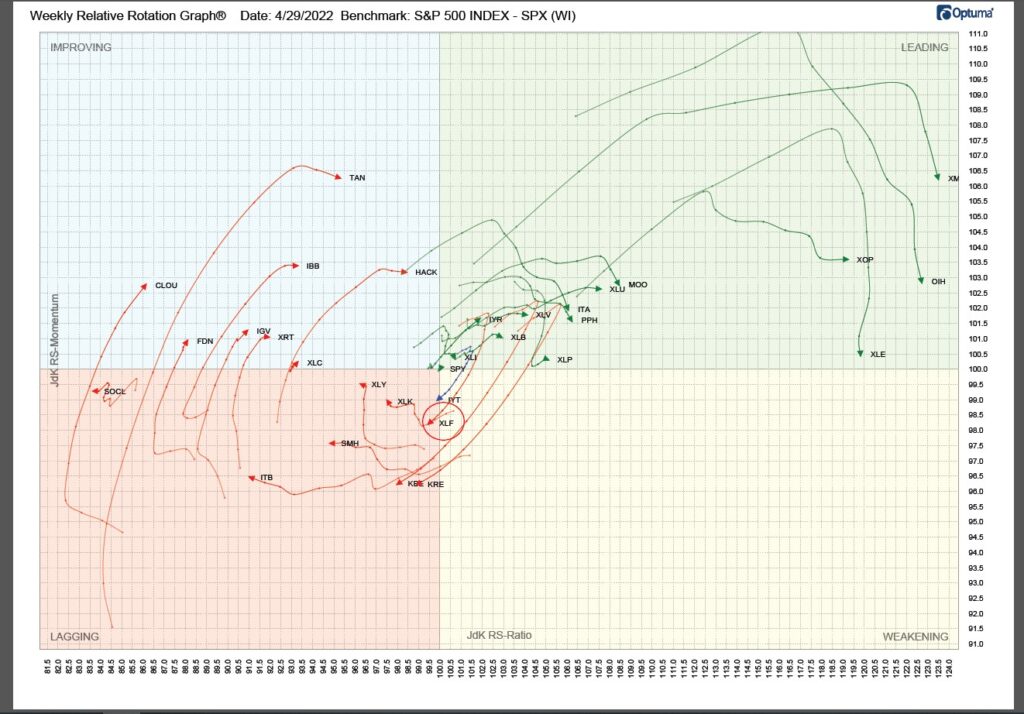
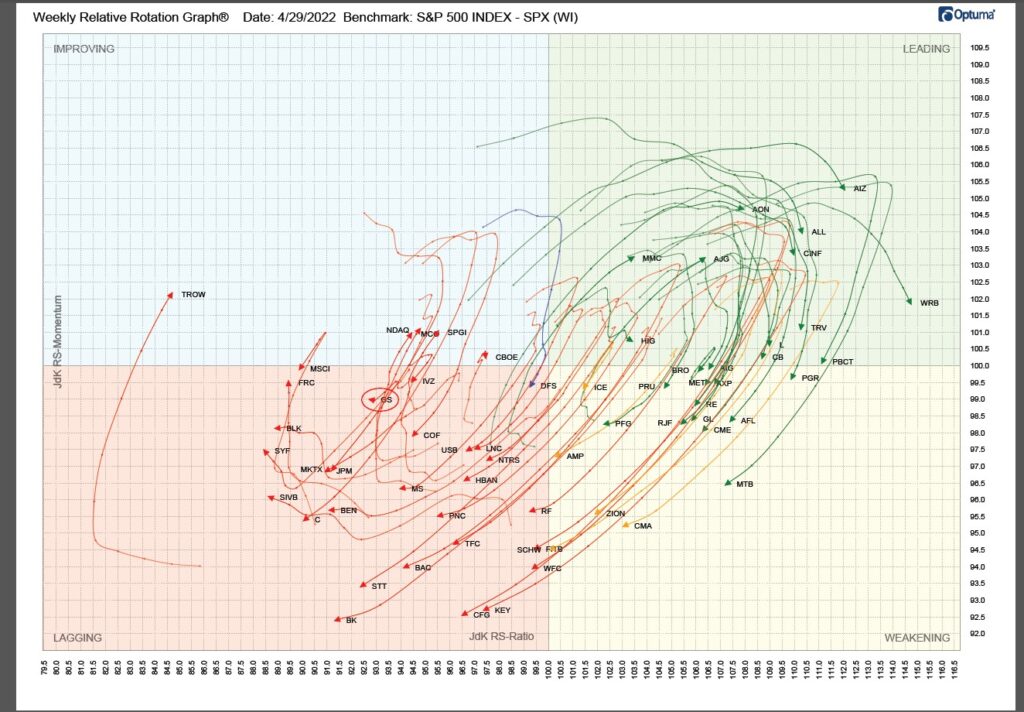
RRG analysis shows that the Financials have now moved into the Lagging quadrant. RRG 2 shows that GS has also lost relative strength and momentum and is now firmly ensconced in the Lagging quadrant.
Relative Rotation Graphs (RRG) – explanation video


Jeff Marcus founded Turning Point Analytics (TPA) in 2009 after 25 years on trading desks and 13 years as a head trader to provide strategic and technical research to institutional clients. Turning Point Analytics (TPA) provides a unique strategy that works as an overlay to clients’ good fundamental analysis. After 10 years of serving only large institutions, TPA now offers its research services to mid and small managers, RIA’s, and wealthy sophisticated individuals looking for a way to increase their returns and outperform their peers.
Subscribe 2 Week Trial
Customer Relationship Summary (Form CRS)
Also Read