


Stocks are being whipped around as volatility wreaks havoc on bulls and bears alike. The S&P 500 stock index closed the week up a little less than 1% and over 6% above the lows of Thursday’s war-induced, volatility-plagued session. This morning stocks are set to open sharply lower as traders try to assess the impact of new sanctions on Russia.
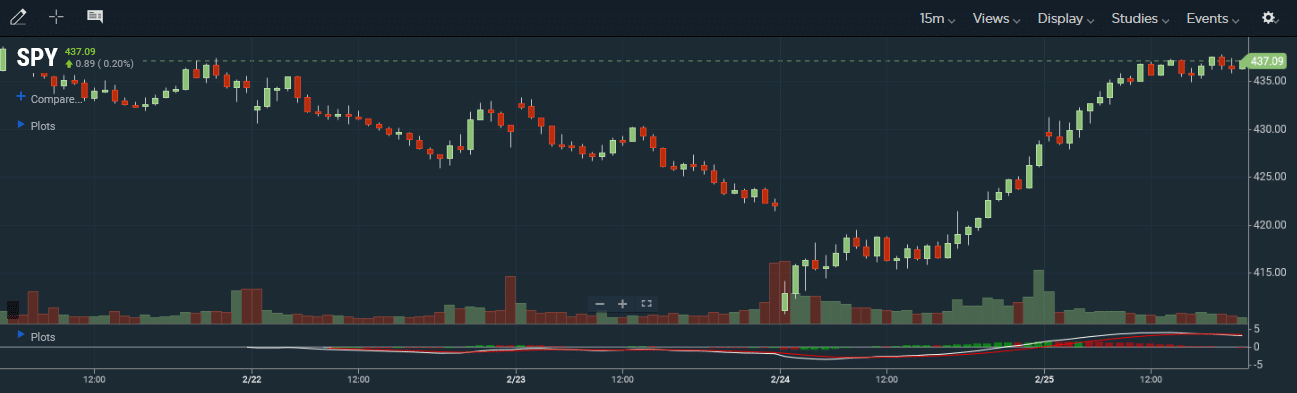
For more on the rarity of recent volatility, read up on the NASDAQ’s feat in the commentary below. Volatility will likely stay heightened in the stock, bond, and commodity markets until the Russian conflict simmers down. Assuming it concludes in short order, investors will need to focus on the volatility likely stemming from the Fed’s March 16th FOMC meeting. The SimpleVisor graph below shows the round-trip the S&P 500 made last week.

Overview Of What’s Happening
Some observations from Bloomberg senior markets reporter Nikos Chrysoloras, as tweeted late on Sunday.
1) BP decided to take a hit of as much as $25 billion, just to leave Russia immediately
2) Russia’s bond market is collapsing
3) Russians lined up at cash machines around the country to withdraw foreign currency
4) Unless there’s a surprise de-escalation, Monday may turn out to be a dramatic day for the ruble, Russian stocks, and European markets
5) The European Union closed its airspace to Russia. The blockade applies to any plane owned, chartered or otherwise controlled by a Russian person. Unprecedented
6) The decision to exclude Russian banks from the SWIFT messaging system could result in missed payments and giant overdrafts within the international banking system
7) The EU is going after oligarchs. Essentially now the entire political and economic elite of the country is sanctioned
8) The U.S. Embassy in Russia said citizens in the country should consider departing *immediately* – The EU approved $500 million in lethal military aid to be used against Russia’s invading forces in ?? and banned ?? state media – also unprecedented
9) The EU also banned all transactions with the Russian central bank, severely curbing its ability to use foreign currency reserves to cushion the devastating blow from the sanctions
10) The situation on the front is unclear, but it seems Ukrainian facilities containing nuclear waste suffered damage
11) Putin says he put his nuclear forces on “high alert“. Unclear what this means and what are his intentions. On the tactical side, things are definitely not going as well as he had hoped
12) Could planned talks lead to some sort of resolution? Unclear what could a mutually acceptable solution be
13) Meanwhile, Chancellor Olaf Scholz announced plans for a massive boost in defense spending in the latest historic policy shift in Germany triggered by Russia’s invasion of Ukraine.
H/T Zerohedge
March Rally Possibility?
As we discuss in today’s blog post, despite recent stock volatility, could we see a March rally into the FOMC meeting? With a short-term buy signal, and not overbought yet, there are three rally targets for the market currently:
- The 200-dma (red line)
- The current downtrend line; and,
- The 50-dma (black line)

While anything is possible, we suggest using those levels to reduce risk heading into the Fed meeting.
TPA Research – Top 10 Stocks To Buy And Sell
Click on RIAPro+ today to add TPA Research to your subscription for just $20/month.

The Worst Won The Race
The post-invasion rally on Thursday and Friday was driven by the most shorted and fundamentally weak companies. According to GS:
“The biggest YTD losers of 2022, became the biggest 1 day gainers (of Friday). Short Covering across GS delta-one baskets and ETF’s.”
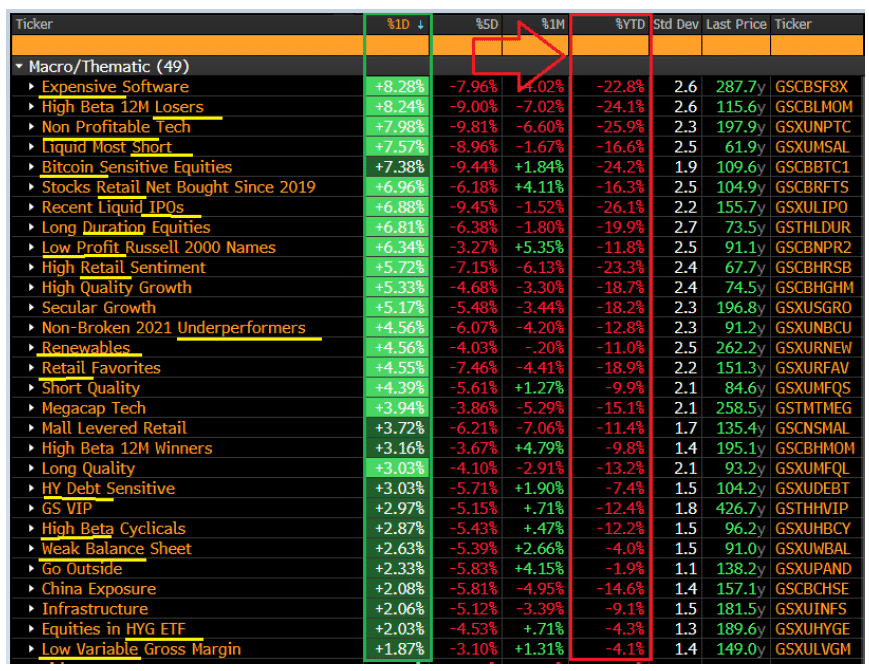
This type of action is not consistent with a recovering market and suggests the current rally, while there is room to the upside momentarily, will most likely fail..
The Week Ahead
The ISM Manufacturing Index on Tuesday is expected to increase slightly from January’s reading. This is despite weakness in a good number of regional manufacturing indexes. Once again, all eyes will be on inventories and prices to better assess inflationary pressures in the system. Also of importance, this week are the ADP and BLS labor reports. ADP, after declining by 301k last month is expected to rise by 320k. The BLS showed an increase of 467k jobs last months and expectations are for 350k new jobs this month.
Fed speakers may likely be quiet again this week as they assess the situation in Russia. It is possible geopolitical concerns may cause Fed to restrain and rate rates by 25bps in March versus 50bps.
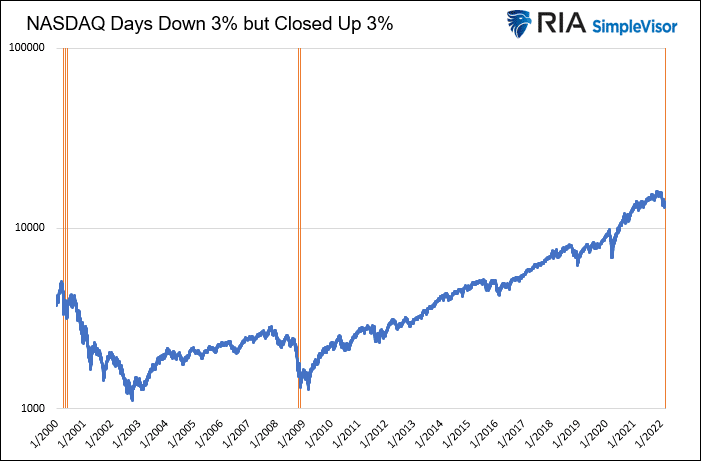
3% Down – 3% Up In a Day. Whats Next?
On Thursday after the market first learned of the Russian invasion the NASDAQ opened down 3.5% from the prior close. Despite growing anxiety, it closed the day up 3.5%. The graph below shows the five other times since 2000, the NASDAQ had a 3%+ opening decline which reversed to a 3%+ gain. All Five happened during the last two bear markets. Such an event happened three times during the 2000-2003 tech bust and twice during the financial crisis in 2008. In all cases, the incredible stock volatility was not a capitulation low but was ultimately met with lower prices.
In 2000-2003, the three instances occurred after the bear market’s first initial decline. The volatility marked a temporary bottom followed by a short-lived relief rally. In hindsight, investors should have reduced risk at that time. In the 2008 bear market, the two instances happened closer toward the end of the decline. Like 2000, the market would go on to lower levels before a true bottom formed.
This graph leaves two questions. First, will such a volatile daily feat repeat itself in a relatively short time frame as it did in the past? Second, is this the beginning of a long bear market like 2000, or a signal that a bottom is near, as we saw in 2008?
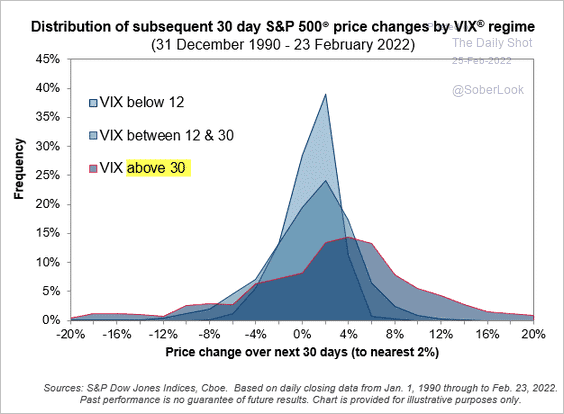
VIX Entails Upside And Downside Risk
The Daily Shot graph below shows the S&P 500 30-day forward return based on the level of the VIX volatility index. When the VIX is above 30, the mean 30-day return is higher than when it’s below 30. However, with the higher average returns come better chances of outsized returns, both positive and negative. Volatility tends to correct quickly from >30 VIX readings but the tail risk of significant declines is a threat.
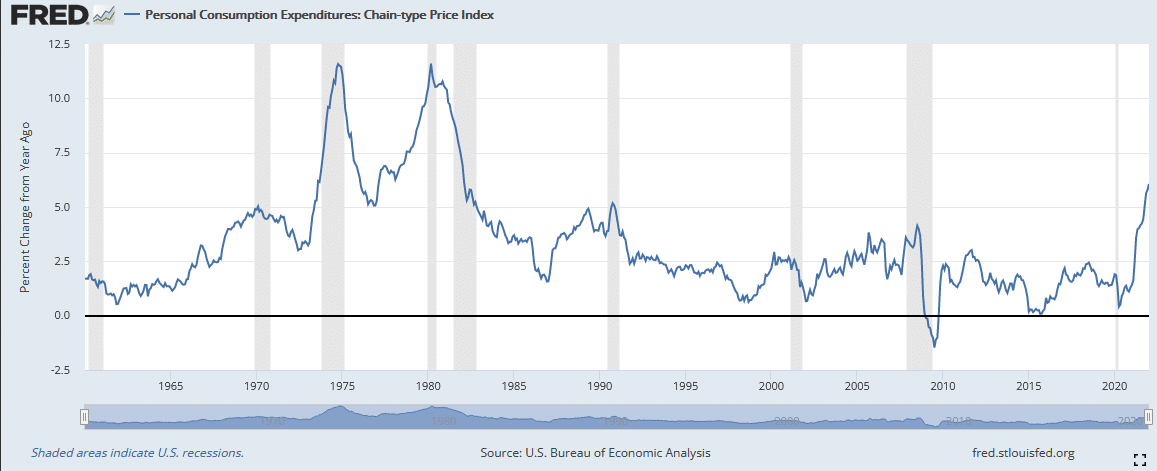
Fed’s Favorite Inflation Gauge at 40 Year Highs
The Fed considers the Personal Consumption Expenditures price index its preferred gauge for inflation. On Friday the gauge came in higher than expected, showing 6.1% annual inflation. The monthly price index was +0.6%, equating to 7.2% inflation if annualized. Also of concern, Personal Income was flat for the month, meaning that on average consumers fell behind 0.6% due to inflation.
Please subscribe to the daily commentary to receive these updates every morning before the opening bell.
Also Read


