The S&P 500 finished the week above its 50-dma after bulls sparked a mid-week rally that carried into Friday’s close. The yield curve flattened last week as 10Y Treasury yields gave up a few basis points, while 2Y yields increased due to rising inflation expectations. Earnings will be the primary focus this week as we get into the thick of reporting season.
This morning futures are slightly lower which is not surprising after a big move last week. A test of the 50-dma that holds will be a bullish indication setting the markets up for a test of all-time highs. Upside momentum is returning to the markets and in the process, the technical damage done to stocks from early September through early October is getting repaired.
The big concern in the near term remains the fundamentals of the market with inflation and higher wages weighing on corporate profit margins and earnings. So far, earnings have been positive, but it has been primarily banks who aren’t exposed to supply chain disruptions. The next couple of weeks will give us a much better picture.

What To Watch Today
Economy
- 9:15 a.m. ET: Industrial production, month-over-month, September (0.2% expected, 0.4% in August)
- 9:15 a.m. ET: Capacity utilization, September (76.5% expected, 76.4% in August)
- 10:00 a.m. ET: NAHB Housing Market Index, October (75 expected, 76 in September)
- 2:00 p.m. ET: Total Net TIC Flows, August ($126.0 billion in July)
- 2:00 p.m. ET: Net long-term TIC flows, August ($2.0 billion in July)
Earnings
Pre-market
- 7:30 a.m. ET: Albertsons Cos. (ACI) is expected to report adjusted earnings of 46 cents per share on revenue of $15.88 billion
- 7:30 a.m. ET: State Street Corp. (STT) is expected to report adjusted earnings of $1.92 per share on revenue of $2.96 billion
Post-market
- 4:30 p.m. ET: Steel Dynamics. (STLD) is expected to report adjusted earnings of $4.69 per share on revenue of $5.04 billion
Courtesy of Yahoo.
Bulls Retake 50-dma As Seasonally Strong Period Starts
As noted above, while the market started last week a bit sloppily, the bulls charged back on Thursday as earnings season officially got underway. With the market crossing above significant resistance at the 50-dma and turning both seasonal “buy signals” confirmed, it appears a push for previous highs is possible.
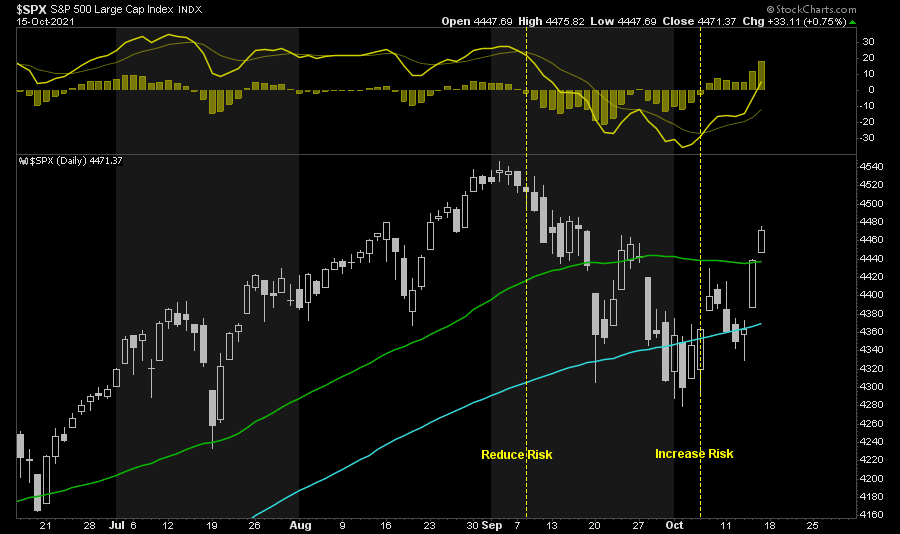
Two factors are driving the rebound. Earnings, so far, are coming in above estimates. Such isn’t surprising as analysts suppressed estimates going into reporting season. Secondly, bond yields declined.
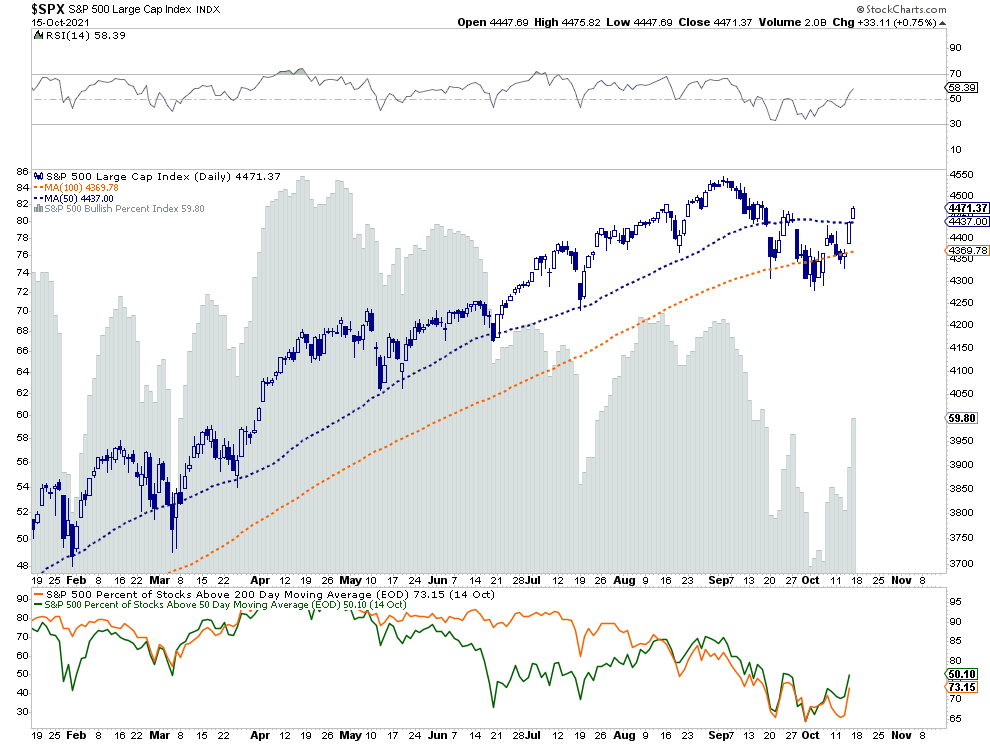
However, there are still reasons to remain cautious near term. As shown below, the internals of the market, while improved slightly, remain negatively diverged. The number of stocks above respective 50- and 200-dma remains low, the bullish percent index remains weak, and relative strength declines.
Furthermore, most companies haven’t reported earnings yet, and macroeconomic challenges still exist. So far, large banks beat estimates on reduced loan loss reserves, but they don’t deal with supply-chain limitations. We are about to see earnings from companies directly impacted by and don’t benefit from, higher inflation, labor costs, and supply line disruptions.
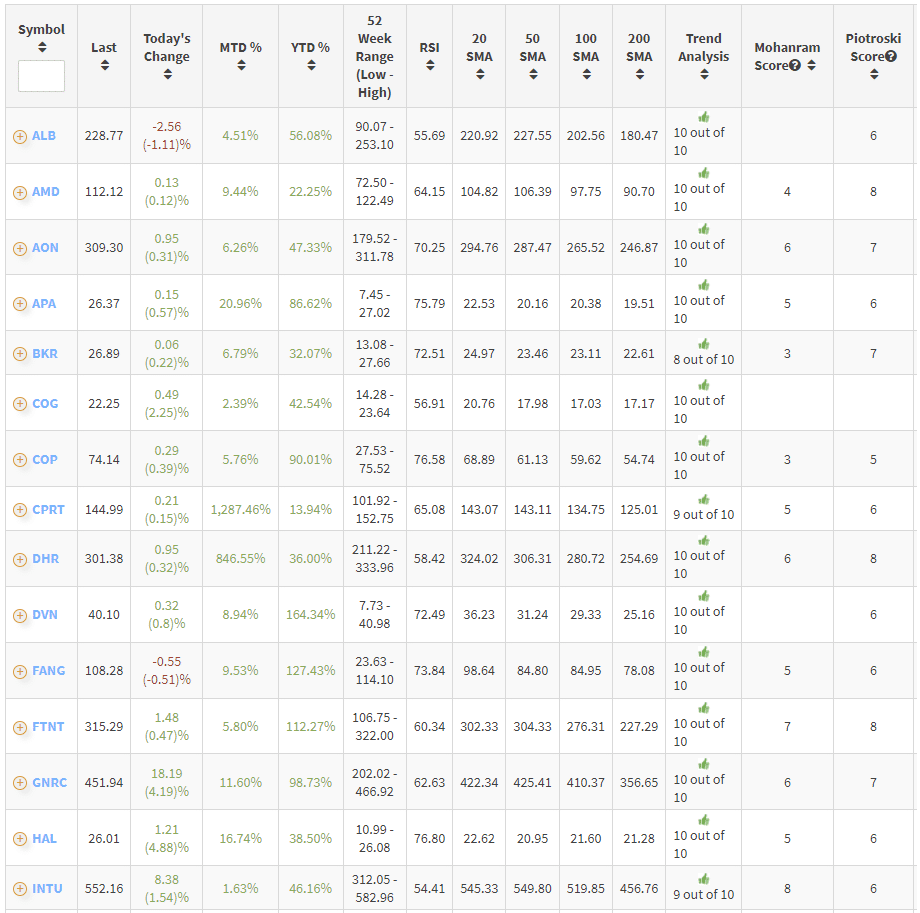
S&P Stocks With The Strongest Relative Strength
Looking for ideas of where to put money to work for the “seasonally strong” period of the year? We ran a quick scan on RIAPRO of the strongest relative strength stocks. Not surprisingly, given the surge in inflationary pressure, commodity, and oil prices, the majority of stocks on the list fell into those sectors.
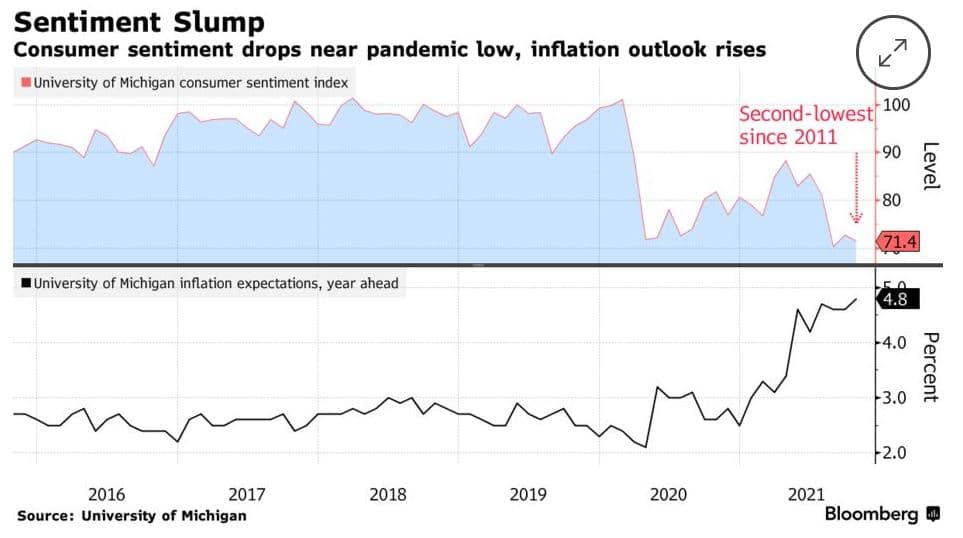
Inflation Concerns Weigh on Sentiment
The October University of Michigan consumer sentiment survey came in weak at 71.4 versus a consensus estimate of 74. The result, which fell from 72.8 in September, registered as the second-lowest outcome since 2011. The chart below, courtesy of Bloomberg, shows year-ahead inflation expectations based on the survey have risen to 4.8%, their highest point in 2021.
Retail Sales Surprise
September retail sales surprised to the upside this morning at +0.7% MoM versus estimates of -0.1%. Retail sales ex-vehicles grew +0.8% MoM versus +0.4% expected, and ex-vehicles and gas rose in line with expectations of +0.7%. Retail sales remain extremely elevated above the long-term trend. The eventual reversion to the mean will weigh on economic growth.
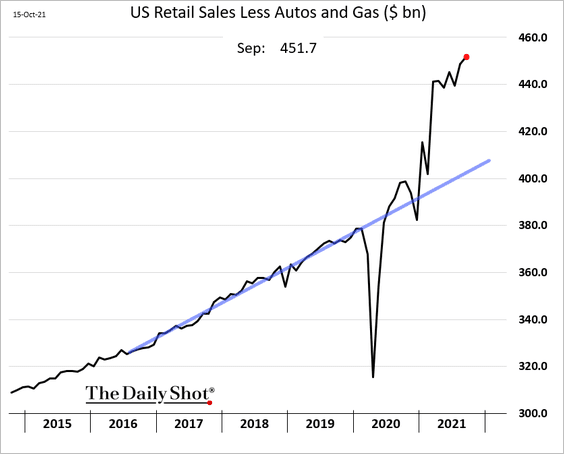
Incorporating Wednesday’s September CPI release, real growth in retail sales for September was only +0.3% MoM. Thus, over half of the nominal growth in September came from rising prices. Treasury yields are moving higher following the release, reflecting the market’s increasing expectations for taper.
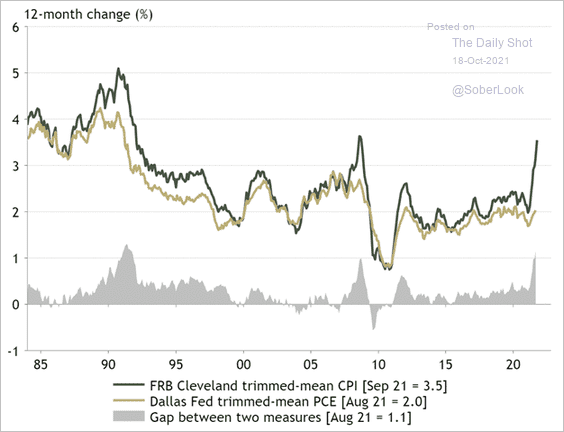
The trimmed-mean CPI has now diverged from the trimmed-mean PCE inflation measure. Explanation below.
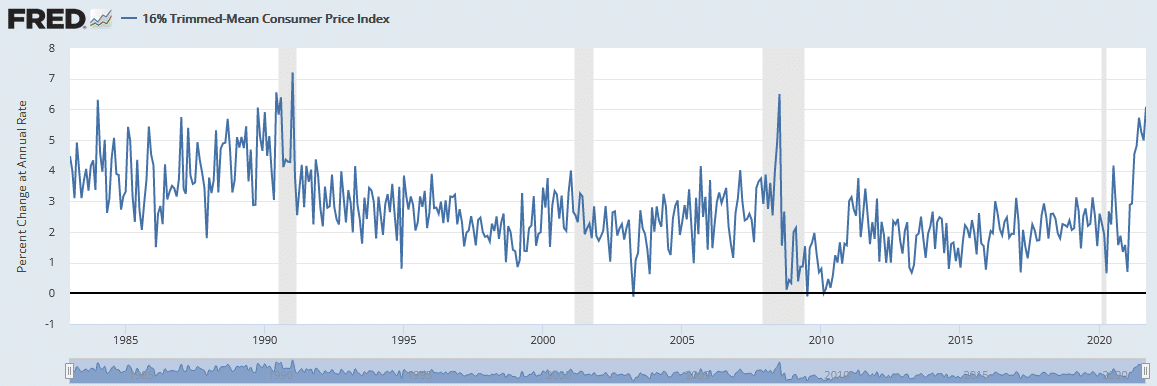
Cleveland Fed Trimmed Mean Inflation
On a monthly basis, the Cleveland Fed puts out the 16% trimmed mean inflation rate. Their modified inflation rate trims price change outliers, both high and low, from CPI. Currently, as shown below, the index is just short of the 2008 highs. At that time oil was nearly $150 a barrel and up well over 100% from where it was a year earlier. Take away that short burst higher and the trimmed measure is at its highest level since the late ’80s. The takeaway from this inflation gauge is that the number of goods driving higher inflation is broadening and not just confined anymore to a few extremes like used cars and gasoline.
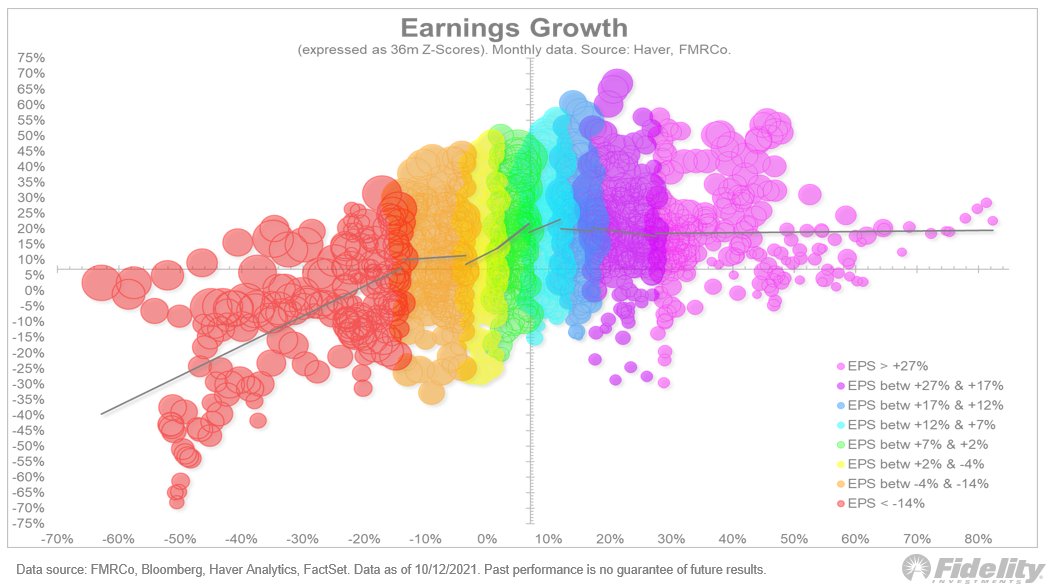
EPS and Returns
The graph below, courtesy of Fidelity, shows the correlation between S&P earnings growth (EPS – X-axis) and price performance on the Y-axis. The EPS data is broken into 8 tiers and color-coded. Each color, or specific range of EPS, has a trend line drawn through it. In general returns and EPS are positively correlated as should be expected. There are exceptions. In particular, there seems to be no correlation when EPS is very strong -on the right side of the graph. This is likely due to strong but unsustainable earnings growth coming out of recessions. Conversely, the red circles on the far left are likely periods at market bottoms where prices rose in expectations of a rebound in EPS.
Also Read