


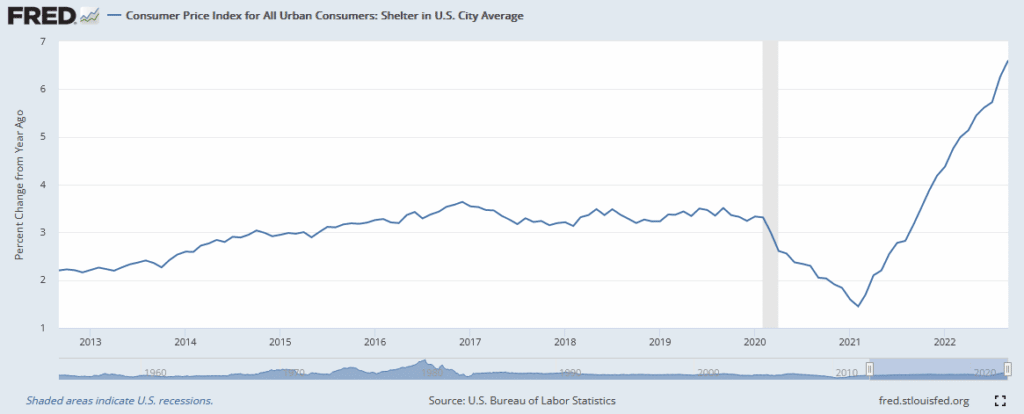
CPI was higher than expected, primarily due to sharply rising shelter prices. Shelter prices are defined as actual rents and imputed rent based on home prices. Together the two shelter components account for about a third of CPI. As the graph below shows, shelter costs are rising rapidly, and with it, CPI. Excluding food and shelter, inflation was only up 0.1% in September. Annualized, that amounts to a meager 1.2%.
In our opinion, this CPI report is very misleading due to the significant contribution of shelter costs and the fact that shelter costs lag. What the BLS reported yesterday was actual market transaction data from at least three months ago. Today, rental costs and home prices are starting to fall. It may take another few months for CPI to reflect current conditions, but after an initial panic, the markets are showing signs they are seeing through the CPI report.

What To Watch Today
Economy
- 8:30 a.m. ET: Retail Sales Advance, month-over-month, September (0.2% expected, 0.3% prior)
- 8:30 a.m. ET: Retail Sales excluding autos, month-over-month, September (-0.1% expected, -0.3% prior)
- 8:30 a.m. ET: Retail Sales excluding autos and gas, month-over-month, September (0.3% prior)
- 8:30 a.m. ET: Retail Sales Control Group, September (0.0% prior)
- 8:30 a.m. ET: Import Price Index, month-over-month, September (-1.1% expected, -1.0% prior)
- 8:30 a.m. ET: Import Price Index excluding petroleum, month-over-month, September (-0.2% prior)
- 8:30 a.m. ET: Import Price Index, year-over-year, September (7.8% prior)
- 8:30 a.m. ET: Export Price Index, month-over-month, September (-1.2% expected, -1.6% prior)
- 8:30 a.m. ET: Export Price Index, year-over-year, September (10.8% prior)
- 10:00 a.m. ET: Business Inventories, August (0.9% expected, 0.6% prior)
- 10:00 a.m. ET: University of Michigan Consumer Sentiment, October preliminary (58.8 expected, 58.6 prior)
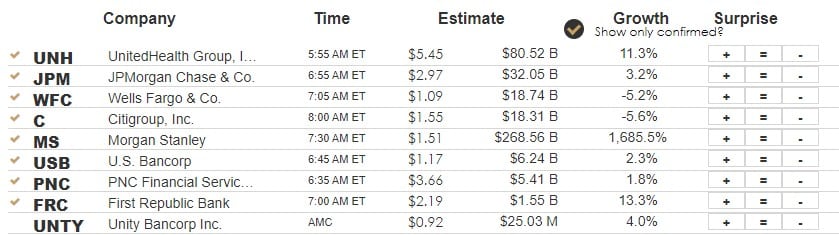
Earnings
Market Trading Update
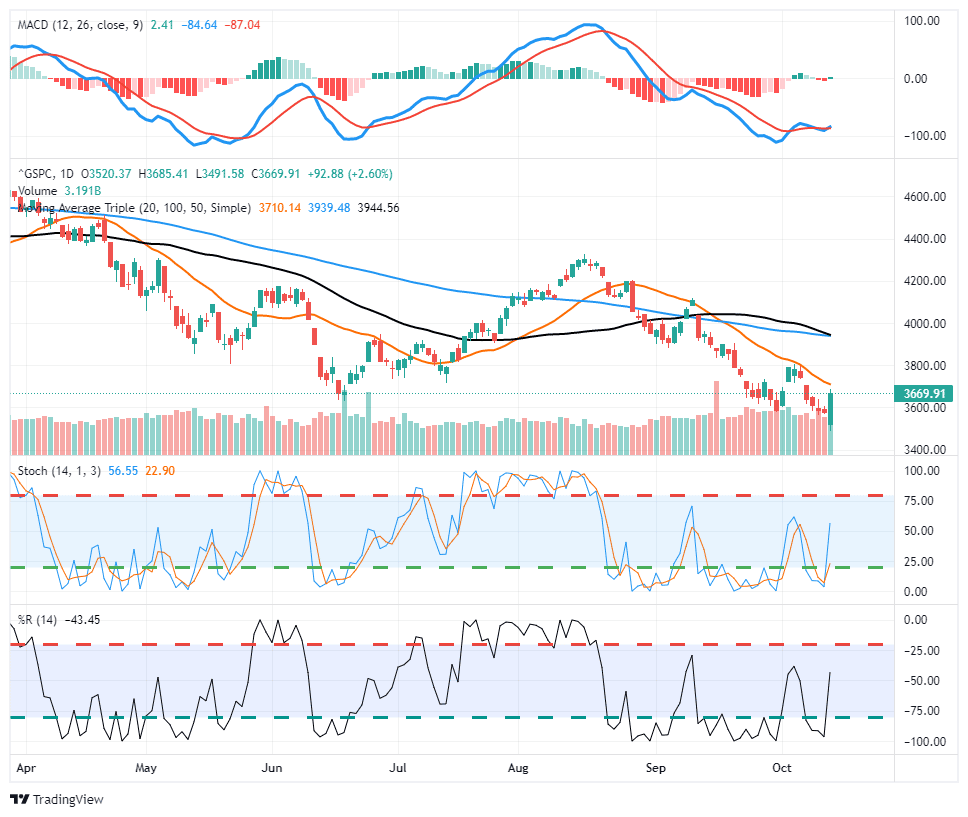
A big turnaround day yesterday after a hotter-than-expected inflation print. However, as we have discussed, the market was so oversold, washed out, and negatively positioned the “bad news” was already well-priced into the market. Such led to a strong reversal shortly after the market opened, and the rally closed near its highs for the day. We will likely see some early follow-through buying this morning, but importantly, the MACD turned back on a buy signal from a low level. With markets holding recent lows and long-term bullish trend support, a break above the 20-dma will set the market up for a rally to 3900. We still suggest selling into the rally as it comes.
Insider Buyers are Getting Bullish
The Fidelity graph below shows corporate executives are bullish on their stocks. Insiders are often sellers as they reduce the shares they accumulate via stock options and grants. As such, the ratio of sales to buys, shown below, is always a positive number. The lower the ratio, the less they sell compared to the amount they buy. Recently, the number has fallen to its lowest level since March 2020. The weekly ratio (light gray) is approaching prior troughs, which have coincided with market bottoms. Per Jurrien Timmer from Fidelity:
Look who’s bullish: Corporate insiders are buying their company stock again in size during this latest sell-off. As the saying goes, insiders sell for all kinds of reasons, but they only buy for one.

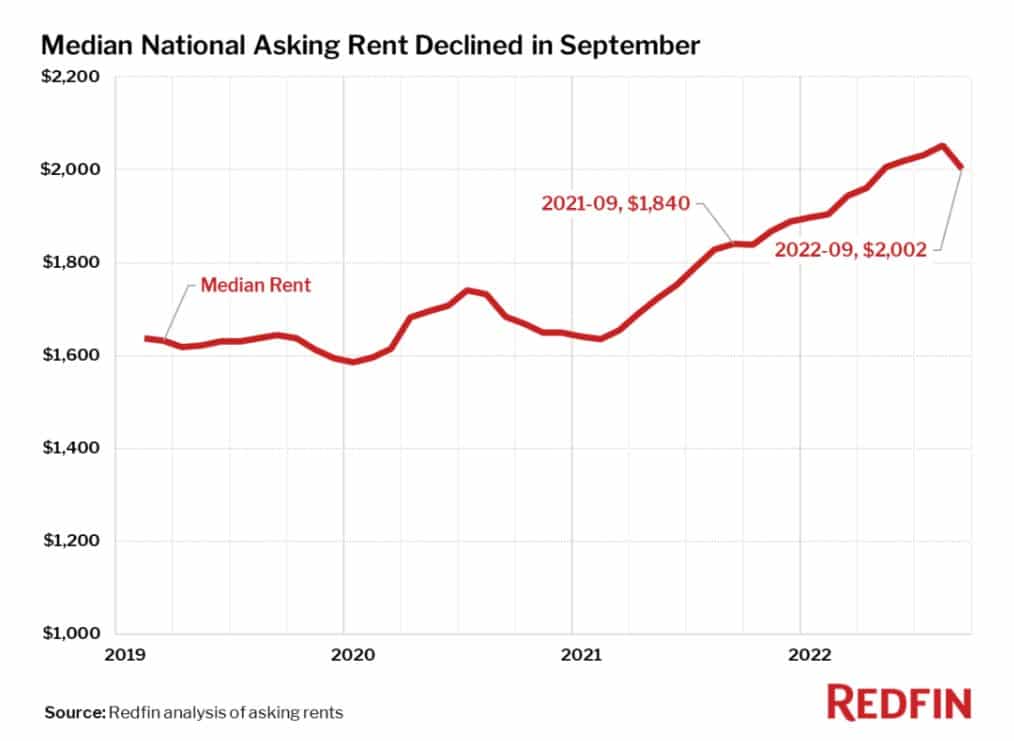
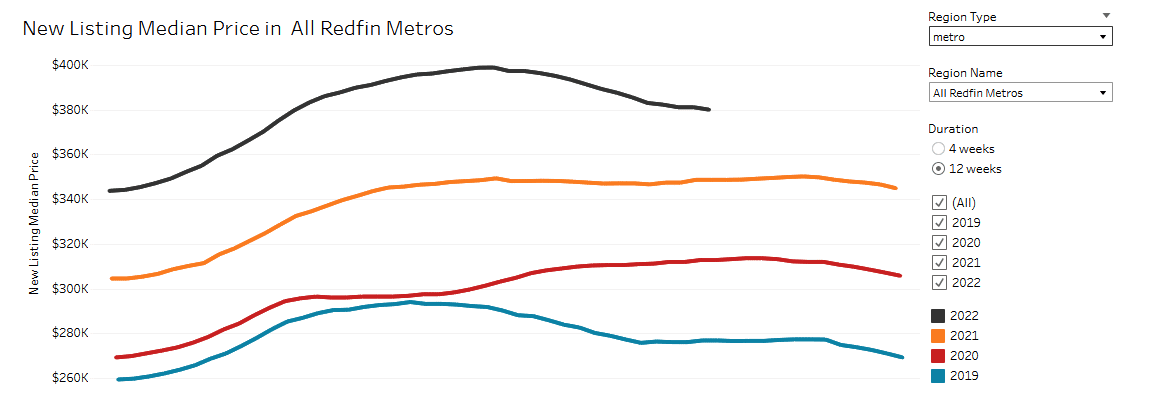
Rental and Home Prices are Turning Lower, Hopefully
The chart below from Redfin provides a glimpse of encouragement on the inflation front. After shooting higher over the last year, rental prices may finally retreat. While the decline is only one month, we suspect it will continue to follow housing prices lower. The second graph, also from Redfin, shows the median price of new home listings is still significantly elevated from prior years but declining. Home and rent prices are lagging indicators. Home sales and rental adjustments occur over long periods, taking time until the data reaches investors. As such, higher mortgage rates from the spring and summer are finally catching up with the housing market. As we noted earlier, it may take another few months before CPI recognizes the current state of the housing markets.
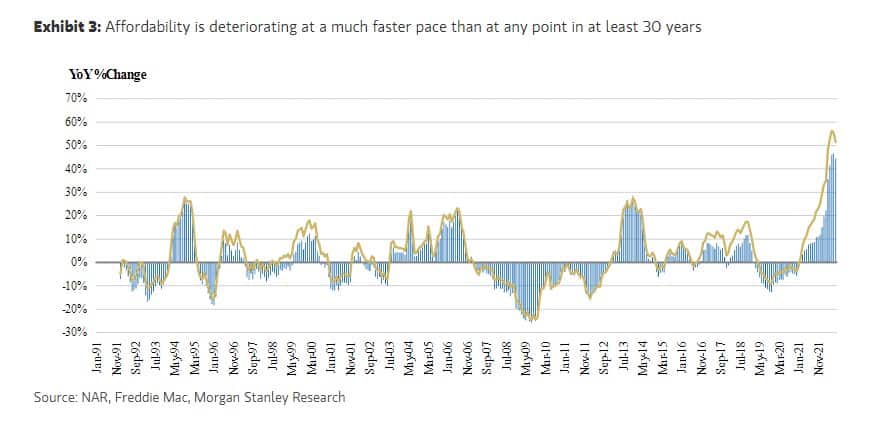
Housing Affordability Plummets
The graph below helps explain why rents and home prices have started falling. With mortgage rates at 7% and home prices up 20%+ over the last year, many potential buyers can not afford to buy a house. As we show, the change in housing affordability is the largest since at least 1991. Consumers’ sensitivity to higher rent is also becoming more acute, forcing renters to seek cheaper alternatives. Given the outsized role housing/shelter play in the GDP calculations, extreme housing affordability figures will lead to less economic activity and lower GDP. While this will be negative for GDP, it will help reduce inflation. The Fed has been open about the need to engineer a decline in shelter costs via higher interest rates.
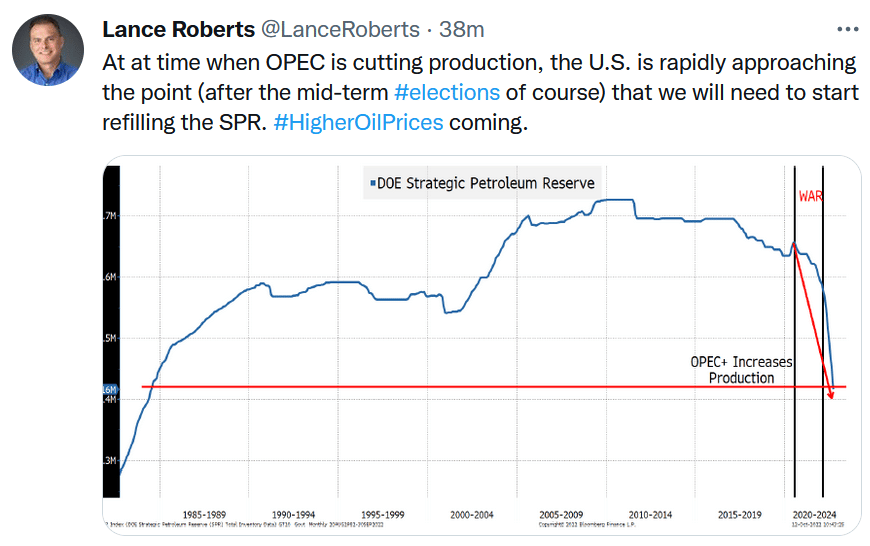
Tweet of the Day
Please subscribe to the daily commentary to receive these updates every morning before the opening bell.
If you found this blog useful, please send it to someone else, share it on social media, or contact us to set up a meeting.
Also Read


