Inside This Week’s Bull Bear Report
- Trump’s Tariffs Spark Market Volatility
- How We Are Trading It
- Research Report – The Risk Of Recession Is Not Zero
- Youtube – Before The Bell
- Market Statistics
- Stock Screens
- Portfolio Trades This Week
Market Volatility Spikes
Last week, we discussed the more extreme levels of bearishness that have gripped the markets as of late.
“In other words, while the media scrambled to align reasons with the sell-off, the correction was very much in line with seasonal tendencies. Crucially, that sell-off has pushed investor sentiment to levels typically equating to much deeper corrections. From a contrarian view, that extreme negative sentiment, now combined with oversold conditions, provides a good base for a rally in March.”
“Sentiment is approaching two standard deviations below its average level. Such levels are more coincident with market bottoms than the beginning of a corrective cycle. I have labeled some events along the way. The lesson is that headlines drive sentiment, and when sentiment becomes too negative, as may be the case today, such allows for rallies to form.”
The sentiment chart has been updated, showing that bearish sentiment reached even more profound levels of negativity and is more than two standard deviations below the norms.
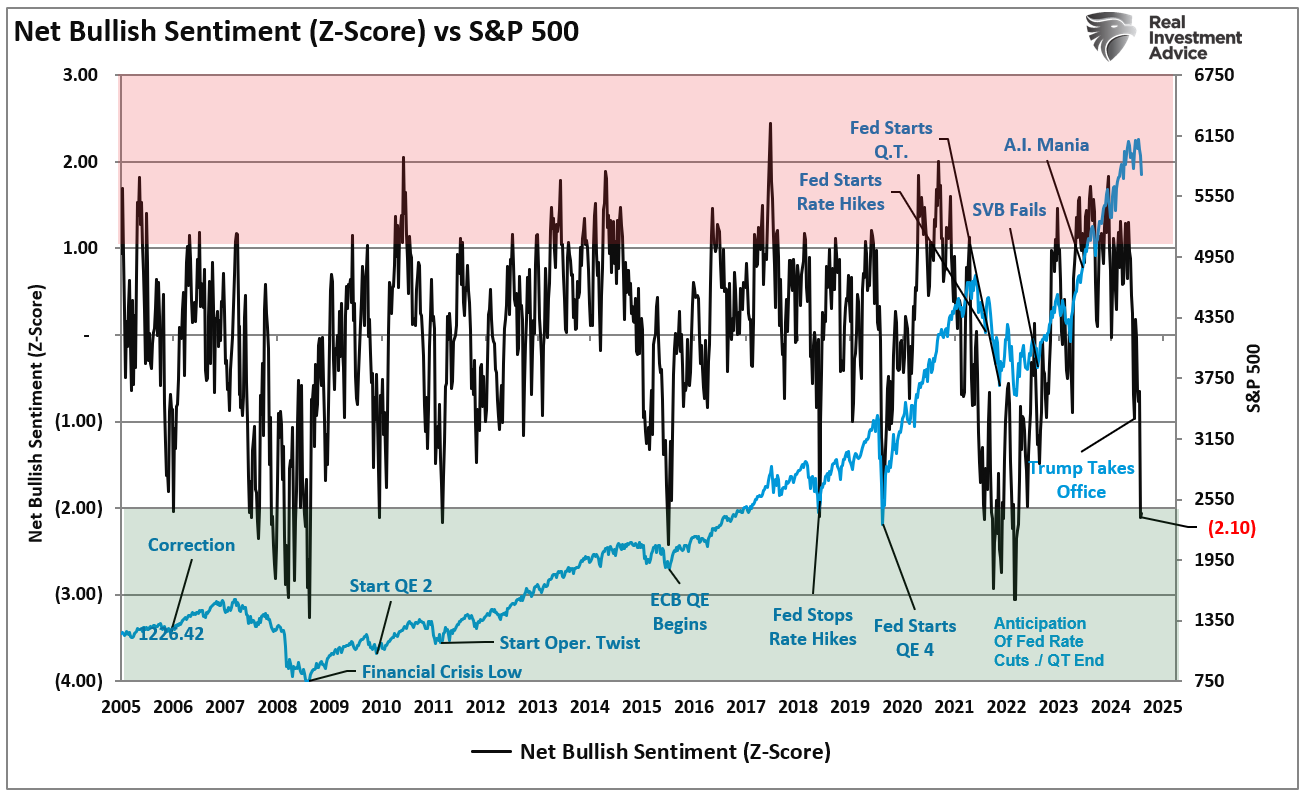
However, despite the deep levels of negativity, the current correction is well within the context of the volatility seen during Trump’s first term as he engaged in a trade with China. We will discuss this more momentarily.

While Trump’s tariffs and bearish headlines currently dominate investors’ psychology, we must remember that corrections are a normal market function. Yes, the market is down roughly 7% from the peak, but we have seen these corrections repeatedly in the past. That does NOT mean a more extensive corrective process is not potentially in process. It only implies that markets are likely in a position for a technical rally to reverse the more extreme oversold conditions.
The point is to remember how you felt during those corrections and what actions you took. Were they the correct actions? If they weren’t, then why are you potentially repeating past mistakes?
Volatility is the price we pay to invest. The hard part is avoiding volatility’s behavioral impacts on our investing outcomes.
Let’s review the previous history of Trump’s tariffs for clues as to where this market goes next.
Need Help With Your Investing Strategy?
Are you looking for complete financial, insurance, and estate planning? Need a risk-managed portfolio management strategy to grow and protect your savings? Whatever your needs are, we are here to help.

Trump’s Tariffs Spark Market Sell-Off
This past week, the market dropped to the 200-DMA after hitting all-time highs two weeks ago. Likewise, investor sentiment, as noted above, swung from bullish to bearish as concerns over Trump’s tariffs led to a repricing in the market. Such is unsurprising. As discussed in “Estimates Have Gone Parabolic,” the risk of disappointment is very high.
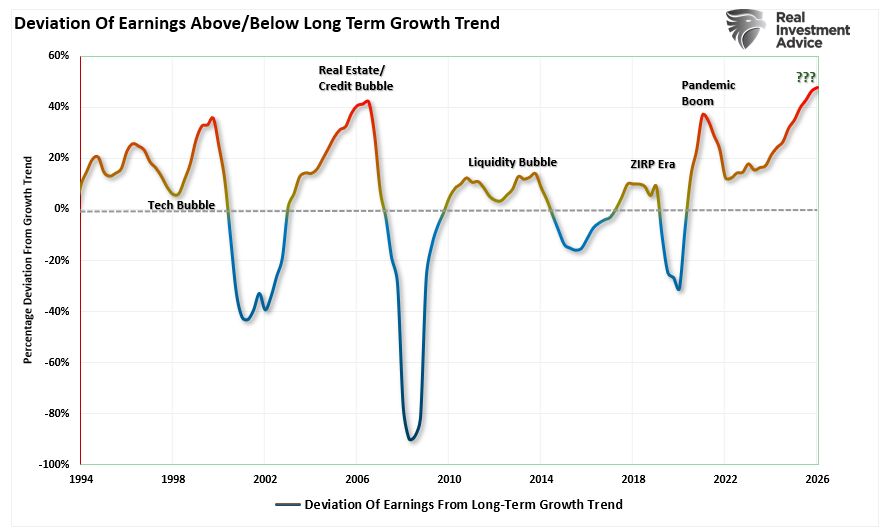
“While such a deviation may be sustainable short-term, historically, adverse economic impacts, be it a recession or an event-driven outcome, have reverted earnings toward their long-term trend. Again, this is because earnings can not indefinitely outgrow the economy, given the relationship of economic activity to revenue generation. The chart below shows Wall Street estimates’ current deviation from the long-term exponential growth trend. As stated, the current deviation is the most significant on record.”
Much weaker-than-expected economic data and Trump’s tariffs catalyzed that repricing.
Importantly, as we will discuss further, the impact of tariffs is not something we are unfamiliar with. More notably, the effects of Trump’s tariffs on the market and the economy are known factors from his first term. Currently, the markets act as if the tariffs will cause an unlimited decline in earnings and economic growth. Such is not the case. In reality, once the tariffs are set, the markets can calculate the likely impact of tariffs on earnings and economic growth and reassess valuations with a revised earnings outlook.
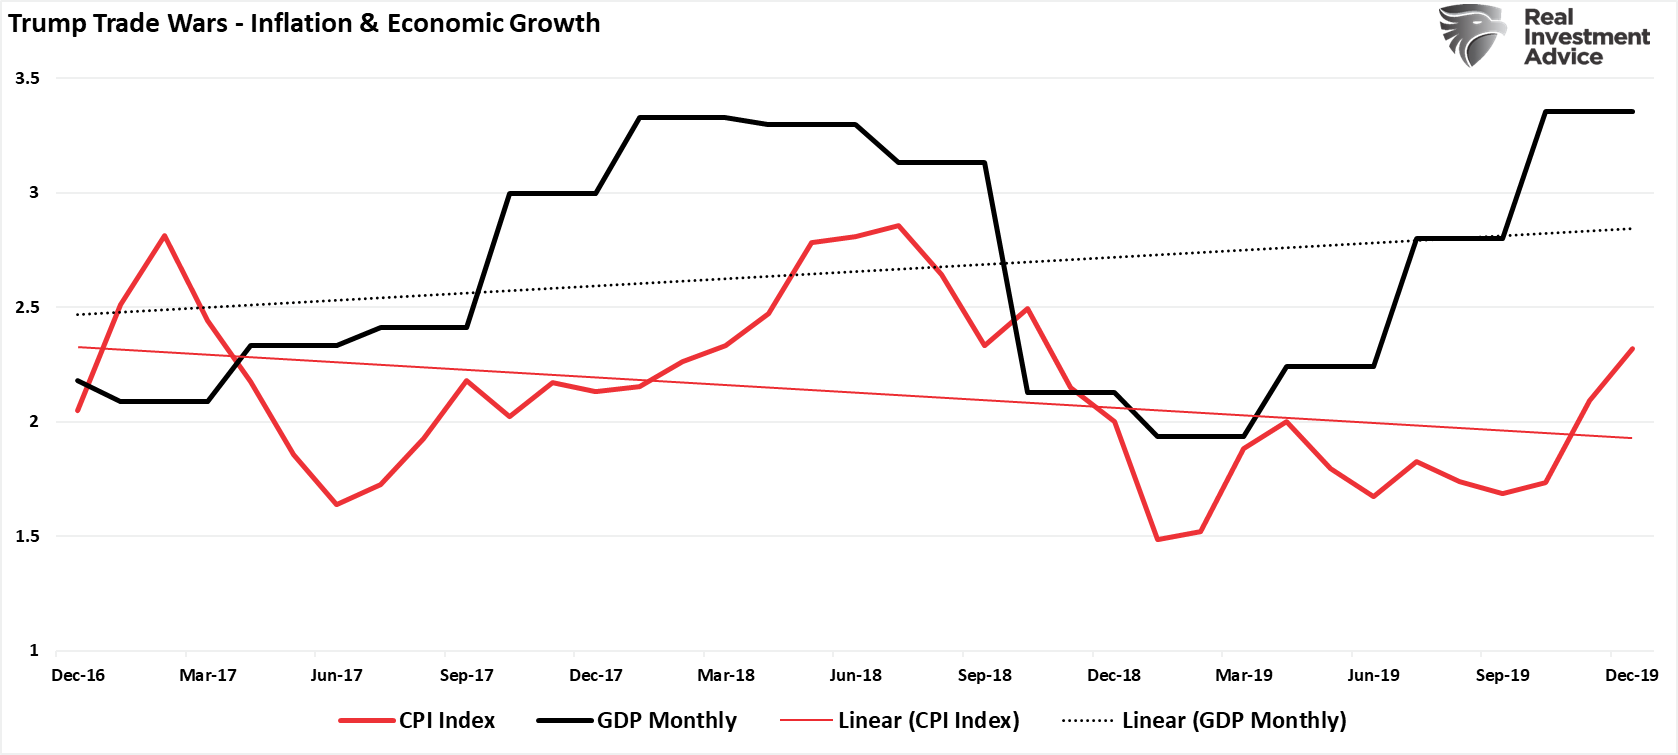
One of the driving media narratives is that tariffs will lead to an inflationary spike in the economy. However, during Trump’s trade war with China, not only did economic growth improve, but inflation declined.
Will this time be different? Possibly, as the economic backdrop is different. However, from an investment point of view, we can revisit Trump’s tariffs during his first term to assess what the impact on markets is likely to be later this year.
The History Of Trump’s Tariffs
For fun, I asked ChatGPT to review Trump’s previous “trade war” and the impact of tariffs on the stock market and volatility. Here is ChatGPT’s answer.
“Initially, the stock market is likely to react negatively to new tariffs, particularly in sectors heavily reliant on international trade. Higher import costs and the threat of retaliatory tariffs could weigh on investor sentiment, increasing uncertainty. The last major tariff escalation under Trump in 2018 resulted in sharp market corrections, as investors priced in the risk of slower global growth and corporate margin compression. If history repeats, a similar market reaction could occur, with cyclical sectors like industrials, technology, and consumer goods facing the most pressure.
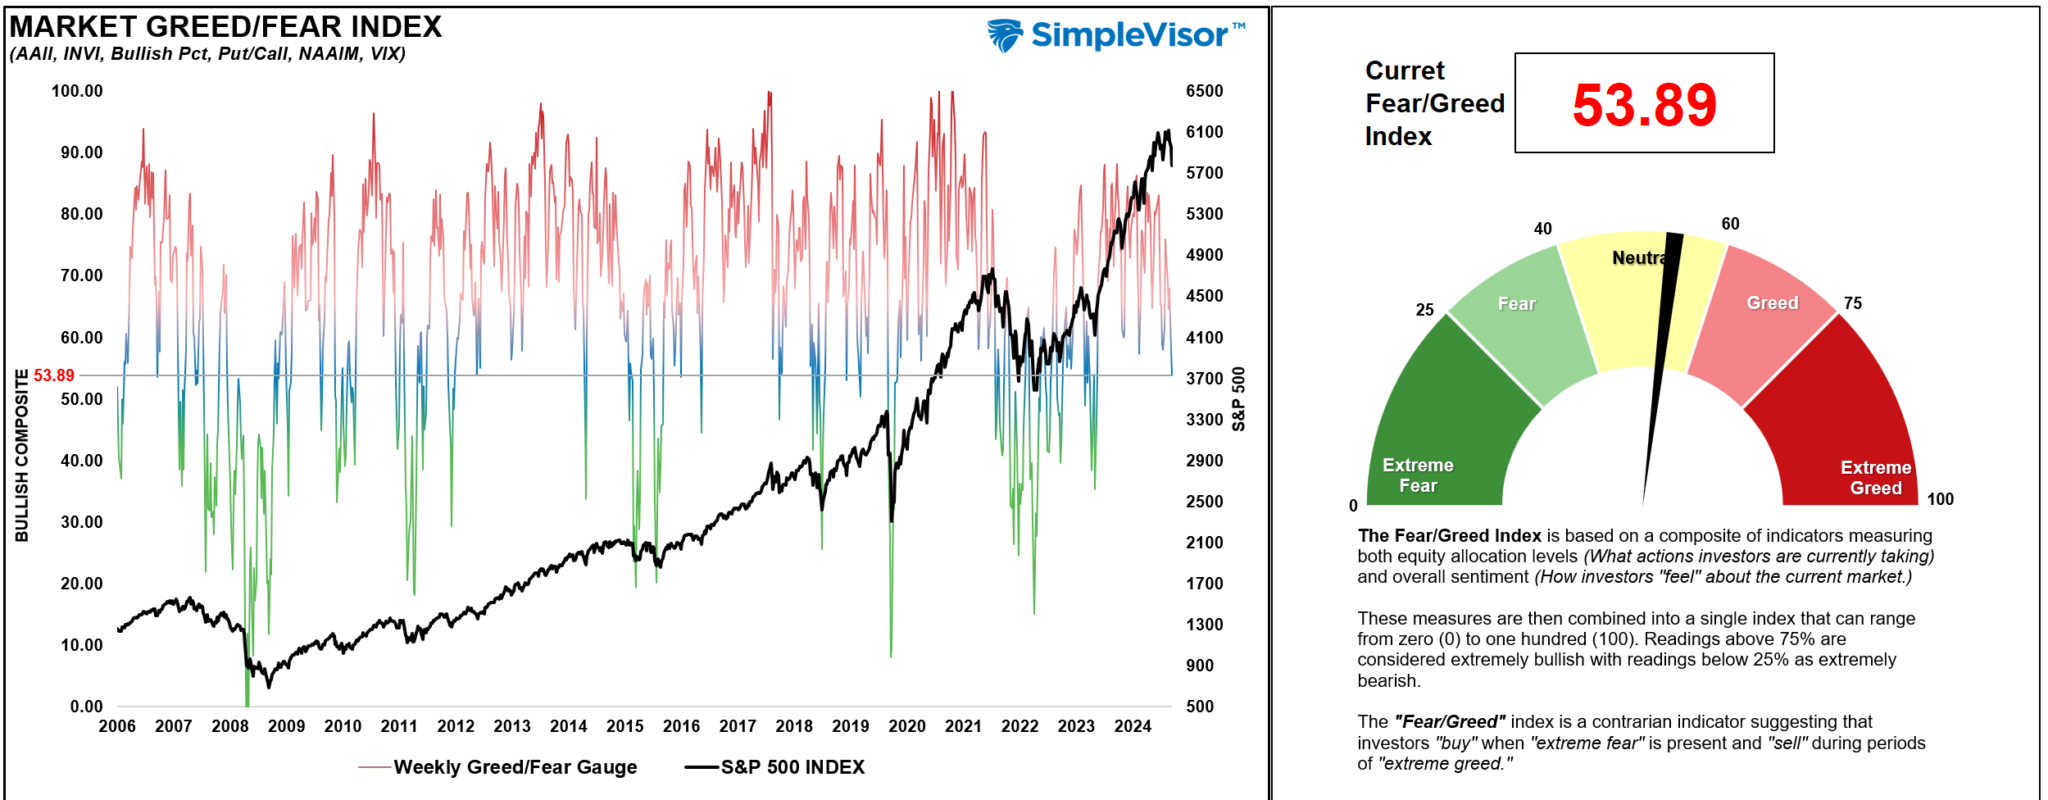
We previously discussed the “Tariff Turmoil” that rocked the markets. Since then, the narrative that Trump’s tariffs will cause the next major market crash has escalated, and fear has invaded investor sentiment. The CNN Fear/Greed Index is at extreme fear levels.

Maybe that is the case. There is always a possibility of “something breaking.” However, a different picture emerges from Trump’s first term in office.
Following the passage of the “Tax Cuts and Jobs Act,” the market surged to all-time highs. Valuations were elevated, and the Fed was beginning a rate-hiking campaign. At the same time, Trump launched the first escalation of the trade war with China. The market traded widely over the next 18 months but remained in a steady, higher linear growth trend.
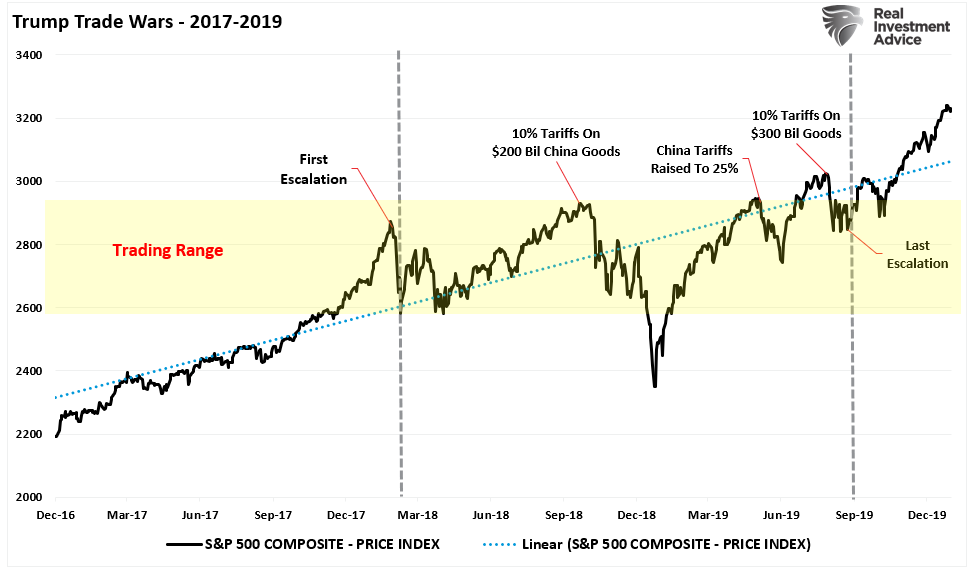
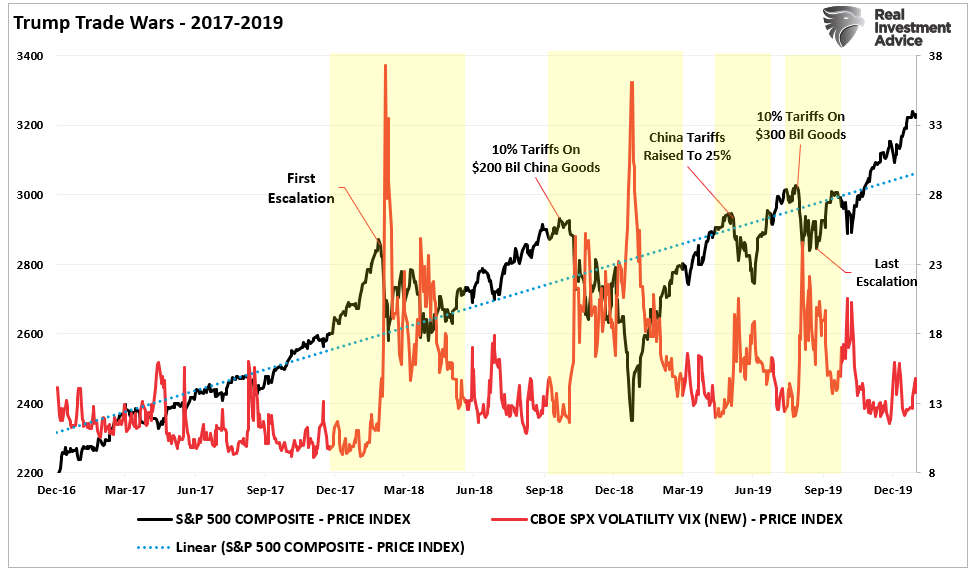
As noted in “Curb Your Enthusiasm,” this year may be very similar to what we saw during the first trade war with bouts of volatility. As shown, as different facets of the trade war developed, the impact of tariffs caused short-term volatility spikes as investors digested the actions and their potential ramifications on the market. However, those spikes in volatility were short-lived as the impact of tariffs was quickly absorbed.

Despite the barrage of negative headlines, concerns about inflationary impacts, and economic outcomes, the market ultimately weathered the trade war. As is often the case with more dire predictions, the worse potential outcomes failed to appear. There is no denying that the “trade war” did induce a significant amount of volatility, which made it difficult for investors to “stay the course.” However, in hindsight, we can now see that those spikes in volatility provided repeated buying opportunities for investors to pick up stocks at lower prices.
What is crucial to remember about market corrections is that when markets decline in price, it is “repricing” for a new outlook. In other words, the price decline resets the table for investors. For example:
At 6000 on the index, investors were willing to buy stocks based on $285/share in earnings by the end of 2026, setting a valuation at 21x earnings. However, tariffs could cause those earnings to decline to $260/share in 2026. Therefore, to achieve the same valuation of 21x earnings, markets need to reprice to 5460.
If that is the case, the recent market selloff may have adjusted forward valuations enough for investors to start looking for discounted ones.
The question, however, is, how much of an impact on corporate profits and earnings will it be?
Impact Of Tariffs On Corporate Earnings
While tariffs will likely increase volatility, the market will likely withstand that impact. However, the “this time is different” concern is due to the combined levels of overvaluation and high corporate earnings growth expectations.
Currently, expectations for earnings growth through 2026 are highly optimistic and have deviated from the long-term growth trend of earnings. (Read “Are Return Expectations Too High” for a more thorough discussion on the relationship between earnings and economic growth.)
When Trump took office during his first term, earnings expectations were below the long-term exponential growth trend. That is not the case today, leaving the market vulnerable to more significant disappointment. The same is true for both trailing and forward earnings valuations. On the most optimistic basis, using forward operating earnings, Trump entered his first term with the valuation at just 18x forward earnings. Today, the most hopeful form of valuation measures stands at 21.91x, one of the highest levels since 1985.

This background is crucial to our discussion of market risk from the impact of tariffs in the future.
The most immediate impact of tariffs will be on corporate earnings, as companies that rely on imports will face rising costs. Do not take that statement lightly. Currently, 41% of corporate revenue is derived from exporting goods and services. However, as noted above, the ability to pass those tariffs onto consumers is likely limited. As mentioned above, consumer inflation was not present to a great degree during our first experience with tariffs. However, there is a risk that tariffs could weaken consumer demand in a high-interest-rate and inflation-sensitive environment, which is undoubtedly different than Trump’s first term. Therefore, if companies cannot fully offset tariff-related costs, this could result in downward earnings revisions.
During Trump’s first term, the 3-month rate of change in earnings suggests there is a risk that companies fail to pass on tariffs to consumers. Again, this is why inflation fell, undermining the more bearish outlooks.

With valuations and earnings expectations significantly elevated, tariffs’ impact could lead to more significant disappointment in outlooks. As we saw previously, while tariffs did not lead to inflation or “stagflation,” they did induce more serious bouts of volatility and reduced market returns.
The risk of the same this time certainly seems plausible.
The following chart, however, is a model to denote the difference between a bullish trending market just going through a correction versus a market transitioning into a bear market. Using weekly data to reduce the daily price volatility, a clearer picture emerges. While there is evidence of market weakness, the current market conditions are short-term oversold and generally precede reflexive rallies. Notably, the longer-term moving averages, key to identifying the 2022 bear market and the reversal to a bull market into 2023, remain bullish for now.

It is crucial to understand the technical difference between bull and bear markets.
The Difference Between Bull And Bear Markets
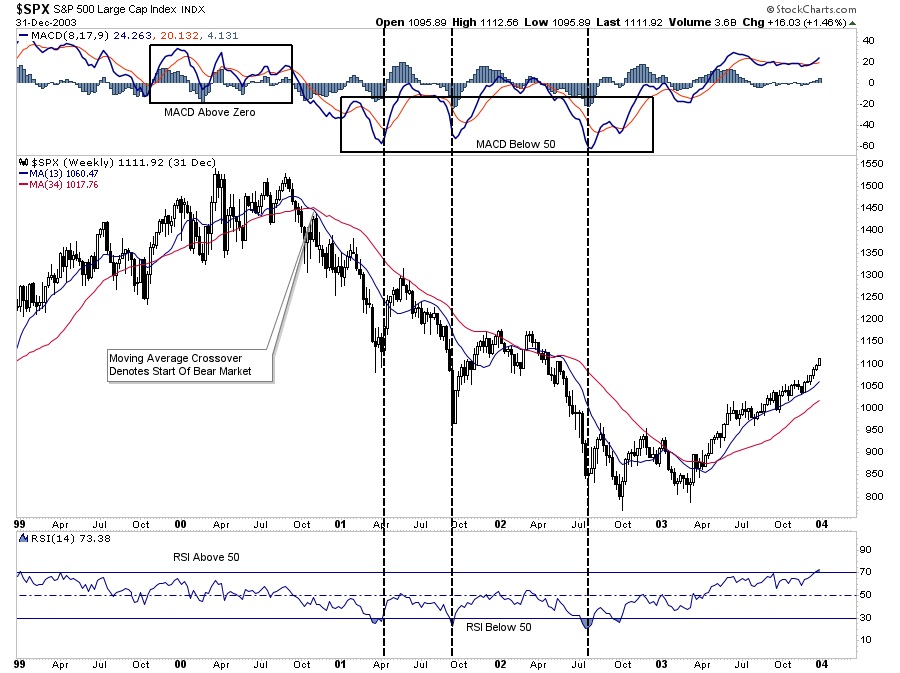
During bull markets, relative strength tends to oscillate between 50 and 100, while the momentum, as measured by the MACD indicator, tends to stay above 50. The opposite is true in bear markets. During bull markets, buying opportunities tend to exist when corrections push indicators toward the lower levels of their weekly readings. Bear markets provide buying opportunities at the lowest levels.
However, the most critical indicator is the weekly moving average crossover. That crossover historically has been a strong indication that portfolios should become more “risk-off” positioned until that signal reverses. The crossover dictates the change in the market from a bullish to a bearish trend.
The charts below show the previous bear markets. Despite lots of volatility in late 1999, the signal to exit the market did not occur until October. Furthermore, even if you failed to exit at that signal, deep oversold conditions during 2001 provided decently counter-trend rallies to exit positioning as needed.
1999
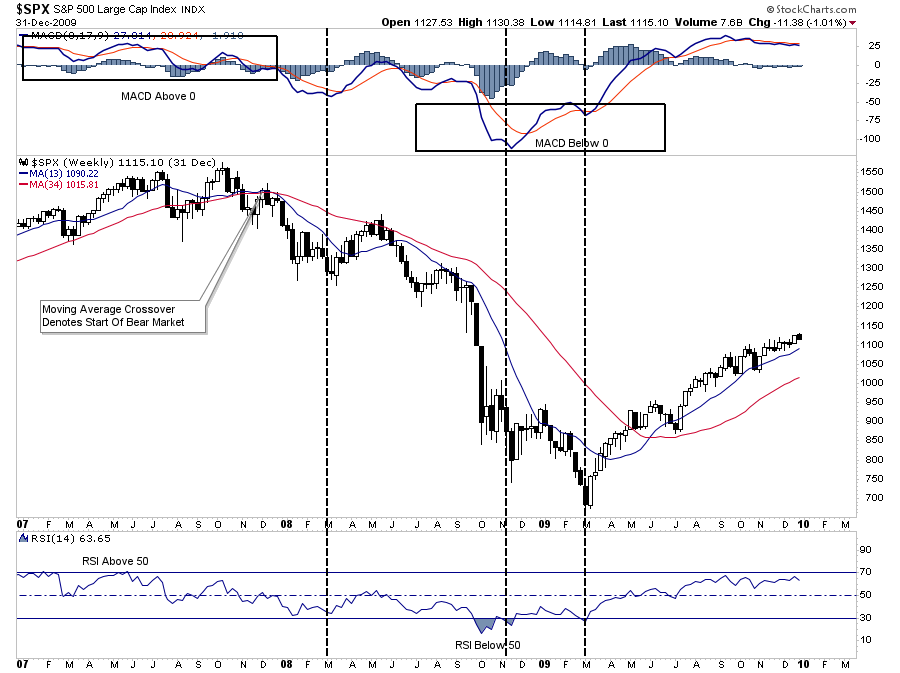
We see the same leading up to the financial crisis. During late 2007, plenty of warning signs showed the market was topping. In late 2007, the market triggered a trend reversal signal with the moving average crossover. While the market declined in early 2008 as Bear Stearns failed, an oversold counter-trend rally from April to June provided an exit point to reduce exposure. Conversely, while volatile and painful, the deep oversold readings in November and March provided deep oversold opportunities to increase equity exposures.
2008
In 2022, after a feverish advance in 2021, the market signaled a trend change in March. The market then provided two more counter-trend rallies to reduce exposure during the year.
2022
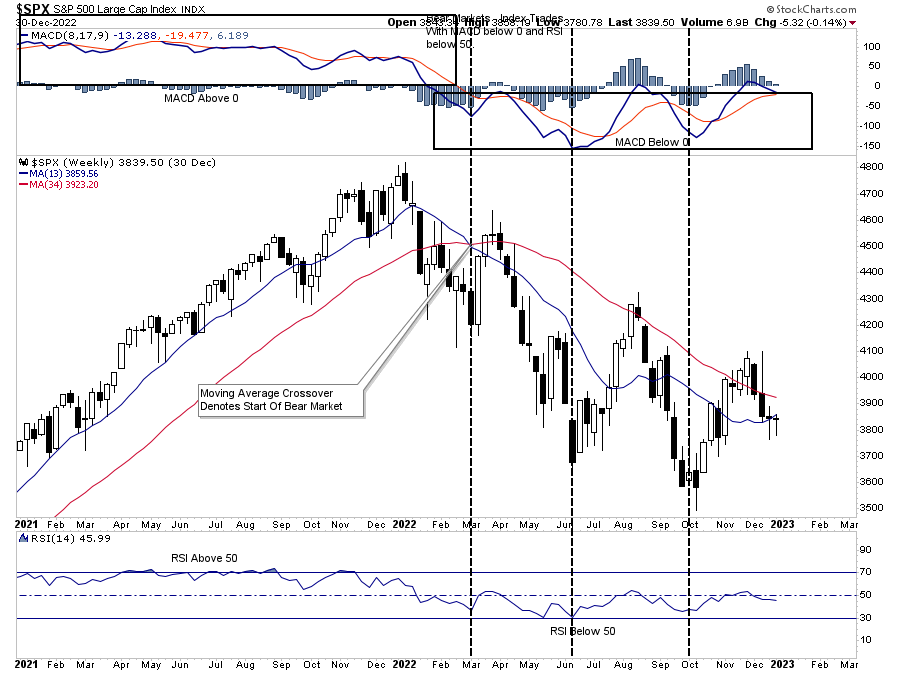
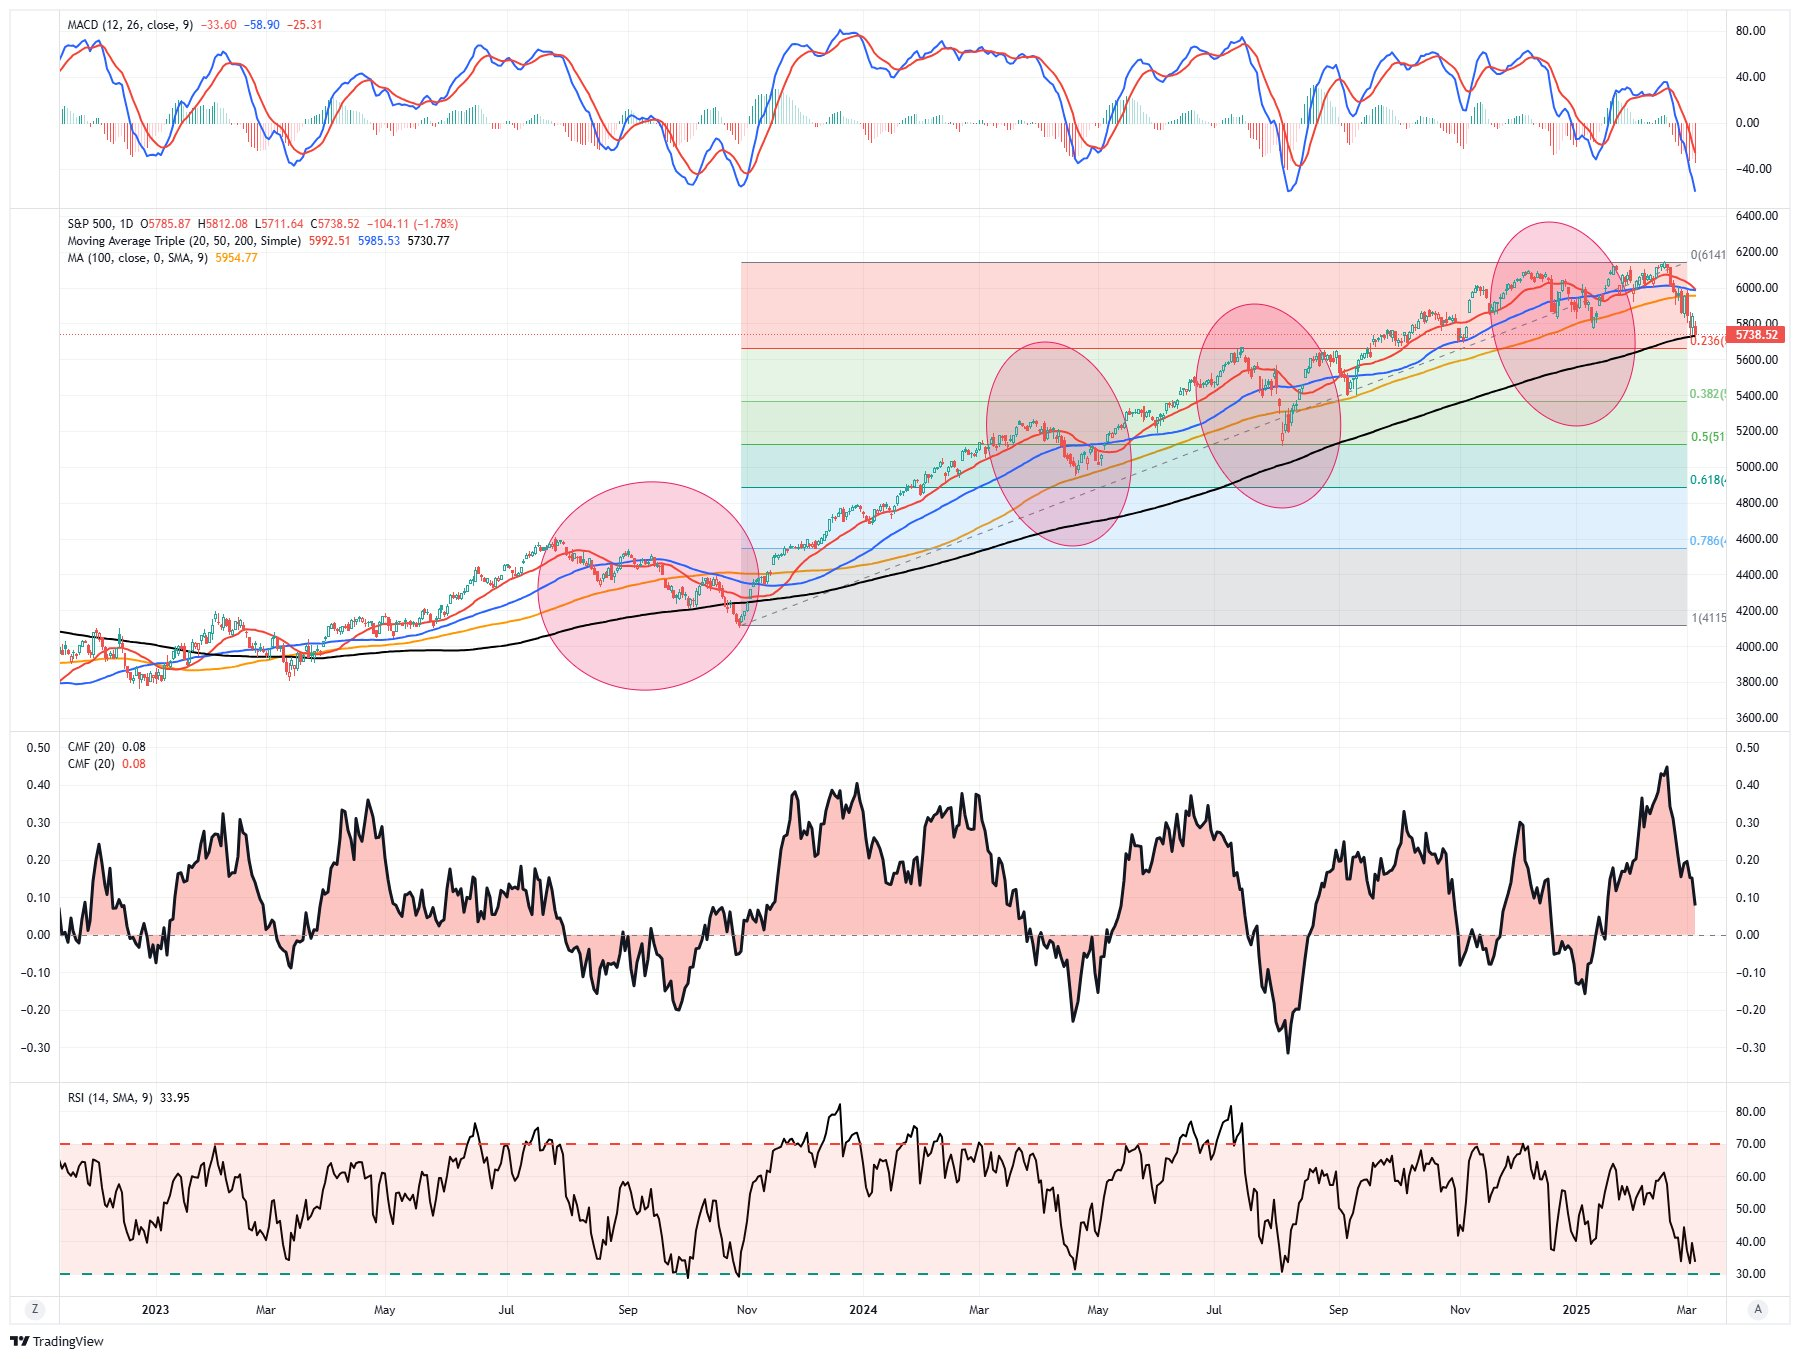
Where are we currently in 2025? First, while short-term oversold, all indicators remain in a “bull market” trend. Could that be changing? Yes. It will take time to tell. However, the most crucial indicator, the moving average crossover, has not signaled a trend reversal as of yet. Such should keep equity exposures elevated for a while longer. However, when the trend signal occurs, the market will likely be deeply oversold enough to provide a counter-trend rally to sell into.
2025

The message is that while headlines and sentiment are getting very bearish, the bull market remains technically intact. Will that eventually change? Yes. When it does, we will reduce equity exposures more aggressively. However, that is not the case for now, and trying to “guess” when it will happen often leads to many investing mistakes.
Continue to manage risk accordingly, but it is likely too soon to become overly bearish.
How We Are Trading It
We don’t have much history regarding tariffs and the stock market. However, avoiding media-driven narratives and focusing on managing your portfolio is likely best. As we warned previously, media headlines are often wrong.
“That does not mean that things won’t change in the future. However, using media headlines to make portfolio decisions has repeatedly turned out poorly. If the recent market volatility is weighing on you, and you “feel” you must “do something,” take very small steps.”
- Tighten up stop-loss levels to current support levels for each position.
- Hedge portfolios against significant market declines.
- Take profits in positions that have been big winners
- Sell laggards and losers
- Raise cash and rebalance portfolios to target weightings.
“Remembering that portfolio management is not an “all or none” process is crucial. It is about positioning yourself to minimize emotional decisions so you can find the “opportunity that exists in crisis.”
The markets are deeply oversold, sentiment is bearish, and sellers are exhausted. Such is historically a good setup for a rally to sell into, reduce risk, and prepare for what might be a more volatile market.
Feel free to reach out if you want to navigate these uncertain waters with expert guidance. Our team specializes in helping clients make informed decisions in today’s volatile markets.
Have a great week.
Research Report
Subscribe To “Before The Bell” For Daily Trading Updates
We have set up a separate channel JUST for our short daily market updates. Please subscribe to THIS CHANNEL to receive daily notifications before the market opens.
Click Here And Then Click The SUBSCRIBE Button
Subscribe To Our YouTube Channel To Get Notified Of All Our Videos
Bull Bear Report Market Statistics & Screens

SimpleVisor Top & Bottom Performers By Sector

S&P 500 Weekly Tear Sheet

Relative Performance Analysis
Over the last week, stocks struggled amid increased policy uncertainty from the White House. “Tariff on, Tariff off” makes it difficult for investors to assess the impact on future earnings growth. The market is a mixed bag of performers at the moment as it has rotated wildly between sectors. International and Emerging markets are overbought, suggesting investors should take some profits, while discretionary, technology, and financials are oversold. I expect a rotation starting next week with a rebound in those oversold markets.

Technical Composite
The technical overbought/sold gauge comprises several price indicators (R.S.I., Williams %R, etc.), measured using “weekly” closing price data. Readings above “80” are considered overbought, and below “20” are oversold. The market peaks when those readings are 80 or above, suggesting prudent profit-taking and risk management. The best buying opportunities exist when those readings are 20 or below.
The current reading is 28.94 out of a possible 100.

Portfolio Positioning “Fear / Greed” Gauge
The “Fear/Greed” gauge is how individual and professional investors are “positioning” themselves in the market based on their equity exposure. From a contrarian position, the higher the allocation to equities, the more likely the market is closer to a correction than not. The gauge uses weekly closing data.
NOTE: The Fear/Greed Index measures risk from 0 to 100. It is a rarity that it reaches levels above 90. The current reading is 62.50 out of a possible 100.
Relative Sector Analysis

Most Oversold Sector Analysis

Sector Model Analysis & Risk Ranges
How To Read This Table
- The table compares the relative performance of each sector and market to the S&P 500 index.
- “MA XVER” (Moving Average Crossover) is determined by the short-term weekly moving average crossing positively or negatively with the long-term weekly moving average.
- The risk range is a function of the month-end closing price and the “beta” of the sector or market. (Ranges reset on the 1st of each month)
- The table shows the price deviation above and below the weekly moving averages.
As noted last week:
“One of the early warning indicators the risk-range report provides is the moving average crossover (last column) of intermediate and long-term measures. A few months ago, only bonds and international traded on bearish crossovers. Since then, we have sharply increased the number of bearish crossovers in various sectors and markets. Such suggests an ongoing deterioration in price action in the markets, which has yet to spill over into the S&P 500 completely. While this does not mean that investors should immediately become bearish, it does suggest that risks are building for a more substantial market correction at some point if these sub-markets do not start to improve soon.”
As the markets continued deteriorating, the number of bearish crossovers increased from 9 to 12 this week. Markets are oversold enough for a decent reflexive rally to ensue. However, there is an increasing weight of evidence that a more protracted correction process may be getting underway.

Weekly SimpleVisor Stock Screens
We provide three stock screens each week from SimpleVisor.
This week, we are searching for the Top 20:
- Relative Strength Stocks
- Momentum Stocks
- Fundamental & Technical Strength W/ Dividends
(Click Images To Enlarge)
RSI Screen

Momentum Screen

Technically Strong With Dividends

SimpleVisor Portfolio Changes
We post all of our portfolio changes as they occur at SimpleVisor:
Mar 4th
“We are starting to rebalance the Equity and ETF portfolios today. Over the next few days to weeks, we will continue rebalancing positions in the models closer to their target weights. Over the last several weeks, there has been a significant rotation into value out of growth. With positioning in both factors now off-side, a reversal of performance is becoming significantly more likely. As is always the case, we are starting slow and will opportunistically continue to rebalance as needed.”
Equity Model
- Reducing Eli Lilly (LLY) and Abbvie (ABBV) to portfolio target weights of 3.5% and 5%, respectively.
- Increase Microsoft (MSFT) and Google (GOOG) to portfolio target weights of 3.5% and 4%, respectively.
ETF Model
- Sell 100% of the Semiconductor ETF (SMH)
- Increase the Megacap Growth ETF (MGK) to 3% of the portfolio.
- Reduce the Staples ETF (XLP) to 7% of the portfolio
Mar 5th
“As noted yesterday, given the recent market decline, we continue to tax loss harvest and rebalance portfolios. Oil has declined markedly, which is reducing inflationary pressures. Still, given the Trump Administration’s plans to “drill baby drill,” such suggests oil prices could decline further from an increase in supply. Therefore, we are selling the remaining positions in ExxonMobil (XOM) and DiamondBack Energy (FANG) to harvest the loss for tax purposes. We will rebuy these positions opportunistically in the future.
In the ETF Model, we are selling all of the iShares Energy ETF (XLE).
We are adding to Palantir (PLTR) to increase the position to target weight after the recent pullback, along with Nvidia (NVDA). Both positions are trading substantially cheaper than they were and are decently oversold, reducing our entry risk.”
Equity Model
- Sell 100% of Exxon Mobil (XOM) and DiamondBack Energy (FANG)
- Increase Palantir (PLTR) and Nvidia (NVDA) to their target weights of 2% each.
ETF Model
- Sell 100% of iShares Energy ETF (XLE)
Lance Roberts, C.I.O., RIA Advisors

