
Economic and inflation forecasts have a highly significant impact on treasury bond yields. Therefore, one would suspect that their yields would follow a linear trend as the maturity lengthens on Treasury securities. For example, if current expectations were for high growth and higher than normal inflation but long-term expectations were contrary, one would expect a downward sloping yield curve, i.e., higher yields for shorter maturities and lower yields for longer maturities. One would not expect the economic and inflation forecast for 8 years to differ from the average of 7 and 9-year forecasts.
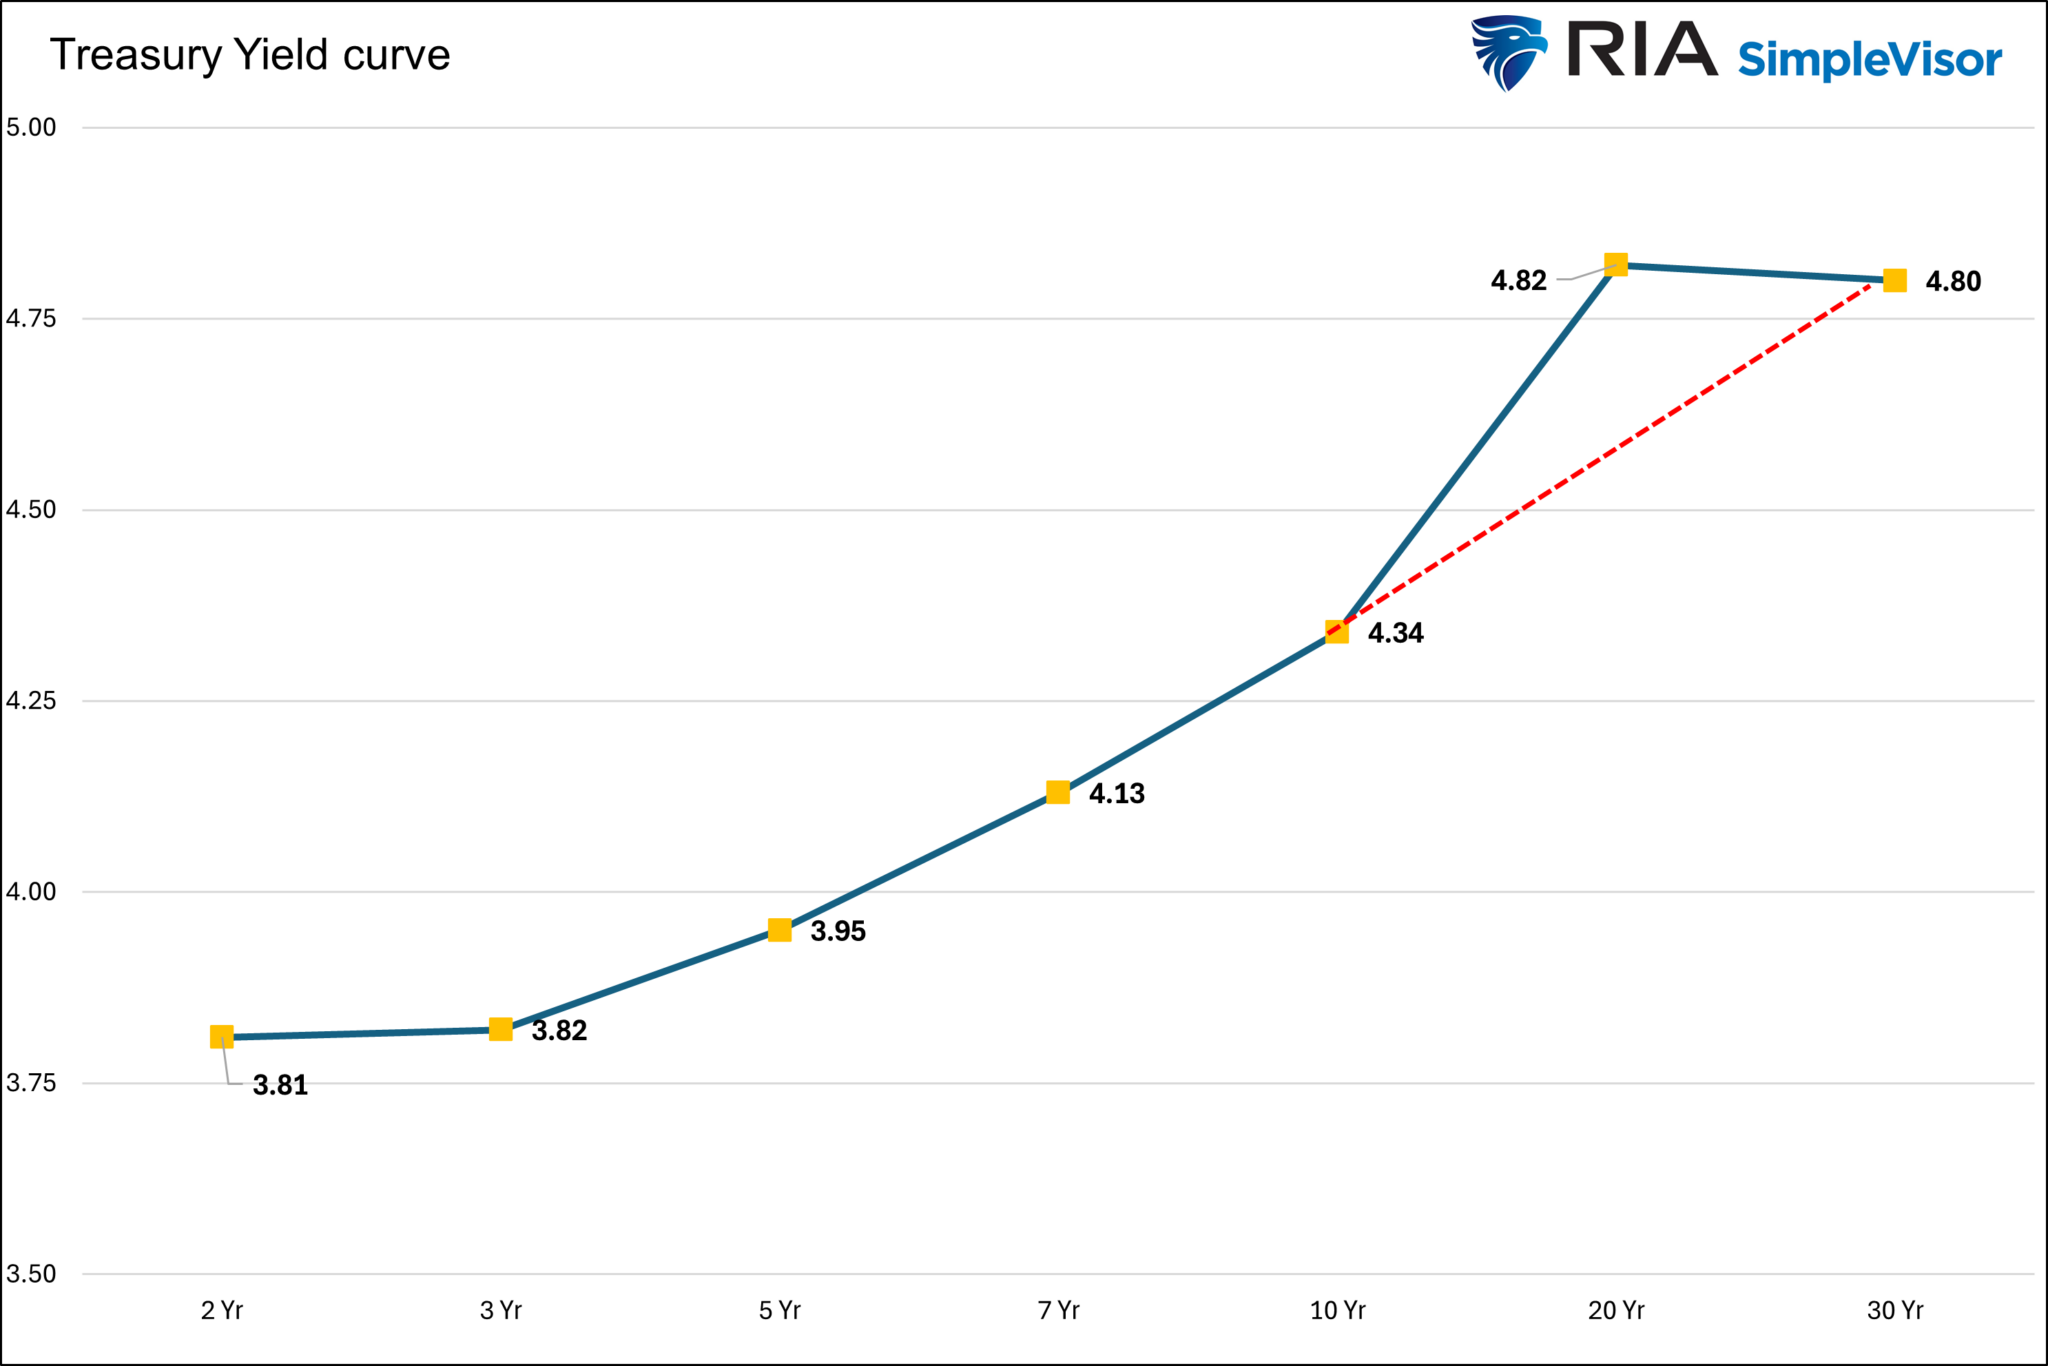
While economic forecasts impact the shape of the yield curve, there is another key factor. That is liquidity. In other words, instead of yields following a linear or logarithmic trend based on economic and inflation expectations, kinks in the yield curve appear for “off-the-run bonds.” These bonds are not recently issued and do not have standard maturities, like two, three, five, ten, and thirty years. Because of liquidity, these bonds will often trade at higher yields than surrounding “on the run bonds.” While off-the-run bond liquidity is outstanding for small investors and most investment advisors, large mutual funds and banks need excess liquidity. Thus, they require a premium yield for less liquid off-the-run bonds.
The graph below highlights the kink in 20-year yields. As it shows, the 20-year bond trades about 20- 25 bps above the interpolated yield between 10-year and 30-year bonds. For those, like ourselves, who do not need excess liquidity, the kink is an opportunity to pick up additional yield. Moreover, for those looking at a long hold timeframe, the off-the-run bonds age to become on-the-run bonds, thus allowing investors to monetize the kink.
What To Watch Today
Earnings

Economy

Market Trading Update
Yesterday, we discussed the market’s recent rebound from the lows. Notably, while the markets are still struggling, as expected given the overall pressure on the equity markets from concerns over tariffs, the valuation reversion so far has been entirely a function of the price decline.
Over the weekend, I downloaded the latest earnings estimates for the S&P 500 from S&P Global (the purveyors of the benchmark index), and the findings were quite surprising. As of April 15th, S&P revised its 2026 year-end targets higher to $292/share from $283/share in March. This upward revision comes after the recent tariff announcements, market declines, and falling economic outlooks.
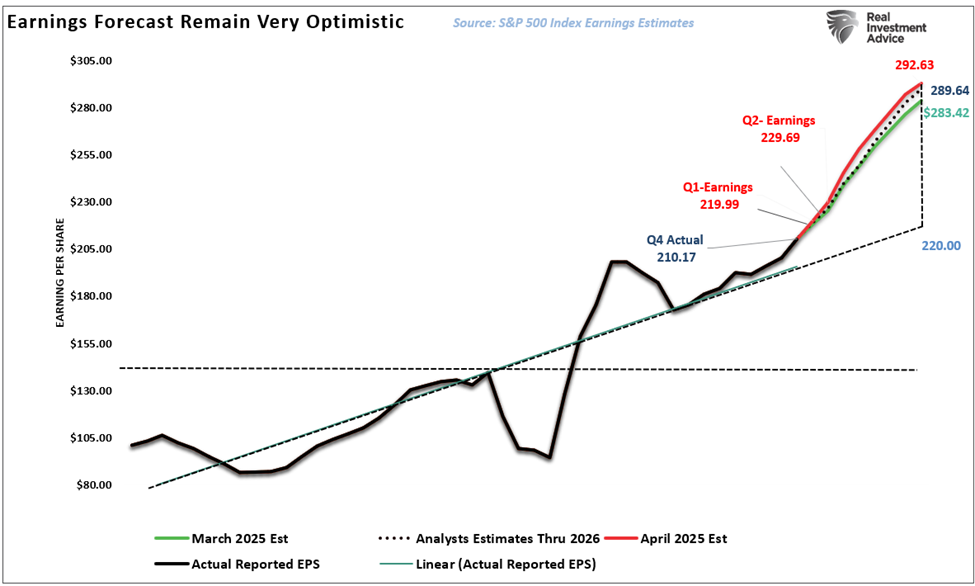
While I don’t necessarily see the logic behind their optimism, it nonetheless applies significant downward pressure on valuations, as the decline in the “P” is being assisted by the rise in the “E.” Currently, trailing GAAP valuations have declined to 22x earnings, which is the median market valuation since 2007. If the market declines further without earnings estimates falling, valuations will become more compelling from an investment perspective.

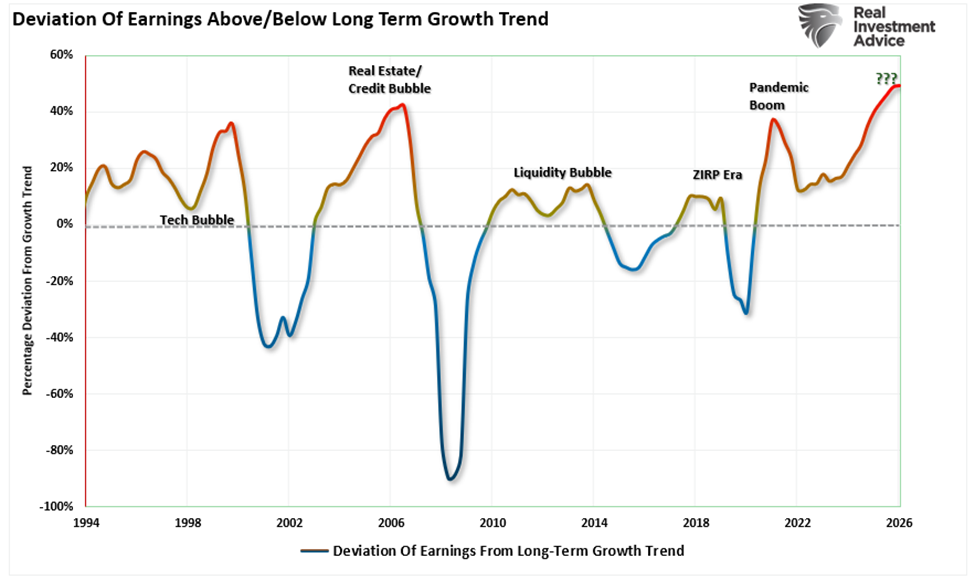
However, given the impact of tariffs as a tax on the consumer, significantly reduced savings rates, and slowing economic data, we find it challenging to be as optimistic about earnings. All those factors will ultimately impact demand, which is where corporate revenues are derived from. Given the massive deviation of earnings estimates from their long-term exponential growth trend, it is hard not to think that a reversion to the mean is eventually coming.
As we enter the heart of earnings season this week and next, some resolution to the exuberance of earnings estimates should be expected. The good news, however, is that after next week, stock buybacks will return to the market, which will provide some near-term relief from the recent selling pressure.
Stay tuned.

The Shifting Of The Absolute And Relative SV Curves
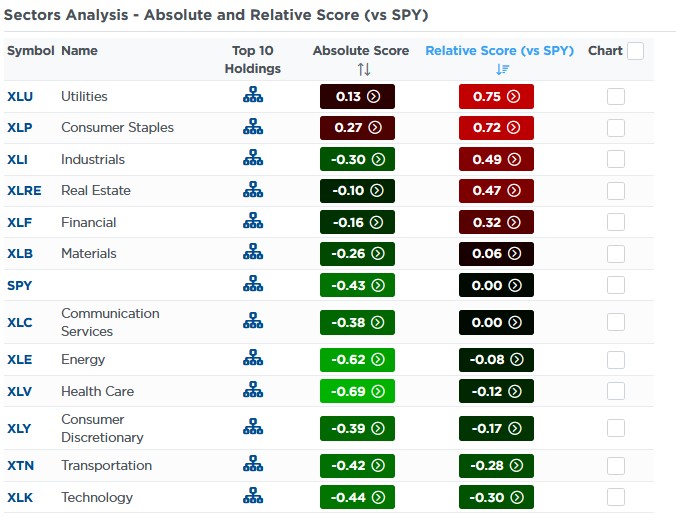
The SimpleVisor absolute and relative analysis shows that the market sectors and factors are returning to fair value after being very oversold. For instance, last week’s analysis showed that the transportation and technology sectors were very oversold with relative scores of -65 and -53, respectively. Its absolute scores were similarly oversold at -60 and -74. As shown below, they remain oversold but at more moderate relative scores of -30 (technology) and -28 (transportation). Their respective absolute scores are also heading back toward fair value. Such moderation is healthy and natural.
The second graphic compares the factor scores from yesterday to two weeks ago. Two weeks ago, the factors were scattered across the relative score (Y-axis) and pinned to the left side of the absolute score (X-axis). In other words, almost everything was oversold, but some factors were over- or underperforming the S&P 500. Since then, the absolute scores have shifted to the right, and more factors are overbought compared to the S&P 500.

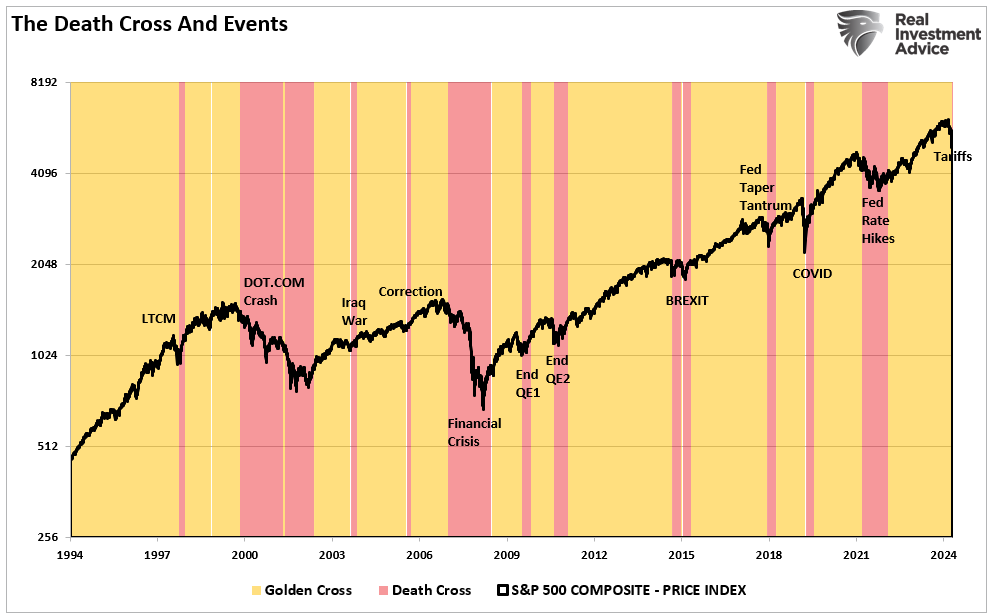
The Death Cross And Market Bottoms
In financial markets, few technical patterns generate as much attention and anxiety as the death cross. This ominous-sounding term refers to a crossover on a price chart when a short-term moving average, most commonly the 50-day moving average (50-DMA), drops below a long-term moving average, usually the 200-day moving average (200-DMA). The “death cross” is a fantastic headline for the media to generate clicks and views. However, for investors, the “death cross” signals a market correction and suggests a more cautious investing approach. But there are a few questions we must answer.
- What does the death cross mean?
- How reliable is it as an indicator?
- And how should investors respond when they see it?
Let’s answer those questions by exploring the death cross’s history, data, and interpretations, and explaining why context matters more than the signal itself.
Tweet of the Day
“Want to achieve better long-term success in managing your portfolio? Here are our 15-trading rules for managing market risks.”
Please subscribe to the daily commentary to receive these updates every morning before the opening bell.
If you found this blog useful, please send it to someone else, share it on social media, or contact us to set up a meeting.

