
ZeroHedge carried a line this week from Goldman Sachs’ Delta One desk worth consideration:
The point at which hyperscalers shift from needing more capacity at almost any cost to optimizing returns on what they’ve already built is the one I’d really worry about.
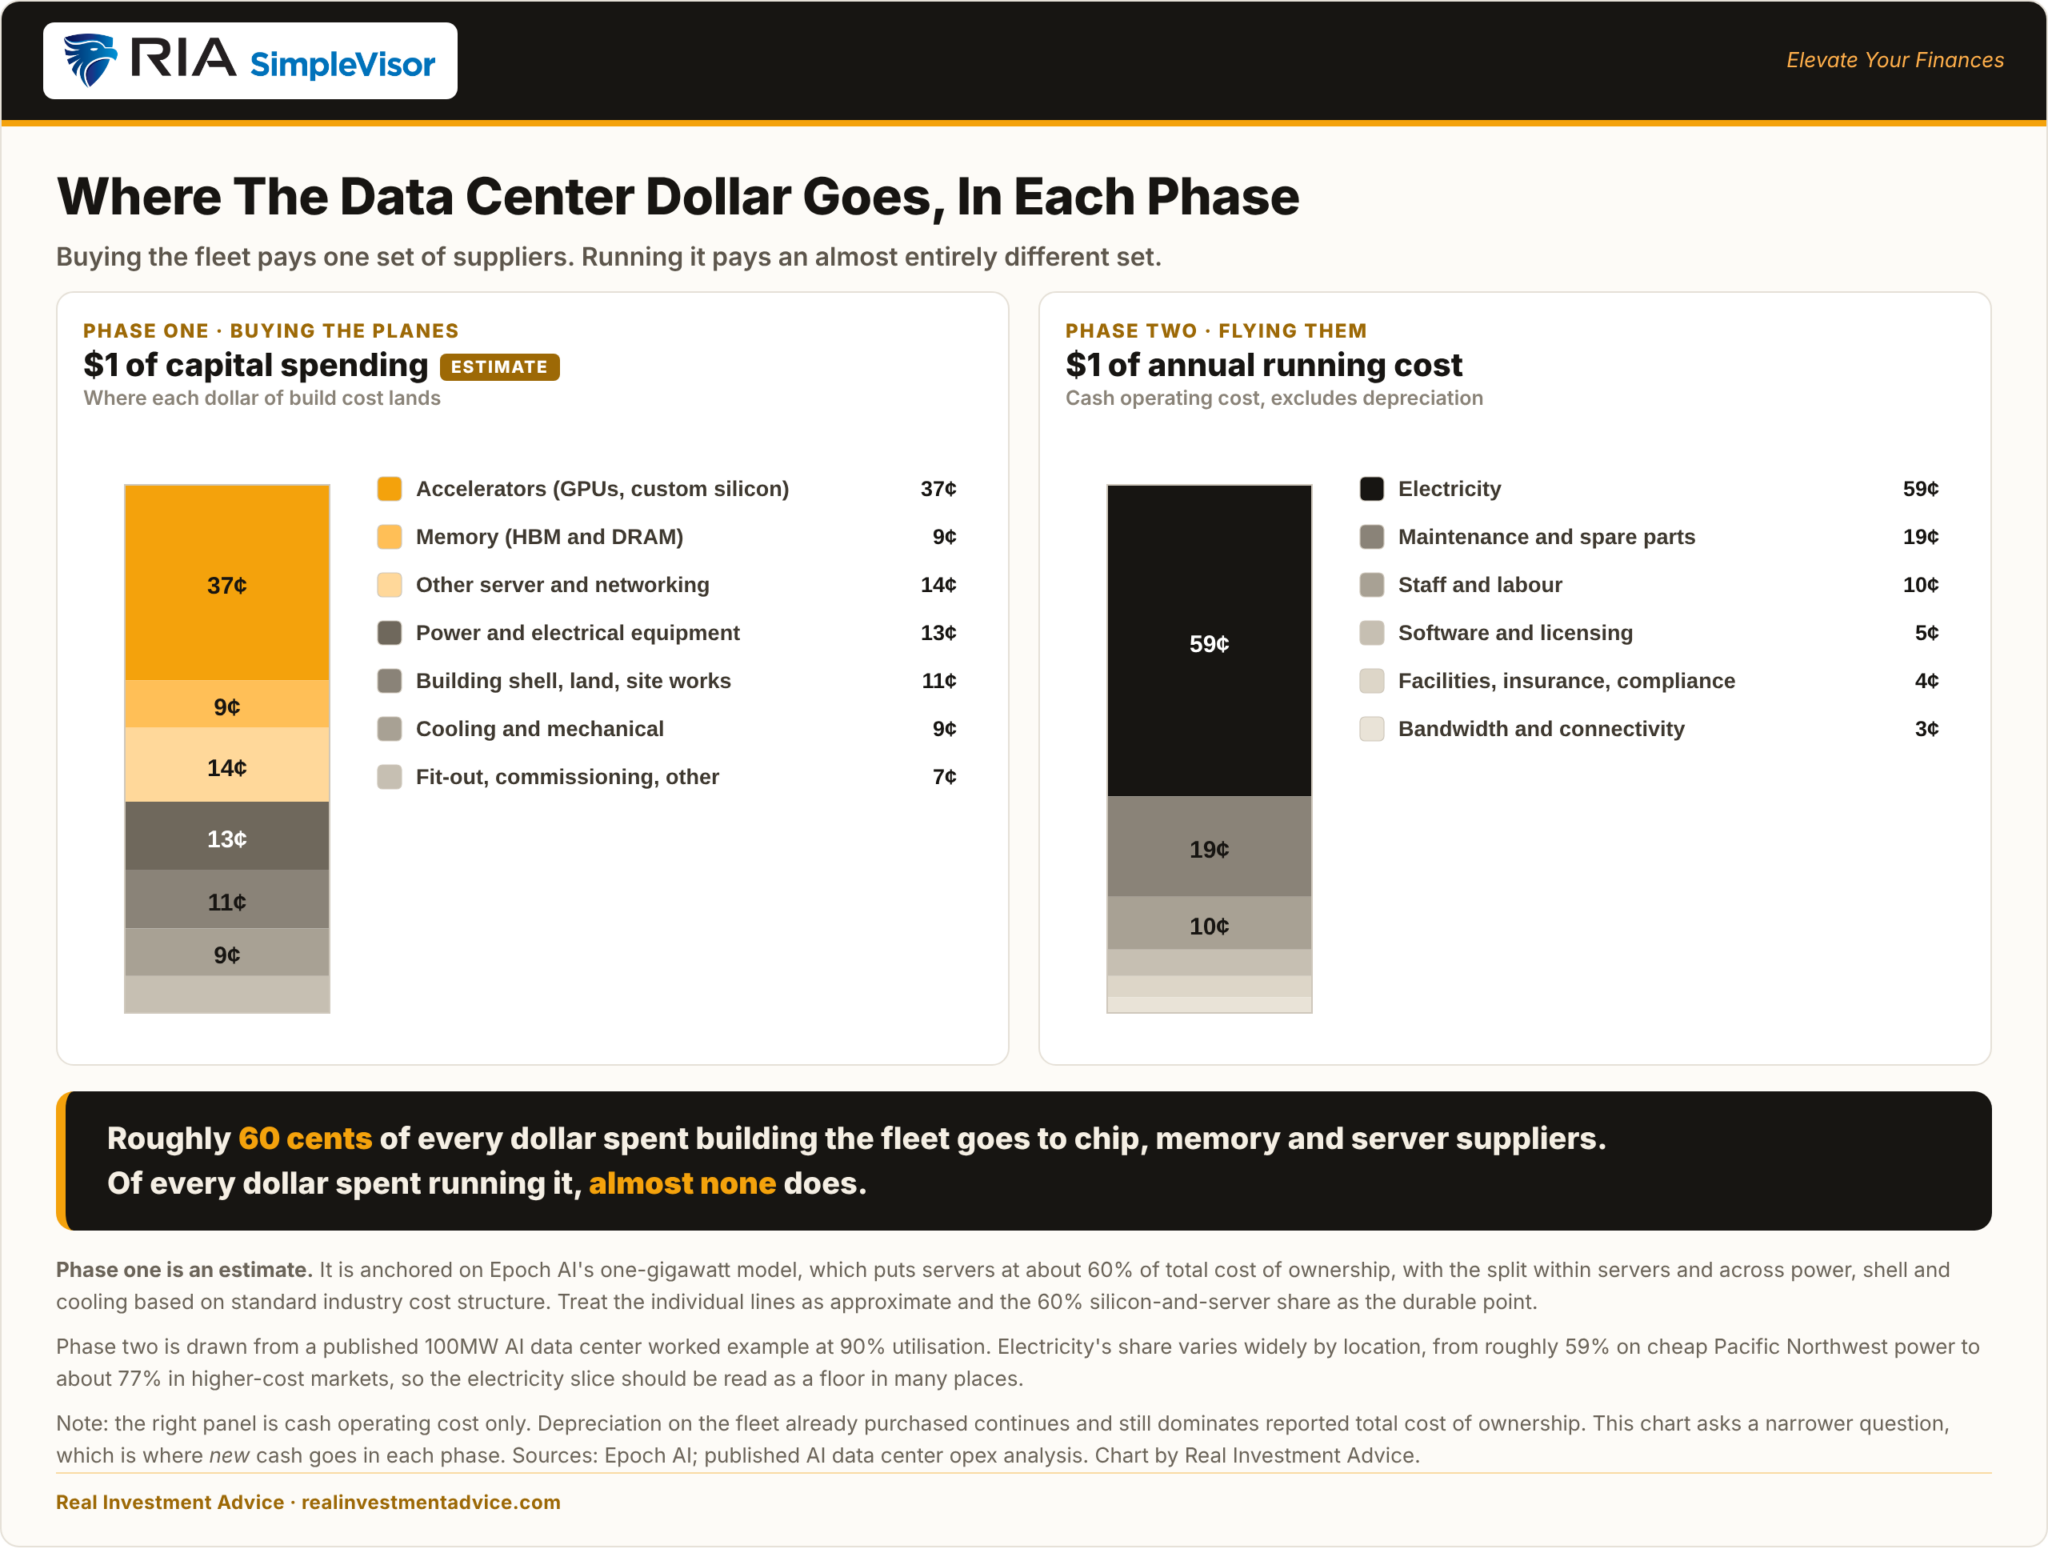
What happens when hyperscalers’ spending on data centers slows? To help you see how that hyperscaler evolution will affect spending, we share an analogy with a new airline.
In the beginning, the focus is buying planes. The capex is enormous, with nearly all spending flowing to a narrow set of suppliers, such as airframe and engine producers and the financiers behind them. Every quarter the fleet gets bigger, and every quarter those suppliers book substantial revenue. That is the phase the hyperscalers are in now. The planes are data centers. The suppliers are chips, memory, foundry capacity, transformers, and power.
At some point the fleet is the right size, and purchase growth slows. Attention shifts from purchasing planes to running the airline more efficiently: filling seats, yield management, fuel burn, turn times, baggage fees, and maintenance intervals. The planemaker’s revenue declines in phase two while vendors that help with revenue management systems, fuel hedging, and loyalty programs start receiving revenue. The airline compounds earnings, but its original suppliers see less of it.
Today, vendors selling data center buildout goods and services have robust pricing power. But at some point, the hyperscalers will have enough data centers, and optimization will become their main goal. At that time, the spending will shift heavily toward inference efficiency, scheduling software, cooling, long-dated power contracts, and custom silicon, some of which the hyperscalers design themselves. Spending may not change materially, but the beneficiary of the spending might.
What To Watch Today
Earnings
Economy
Market Trading Update
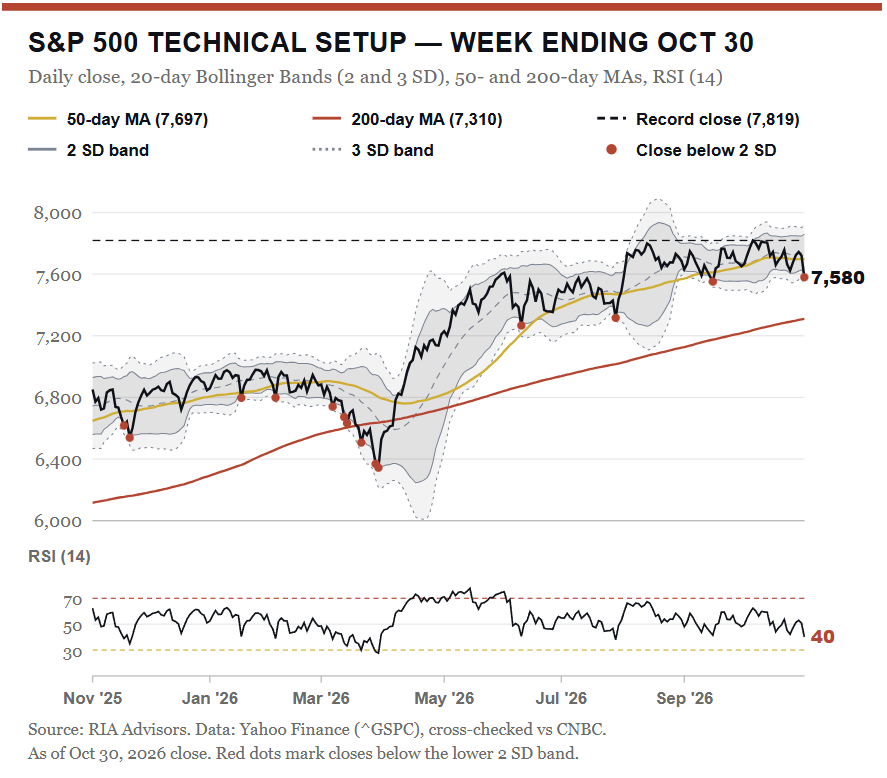
Friday’s decline did real technical damage. The S&P 500 closed at 7,580.07, its first close below the 100-day moving average since early April. It now sits 0.5% below that average at 7,615 and 1.5% below the 50-day at 7,697. From the October 6 record close of 7,819, it’s down 3.1%. Is the bull trend over? No. The index remains 3.7% above a rising 200-day average at 7,310, the line that defines the bigger trend, and while it slipped below that line for about three weeks in late March and early April, it has held above it ever since. The short-term trend is another matter.
Momentum confirms the break. RSI fell from 50.8 to 40.1 in a single session. MACD had been closing in on a bullish crossover, then turned back down below zero, and its histogram widened from −3.7 to −11.5 index points. Friday’s close also landed below the lower Bollinger Band at 7,600, a move 2.3 standard deviations below the 20-day mean. Notice in the chart below that closes under that band marked short-term lows on September 16 and July 29. That isn’t a guarantee. In March, the index closed below the band six times over three and a half weeks before it finally bottomed.
Sector breadth explains why the index fell while most stocks rose. Measured against the S&P 500, eight of 11 sectors trade more than 2.5% above their 50-day relative average. Energy leads at 9.5%, with health care at 9.0% and staples at 7.3%. Only technology at −3.9% and communication services at −8.4% sit meaningfully below. The “safe” trade has become the crowded trade. In other words, the oversold groups are exactly where a rebound would have to start.
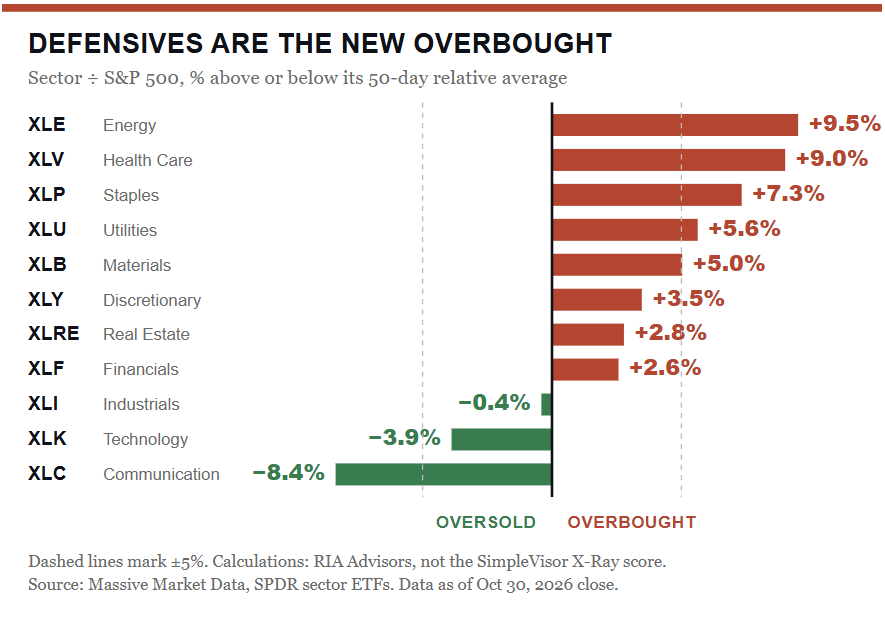
That cuts both ways, though. Technology and communication services carry the heaviest weights in the index, and oversold can always get more oversold. A market trading below its 50-day and 100-day averages tends to sell rallies until it reclaims them. Such is the nature of a broken short-term trend. I wouldn’t treat Friday’s selloff as an automatic buying opportunity.
We positioned for this earlier in the month. On October 5, we trimmed Apple, Nvidia, AMD, and Palantir in our equity model. The proceeds went into names like Walmart, Costco, JPMorgan, and RTX. Last Friday, we took profits in Kinder Morgan and Williams as energy got stretched. That leaves us balanced going into a volatile week rather than chasing either side.
For the week ahead, hold core equity exposure at target weights and don’t chase a bounce. The 100-day at 7,615 and the 50-day at 7,697 are now resistance. Rallies into those levels are places to rebalance, not add. First support is the September 16 close at 7,552, followed by the July 31 close near 7,490. A close below 7,490 would open the door to the 200-day near 7,310, and that’s where I’d tighten stops and raise some cash. A close back above 7,615 would do the opposite. It would turn Friday into a one-day shakeout and favor adding growth exposure.
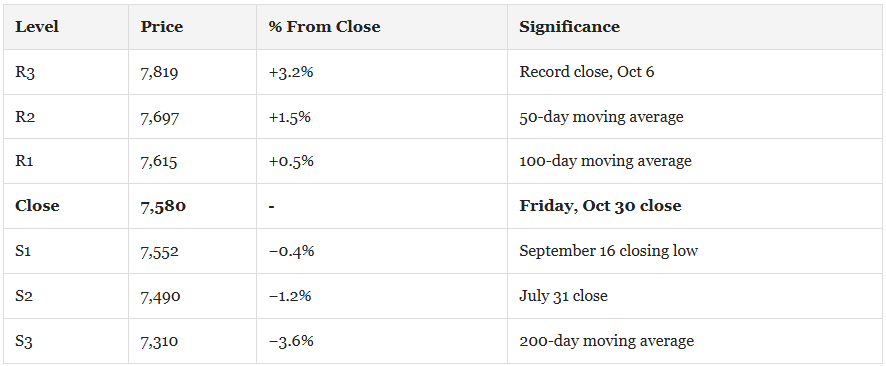
The single most important level this week is 7,615. Reclaim it, and the four-week run in value starts to look exhausted. The growth vs value trade has reached an extreme, and we may be close to a point where growth begins to find buyers.

The Week Ahead
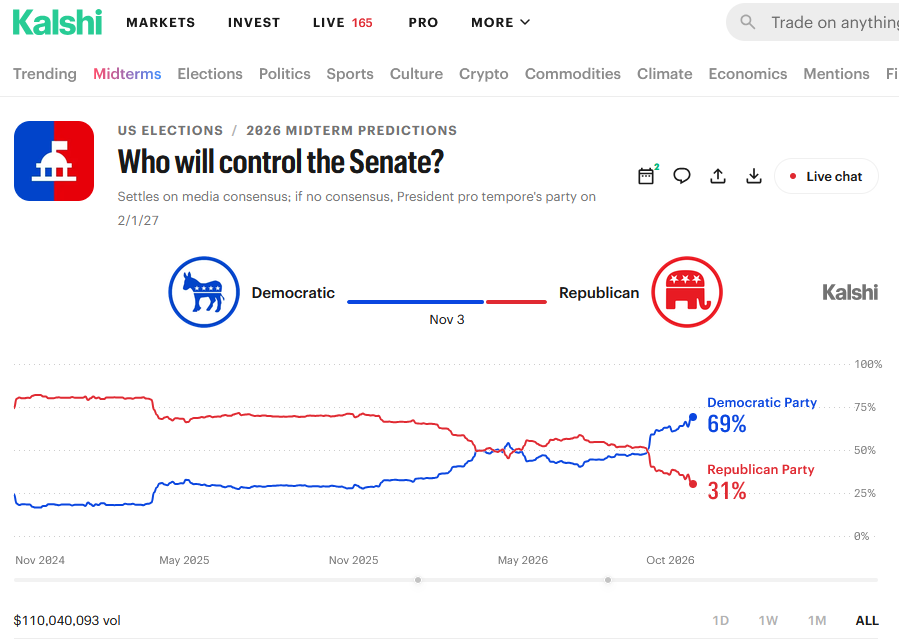
The election results could have a sizeable impact on the markets on Wednesday. Of importance, will they be as widely expected, with the Democrats taking the House and a slim margin of victory for the Republicans or Democrats in the Senate? If so, the market reaction may be somewhat tame. Something other than the expected may drive upward or downward volatility. The graphic below shows that Kalshi odds favor Democrats taking control of the Senate.
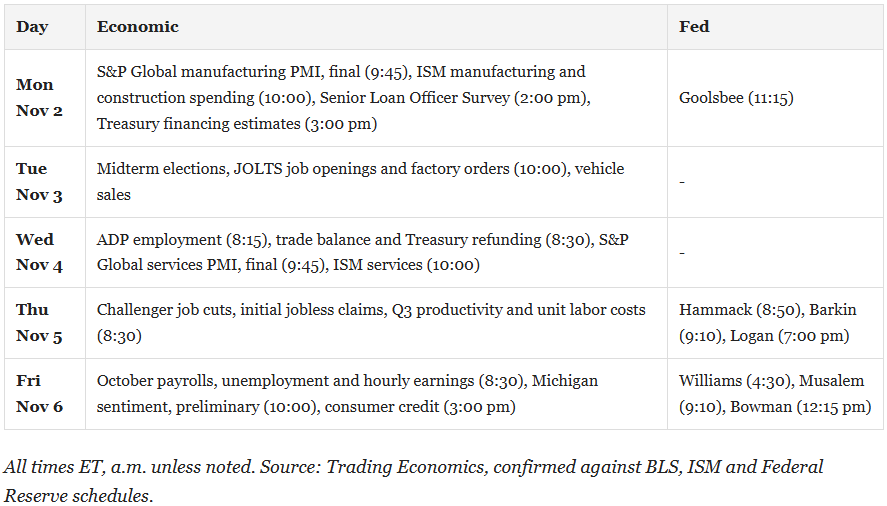
With the FOMC meeting in the rearview mirror, investors will watch economic data closely as it shapes the Fed’s rate decision at its December meeting. This week’s employment data will be key to that assessment. JOLTS on Tuesday, ADP on Wednesday, and the BLS labor report on Friday will carry significant weight. Wall Street expects BLS job growth of 40k, which would continue to confirm the labor market is stagnant- little hiring and little firing.
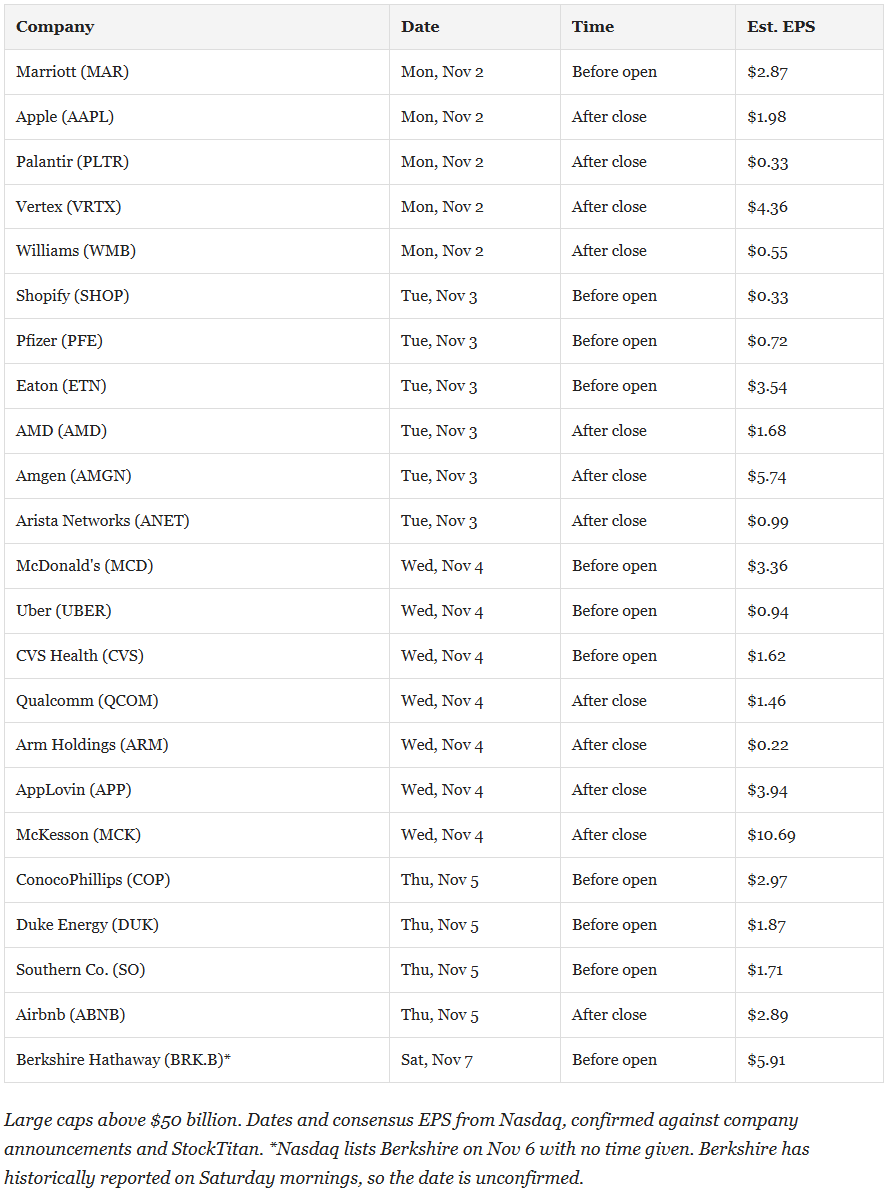
Earnings continue this week, with Apple and Palantir reporting this afternoon. Also of note this week will be AMD on Tuesday. The market will be on the lookout for any clues toward future AI-related capex spending.
Real Wages 2026: Why Consumer Stocks Feel It First
The September jobs report grabbed the headlines. Payrolls rose just 29,000, and July was revised to an outright loss.6 However, the number I’d circle came out twelve days later, buried in the Bureau of Labor Statistics’ real earnings release. Real wages in 2026 are sliding further into negative territory. Average hourly earnings, adjusted for inflation, fell 0.7% over the twelve months through September, more than double August’s decline.1 That’s the first negative stretch since the spring of 2023, and it changes the math for every company selling something a household can put off buying.
Workers did get raises, and the “strong labor market” crowd will rightly point that out. Average hourly earnings rose roughly 3.0% over the past year, a respectable figure by most measures. The problem is what happened at the pump. Gasoline prices are up 34.2% from a year ago, and the broader energy index is up 20.4%.2 Food is up 2.5%. Core CPI, which strips out food and energy, is running at just 2.6%.
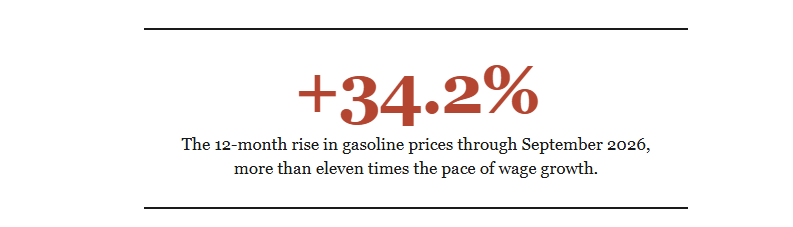
In other words, the paycheck is beating everything EXCEPT energy.
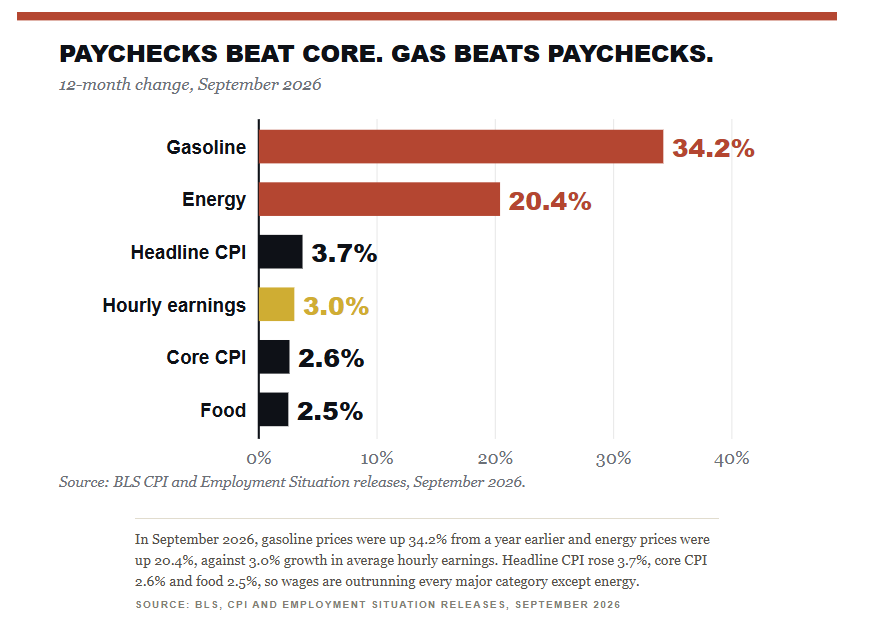
This is why the two versions of real pay tell such different stories. Deflate wages by core CPI and real pay is still growing, though only about 0.4% a year now. Deflate them by headline CPI, the prices people actually pay at the register and the pump, and real pay has been negative every month since April.

Tweet of the Day
Trading Rules With Desktop Printout
“Want to achieve better long-term success in managing your portfolio? Here are our 15-trading rules for managing market risks.”
Please subscribe to the daily commentary to receive these updates every morning before the opening bell.
If you found this blog useful, please send it to someone else, share it on social media, or contact us to set up a meeting.