
🔎 At a Glance
- Druckenmiller Warning: The Bond Market Already Priced It
- Market Brief & Technical Review
- From Lance’s Desk: Democratic Socialism: A Beautiful Cake With A Bitter Aftertaste – RIA
- Market stats, screens, and risk indicators
🏛️ Market Brief – A Bond Scare
If you look at the market headline, the bulls won this week. However, the internals told a different story with the S&P 500 closing Friday at 7,711.76, up 0.5% on the week, while the Nasdaq Composite added 0.9% to 26,402.42. Yet under that placid surface, the average stock lost ground. The equal-weight S&P slipped 0.4% while the cap-weighted index rose, and the Russell 2000 fell roughly 1.4%. Notably, only three of the eleven sectors finished green.
Nvidia did the heavy lifting. Its blowout Wednesday-night report and a forecast for 70% fiscal-2028 revenue growth sent the stock up nearly 9% Thursday and dragged the index to a fresh record before Friday’s fade. The entire tape is now leaning on the AI complex, and the AI complex is now leaning on one earnings call at a time. Communication services, technology, and financials were the only sectors to advance. Health care, industrials, and energy led the laggards.

However, the real story was in Wyoming as Fed Chair Kevin Warsh gave his first Jackson Hole address and refused to blink. He said this summer’s better inflation prints do not tell him underlying trends have “meaningfully improved,” and he committed, in his words, to a discipline rather than a decision. In other words, his rock-solid commitment to “no forward guidance” remained intact and provided no cover for a market pricing in cuts.
Beneath the equity calm, the bond market is anything but. The long end refuses to come down with the 30-year sitting near 5.2%, not far from a 19-year high. This is even after Treasury doubled its long-dated buyback lots to $4 billion to steady the tape, which starts September 4th. As we discuss more below, Stanley Druckenmiller used the pages of the Wall Street Journal this week to call that intervention “price management” and to remind Washington that the long bond is the only fiscal disciplinarian we have left.
Cross-asset performance told the same cautious tale. On Friday, gold fell 2.9% o roughly $4,530 after its strongest month in decades, WTI held near $83, and bitcoin slipped toward $77,700 as its mid-month squeeze unwound. This is a story about uncertainty over whether the Fed can successfully transmit its interest-rate signal back to the bond markets.
As I flagged two weeks ago in Record Highs: Should You Chase The Rally?, our money-flow breadth model had already pushed into extreme overbought territory and was signaling profit-taking, not chasing. Nothing this week changed that message. Watch participation, not the index, as we head into next week’s jobs data.
📈Technical Backdrop – Momentum Rolls Over, What Next?
As noted above, the market remains within a stone’s throw of previous highs, but underlying momentum quietly rolls over. The S&P 500 finished the week at 7,711.76, about 1.1% below the record close of 7,796 set on August 13. The index sits 2.0% above its rising 50-DMA near 7,556 and a healthy 8.4% above its 200-DMA near 7,114, and the golden cross remains firmly intact. When looking solely at the trend, it remains a bull market. However, a look at the underlying momentum shows the cracks are appearing.
Specifically, the 14-day RSI closed at 56.6, down from 58.6 a week ago and well off the overbought readings that accompanied the mid-August record. That reading suggests a more neutral condition, not stretched, and it leaves room in either direction. More telling is the MACD, where the signal line has rolled over; the MACD line at 41 is now sitting below its 51 signal, with a negative histogram. Furthermore, the histogram is narrowing rather than widening, so this is a loss of upside thrust, not the start of a breakdown. Price at the highs on fading momentum is how most short pauses begin, and occasionally how larger ones do.

Overall, participation is the most important tell. As we detailed in Breadth Is Lacking: Is The Rally Sustainable?, a rally led by a shrinking group of names is weaker. This week proved it again. The equal-weight index fell while the cap-weight rose, and small caps dropped 1.4%. When the generals advance without the troops, the advance is on borrowed time.
Heading into next week, this is how we would suggest approaching the market. The record close at 7,796, and the round 7,800 level, are the resistance barriers. If the markets can muster a decisive close above the levels, on strong breadth, that would reopen 7,900 and then 8,000.
Absent that, we will continue to treat rallies into 7,800 as a place to trim winners back to target weight, not to add.
On the downside, the first support is the recent swing low near 7,643, then the 50-DMA at 7,556. Any break of the 50-DMA is the level that begins to turn the recent pause into something worth hedging with index puts or a raised cash buffer. Our money-flow model already trimmed equity exposure toward target weight at the August highs, and we see no reason to reverse that currently.

The base message is to continue keeping risk controls in place, a larger-than-normal cash buffer, and swap risk for safety until the market declares where it is headed next.
🔑 Key Catalysts Next Week
As noted above, this whole week came down to Kevin Warsh’s Jackson Hole speech in which he focused solely on the data. This coming week, the labor market will answer pretty much everything all at once. The August employment report lands on Friday at 8:30 a.m. ET, and it is the week’s fulcrum. After the Fed chair refused to pre-commit to a September cut, a soft payrolls number would hand the doves their ammunition, while a firm print alongside sticky prices would validate the hold and keep pressure on the long end of the curve.
However, it isn’t just Friday that will move the markets. Tuesday brings JOLTS job openings and the ISM Manufacturing index, with a much greater focus on the prices-paid component after it last printed above 70.
Then, on Wednesday, the ADP private payrolls report, which has been running soft, will give us some insight into Friday’s BLS employment report. Thursday brings the ISM Services, weekly jobless claims, the trade balance, and productivity revisions into a single session as September gets underway.
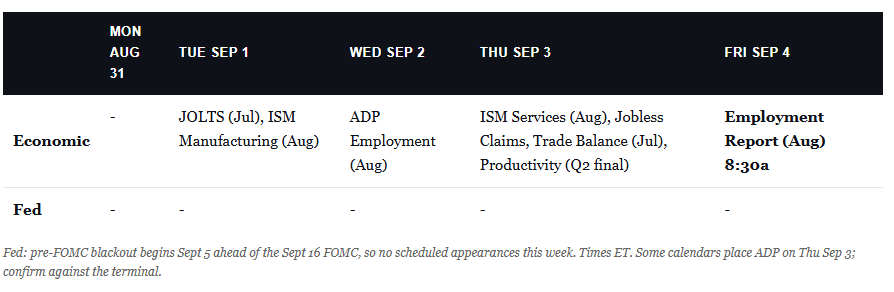
The Fed itself goes dark. The pre-FOMC blackout begins ahead of the September 16 decision, so Warsh’s Jackson Hole remarks are the central bank’s last word until the meeting. That leaves the data to do all the talking.
On the corporate side, one report towers over the rest. Broadcom reports fiscal Q3 after the close midweek, with consensus near $3.24 in EPS and management already guiding to roughly $29.4 billion in revenue, driven by AI strength. Broadcom is the cleanest read we get on whether hyperscaler AI capex is still accelerating, and given how much of this tape rests on that one question, it matters far more than its market cap suggests.

Need Help With Your Investing Strategy?
Are you looking for comprehensive financial, insurance, and estate planning services? Need a risk-managed portfolio management strategy to grow and protect your savings? Whatever your needs are, we are here to help.

💰 Druckenmiller Warning: The Bond Market Already Priced It
Recently, Stanley Druckenmiller wrote an opinion piece for the Wall Street Journal. The “Druckenmiller warning” hit on August 24, and within a day, the financial press turned it into a soap opera. Some of the headlines were “Mentor scolds protégé,” and “Billionaire slams the Treasury Secretary.” Then, the revelation that he wrote it with the help of AI somehow became its own headline.
However, while the media was busy making headlines, the argument was lost. Stanley Druckenmiller did not forecast a debt crisis, nor pitch a trade. What he said was something difficult to fit in a headline, and it was something the bond market has already said for him.
What Actually Happened On August 19
On August 19th, the Treasury said it would double the size of its long-dated buyback operations to at least $4 billion. That operation will run from September 9 through November 4 (it hasn’t started yet) and is aimed at the long end of the curve. The timing of the announcement was the tell, and the heart of the Druckenmiller warning, as the move came right after yields hit their highest level in about 19 years. Yields dropped on the news, but by the next trading day, the bond rally was reversed. The long bond has hovered in the 5.2% range since then.

Treasury Secretary Scott Bessent then told CNBC the operations could run bigger than $4 billion. Days later, senior officials floated the idea of using the department’s nearly $950 billion cash account to help fund the purchases. What is crucial to understand is that these actions are a very different conversation from “liquidity support.”
You do not need to support a market you yourself describe as having strong, consistent sponsorship, and that strong sponsorship is the definition of a healthy market. However, the Treasury intervened anyway right after yields peaked, which is why the market read it as “price management” and shrugged.
What The Druckenmiller Warning Actually Says
I posted the link to Druckenmiller’s warning above, and encourage you to read the piece closely. When you do, you will realize that the popular summary falls apart.
Most notably, the article was not a claim that yields are about to spiral. What Druckenmiller suggests is that a 30-year bond at 5.5% is an “invoice,” not a “crisis,” nor was it a claim that the “bond vigilantes” have finally arrived. He actually described the opposite: a market he called “a pushover that had finally begun to clear its throat,” and the bond market has been too calm, rather than too violent.
However, Druckenmiller’s real target is structural. To wit: the long bond, in his framing, is “the only fiscal disciplinarian the U.S. has left.” He states that if you suppress that signal, you subsidize the one thing Washington does reliably well: “delay.”
While many currently point fingers at the Republicans, particularly as we approach the mid-term elections, the reality is that neither party has the will to touch entitlements with the market applying pressure. But more importantly, without that pressure, neither party has shown the will to touch them either. Such is why entitlements are called the “third rail of politics,” because if you touch them, your political career is toast.
There’s a second layer that most of the media coverage skipped. Historically, yield management has always started as a technical operation. However, as with most things in Government, it tends to end as a more permanent policy commitment. From 1942 to 1951, the Fed capped long Treasury yields to finance the war. Naturally, that cap outlived the war by years before the Treasury-Fed Accord finally killed it. The wall between managing the debt and managing bond prices was built on purpose. Unfortunately, that “wall” gets blurred by this intervention.
The last time this happened, it looked like this.
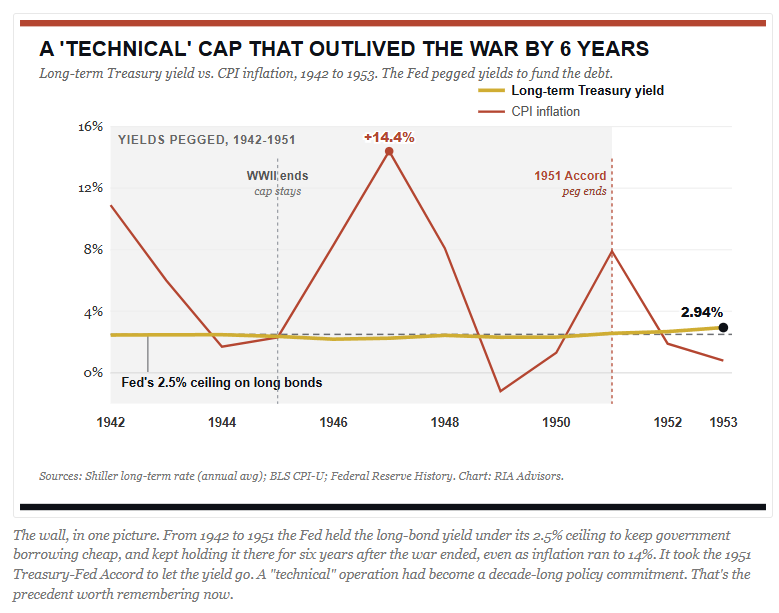
The gap at the center of the Druckenmiller warning is the space between what he wrote and how it’s being read. That gap is wide enough to matter. The table lays it out.

The Strongest Case Against The Druckenmiller Warning
To be fair, the bond bears have a valid point. Someone will wave the whole thing off as $4 billion against a market north of $30 trillion, a rounding error. So, what is all the fuss about? They are correct about the arithmetic. Four billion dollars cannot set the long end, and the recent round-trip in yields proves it. However, that also exposes the risk in the argument. You can’t call an operation both impotent and dangerous in the same breath without saying which one it is.
(The chart below shows the history and magnitude of previous buybacks. This is not unprecedented by any measure.)
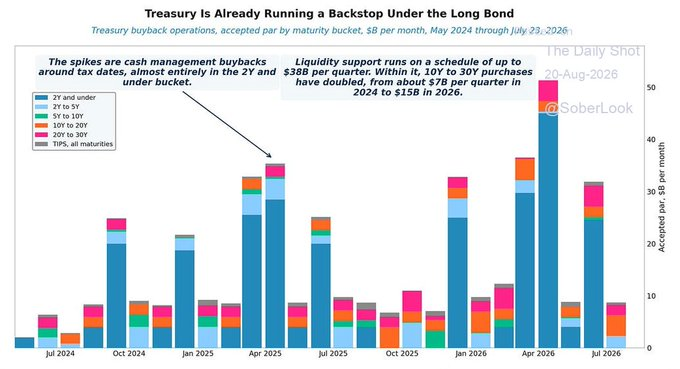
There is a much better version of the pushback, and it comes from people like Jon Hilsenrath. He noted that a move in long yields isn’t purely fiscal information but also reflects dealer balance sheets, hedging flows, and the financing of levered positions. The March 2020 and 2022 gilt crises both showed that liquidity can seize up even when the fundamentals look fine. Furthermore, Bessent’s stated case is that the Treasury sees something about market functioning that outsiders don’t. That probably isn’t as crazy as it sounds on its face.
So where does that leave the Druckenmiller warning? In our opinion, it is much stronger than its critics allow, for one reason. The danger was never the four billion dollars. The mistake is the precedent: the signal that the Treasury will now step in to defend a price. Once the market believes that, every selloff becomes a test of official resolve, and the tests only get bigger. This is the very definition of “moral hazard” that we discussed previously. More notably, the bond market has already ruled on this point.
Bessent’s actions run counter to Kevin Warsh’s recent mandate to remove the “Fed Signal” from the market. For investors, this means we will need to watch the next moves from both Bessent and Warsh.
What The Druckenmiller Warning Means For Bond Investors
The future is currently uncertain. What will happen with oil prices, tariffs, and political policy? The mid-term elections are coming quickly, and there are signs of both economic weaknesses and strengths. The Fed is signaling it is backing away from market support, but the Treasury says it is still there. It’s all confusing, but for investors managing their own portfolio, it suggests several changes to both strategy and holdings.
- Do not buy the long bond for the buyback bid. A $4 billion operation is a backstop, not a floor under prices. Supply at the long end is getting heavier as deficits run near 6% of GDP. Furthermore, corporate issuance is competing for the same buyers. The 20- to 30-year part of the curve is now a political football. Political footballs trade with extra volatility.
- Own the belly of the curve, the 5- to 10-year part. That is where you capture most of the yield with far less duration risk. You also reduce exposure risk to whatever “policy commitment” the long end gets dragged into. At a 10-year near 4.7%, the coupon does real work as you are paid to wait. Just take that interest rate “carry” where the duration risk is SMALL.
- Lastly, it could pay to keep some inflation protection in the mix. If the Treasury escalates its interventions and funds long-bond purchases with bills or its cash account, that’s a quiet form of easing. However, that is occurring while inflation still runs above the Fed’s 2% target. In that environment, TIPS will earn their place in portfolios. But the risk is that you cap your returns if the term premium keeps grinding higher on increasing supply.
Here is an example of the 40% allocation in a 60/40 equity/bond portfolio.

So, here is the question worth asking.
“If there’s no crisis, why not just own the long bond and clip the coupon?”
The answer is the escalation path, so you will want to watch the Treasury General Account. If Treasury actually deploys the $950 billion to defend a yield level, Druckenmiller’s “technical tool becomes policy commitment” line stops being theory, and the trade shifts toward steeper curves, more inflation protection, and shorter nominal duration.
The one thing that would push me to extend into the long end with conviction is the opposite of intervention. A credible plan on the deficit would do more for the long bond than any buyback. This is the real point of the “Druckenmiller Warning,” and it’s mine too. I’ve argued before that the debt problem is a crisis without a calendar. However, that is what the waiting looks like.
🖊️ From Lance’s Desk
This week’s #MacroView blog explores the differences between Democratic Socialism and Capitalism. While capitalism has its flaws, before abandoning it for socialism, understand what you are voting for.

Also Posted This Week:
- Productivity On Gilligan’s Island: Episode 2 – RIA – by Michael Lebowitz
- Investor Psychology Is Sabotaging Your Returns (Chapter 2 of 5) – RIA – by Lance Roberts
📹 Watch & Listen
The NASDAQ is showing signs of technical improvement after five straight down days and a significant mean-reversion move. The 20-DMA has moved back above the 50-DMA, a rising trend line is developing, and improving momentum could put recent highs back in play.
Subscribe To Our YouTube Channel To Get Notified Of All Our Videos
📊 Market Statistics & Analysis
Weekly technical overview across key sectors, risk indicators, and market internals

💸 Market & Sector X-Ray: Market Gains Ground
The market struggled a bit this past week but eeked out a small gain. Technology gained ground with Nvidia’s earnings, but Energy eased a bit with the decline in oil prices. Overall, the market remains well deviated above longer-term moving averages but has reversed some of its previous overbought conditions. Communications is the most overbought sector, and Industrials, Utilities, Small and Mid-cap stocks are the most oversold.
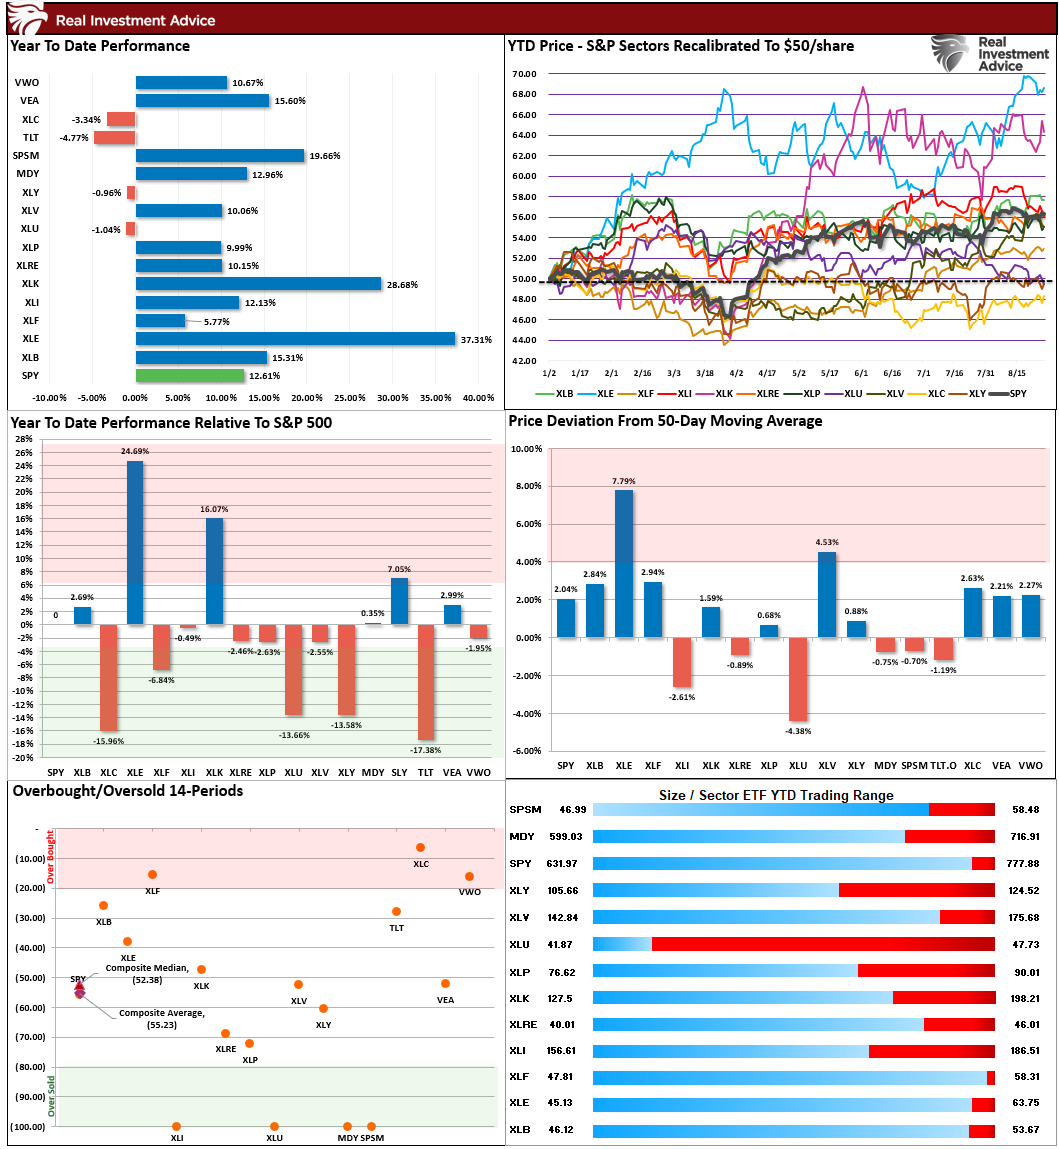
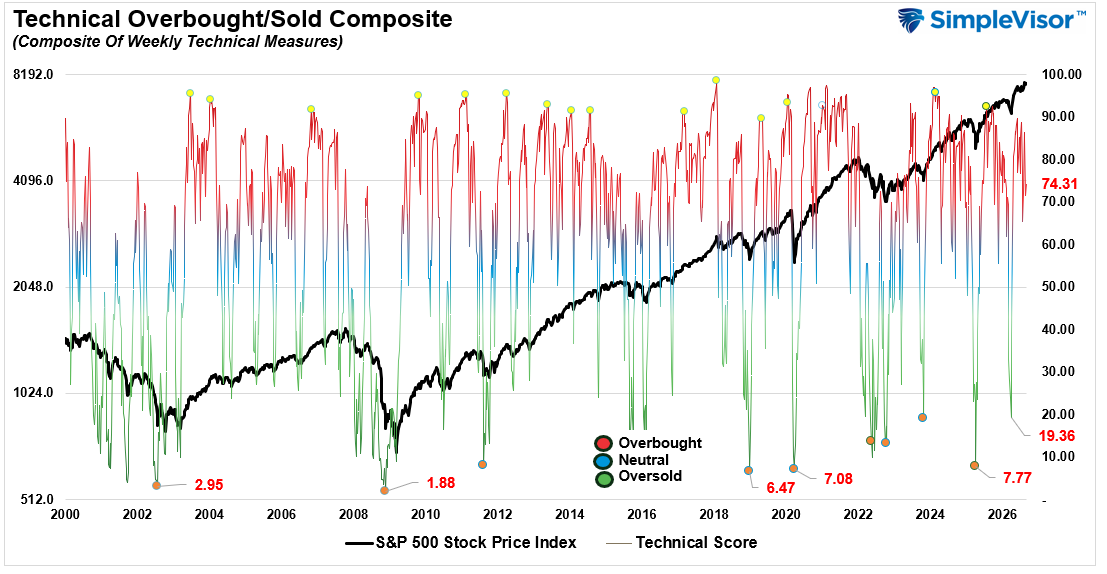
📐 Technical Composite: 74.31 – Overbought Reversing
The technical condition pushed higher this past week with the markets small gain. However, overall, the market remains technically overbought, and sentiment remains bullish for now with no significant technical breaks. Indicator does suggest more struggles for the market next next.
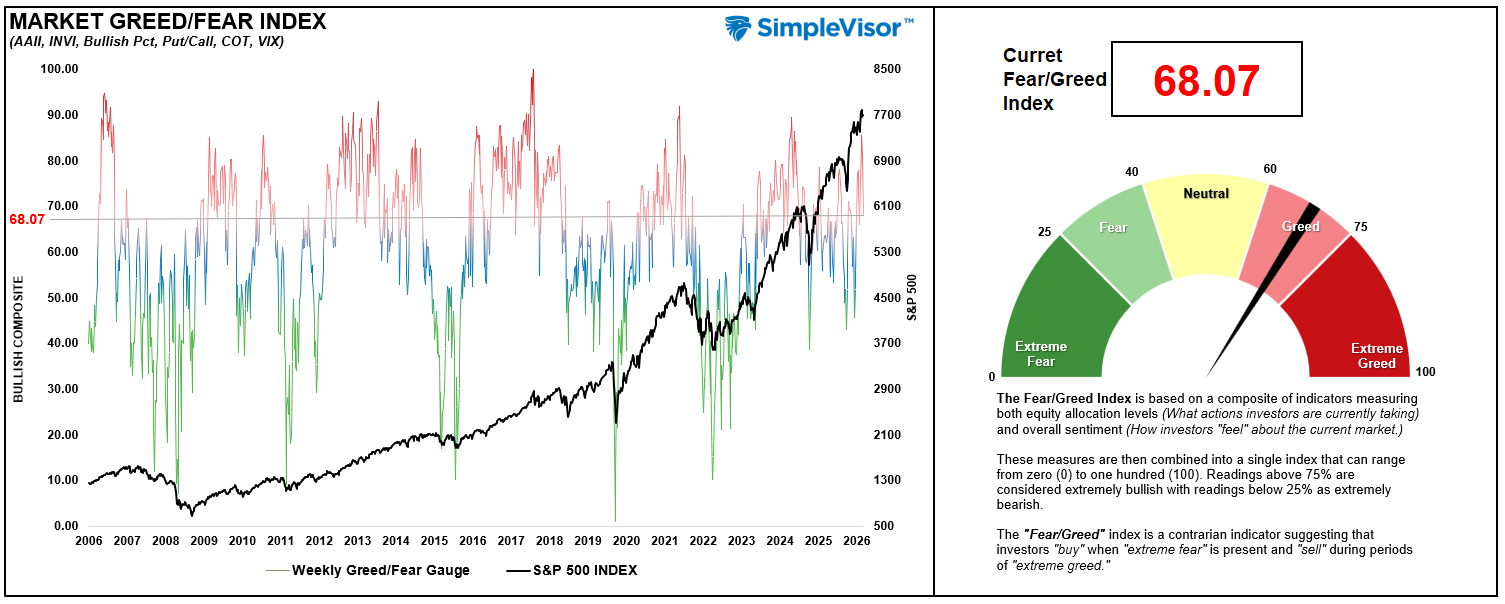
🤑 Fear/Greed Index: 68.07 – Investors Reduce Bullishness
Even though the market posted a positive return last week, the underlying allocation and sentiment to the market reversed somewhat. There was a sharp drop in the Commitment of Traders equity allocations, and sentiment declined over the last two weeks. While not a significant warning yet, as we enter September, the reversal in positioning is worth watching.
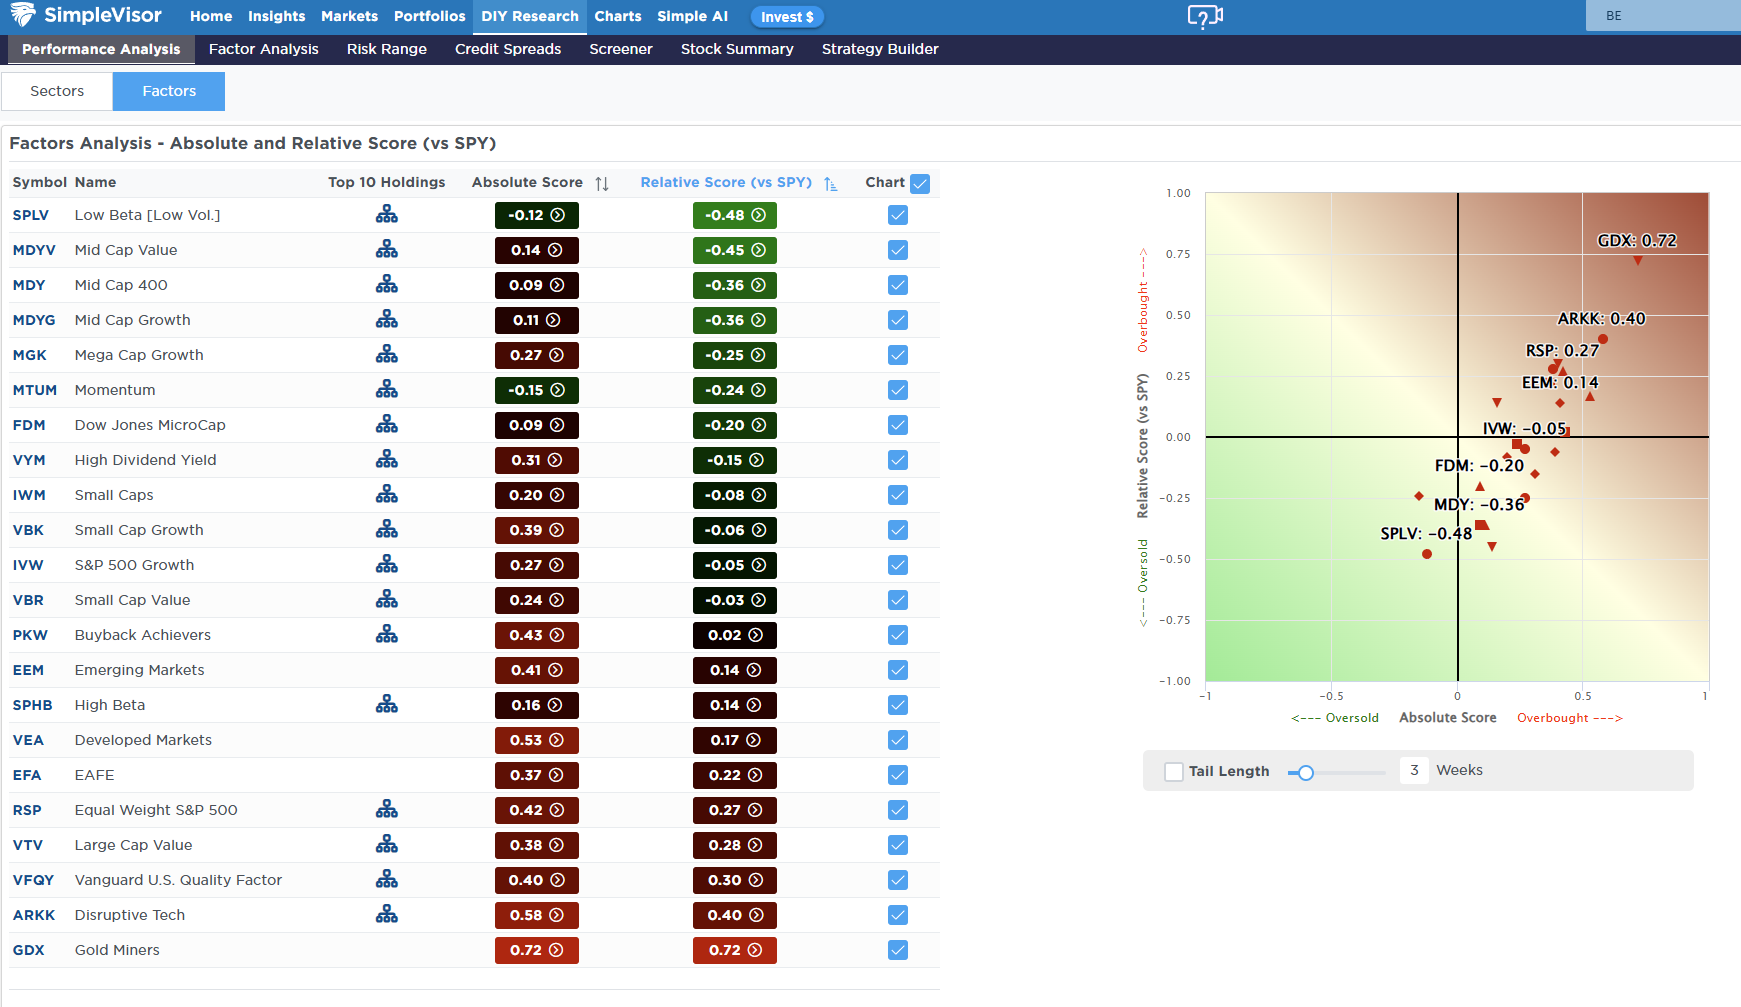
🔁 Relative Factor Performance
About 12-weeks ago we noted that Goldminers were the most oversold factor on the list which suggested that a rotation was likely. That rotation has now occurred and Goldminers are extremely overbought. Take profits and rebalance your positioning. Disruptive Tech, US Qualrity, Large Cap Value, and Equal Weight are also very overbought suggesting we could see a bit more of correction in the market over the next few weeks and see a rotation towards lower beta and technically beaten up sectors.
📊 MFBR Index (Money Flow/Breadth Ratio Indicator)
The Money Flow Breadth Ratio (MFBR) model is a rules-based equity allocation framework that uses weekly S&P 500 money flow data to generate buy, sell, and neutral signals. The MFBR systematically adjusts portfolio equity exposure in response to the direction and persistence of institutional capital flows. It aims to reduce drawdowns while capturing the majority of market upside.
“As of August 28, 2026, with the S&P 500 at 7,711.76, the Money Flow Breadth Ratio (MFBR) stands at 75% and declining, versus 75% the prior week – a 5 percentage-point decrease over the last two weeks. This places the indicator in extreme overbought territory (75% or higher). The raw breadth signal still reads BUY, but the MFBR is a contrarian indicator at extremes: readings this stretched have historically been followed by below-average forward returns, so the model treats this as a caution flag rather than a green light to add risk.
The model’s 25-year backtest is the reason for the trim: MFBR readings above 70% have been followed by below-average forward returns, so the grid reduces exposure at these levels rather than adding to it. Breadth this stretched is a profit-taking signal, not a chase signal. The model’s message is to sell into strength, move down to the target weight, and reassess next week.”

📊 Sector Model & Risk Ranges
Two weeks ago we noted that several sectors of the market were hitting extremes which typically denotes a good opportunity to reduce risk and rebalance holdings. As of this week, the overall market, Energy, Communications, Materials, Technology, Healthcare, Emerging Markets, Gold and Gold Miners are all outside normal return ranges on a monthly basis. Continue to rebalance risk as we move into the seasonal weak month of September.

Have a great week.
Lance Roberts, CIO, RIA Advisors