🔎 At a Glance
- The SpaceX IPO: Buy or Wait?
- Market Brief & Technical Review
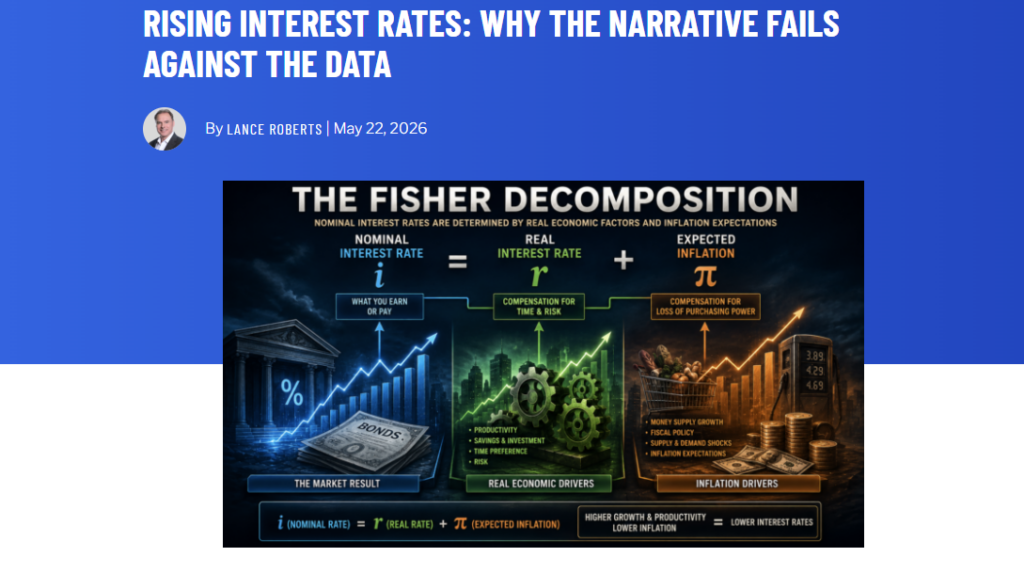
- From Lance’s Desk: Rising Interest Rates: Why The Narrative Fails Against The Data – RIA
- Market stats, screens, and risk indicators
🏛️ Market Brief – Warsh Takes The Helm
The week opened on the back foot and ended at a record high. The S&P 500 closed Friday at 7,473.47, up 0.37% on the day and 0.9% for the week, notching its eighth straight winning week. That’s the longest weekly win streak since late 2023. The Dow added 294 points Friday to finish at 50,579.70, also a new record close, with the index gaining 2.1% on the week. The Nasdaq Composite tacked on 0.19% Friday to 26,343.97, up 0.5% for the week and posting its seventh advance in the past eight weeks. The Russell 2000 added 0.84%, leading the major averages on the session as rate-sensitive small caps caught a bid.
The week’s defining moment came on Friday morning. Kevin Warsh was sworn in as Federal Reserve Chair in the White House East Room, replacing Jerome Powell after eight years. Justice Clarence Thomas administered the oath. Trump told the crowd, “I want Kevin to be totally independent. Don’t look at me, don’t look at anybody.” Markets had largely priced in the transition, but Warsh’s reform-oriented tone in his first remarks signals a meaningful shift in Fed communication. Powell will stay on as a governor, the first time a Fed chair has done so in nearly 80 years. Stephen Miran resigned to make room for Warsh on the Board.
The bond market did most of the heavy lifting earlier in the week. The 30-year Treasury yield touched 5.19% on Tuesday, the highest reading since 2007, and that print drove a three-day equity selloff Monday through Wednesday. Then the long end began to pull back. By Friday’s close, the 10-year had eased to 4.54%, down for the third straight session, and the 30-year settled in the 5.05% area. Lower oil prices and improved Iranian negotiation rhetoric helped cool inflation expectations. WTI crude swung from above $108 Monday down to $96 Thursday before climbing back to about $98 Friday morning. Brent finished near $105.
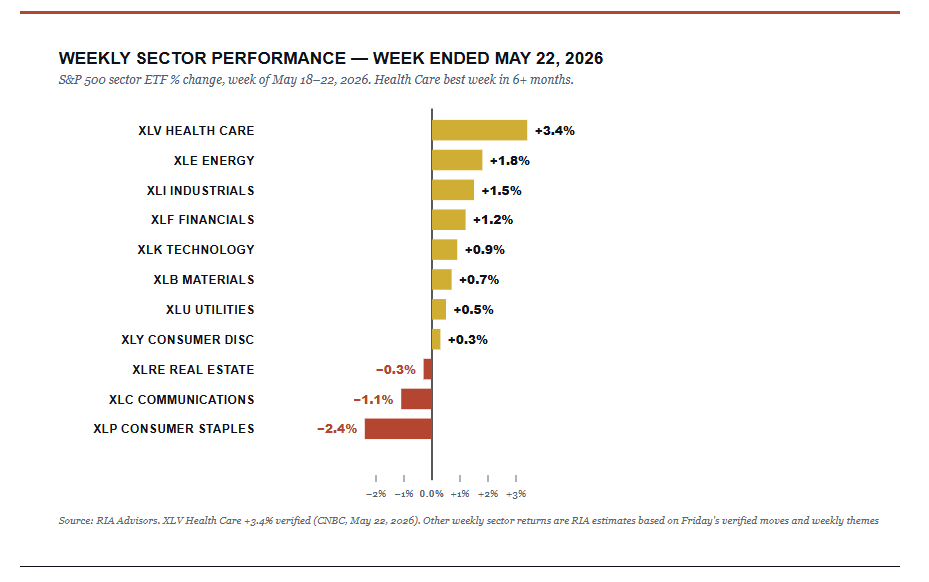
Sector leadership was the cleanest signal of the week. Health Care gained 3.4%, its best week in more than six months, with Merck up over 5% Friday alone. Energy rose with crude’s volatility but ended the week higher. Technology recovered Friday after Nvidia’s beat-but-light guidance on Wednesday left the AI complex flat through midweek. Consumer Staples lagged, hit hard by Walmart’s Thursday guidance miss that sent shares down more than 6%. Communications was the only sector lower on Friday, weighed by weakness in Salesforce-adjacent software, despite CRM rallying 2% on the session.
The VIX closed at 16.78, below 17 and consistent with an orderly tape. Gold slipped 0.76% to $4,508 as the safe-haven bid faded with the Iran headlines. The dollar held steady. Breadth improved modestly, with the proportion of S&P 500 stocks above their 200-day average ticking up to roughly 55% from 53.7% midweek. As we noted in last week’s report, this market has been running on a narrow set of leaders. The rotation into Health Care this week was the first real sign that breadth might be broadening rather than narrowing.
Heading into the holiday-shortened week ahead, the script is set up nicely for a continued grind higher, provided Friday’s PCE print cooperates. The FOMC minutes released Wednesday confirmed that several officials remain concerned about sticky inflation, which means any hot data this week immediately puts the rate-hike conversation back on the table. As we wrote in our summer market risk piece, the bull market still has structural support, but a single inflation surprise can change the regime quickly.
📈Technical Backdrop – Knocking On New All-Time Highs
The S&P 500 closed Friday at 7,473.47, just 43 points and 0.6% below the May 14 all-time high of 7,517.12. The index put in an intraday high of 7,506.32 on Friday before fading slightly into the close. We’re now sitting comfortably above all three major moving averages, forming a textbook bullish setup. The 20-day sits at 7,336 (1.8% below price), the 50-day at 6,987 (6.5% below), and the 200-day at 6,807 (8.9% below). The bull trend is intact, momentum has improved, and the only thing standing between us and a fresh record is a clean breakout above 7,517.
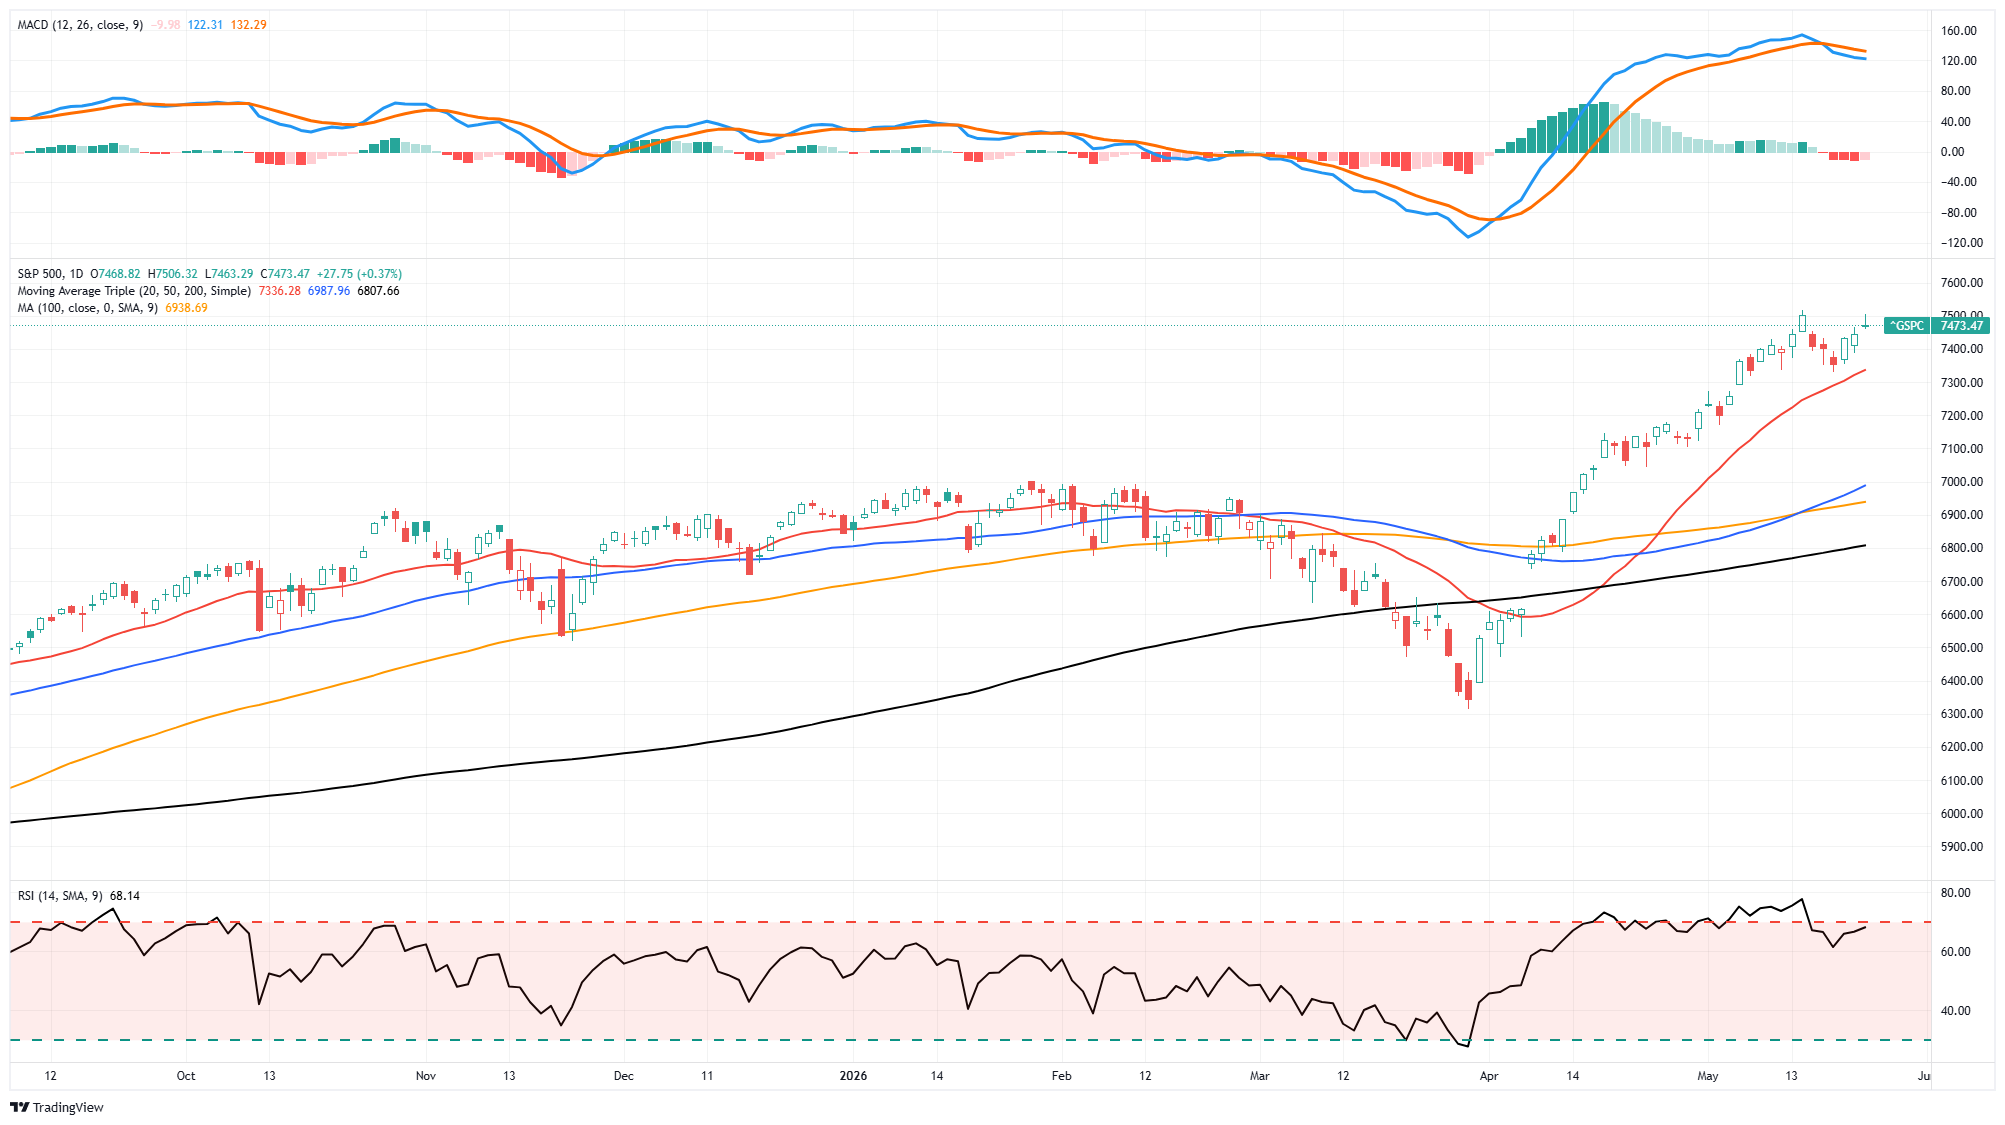
The 14-day RSI climbed to 68, up from 57 a week ago. That’s moving toward overbought, but not there yet. Historically, RSI readings between 60 and 70 during established uptrends produce more gains than losses. The acceleration in the MACD (momentum) indicator suggests a bit more risk, and the sell signal triggered last week remains intact. While that doesn’t mean the market will decline, the risk of a correction is increasing. Nonetheless, it does suggest that gains may be somewhat limited.
Breadth tells the same story but more cautiously. Roughly 55% of S&P 500 stocks now trade above their 200-day average, up from 53.7% midweek but still below the 70% reading from April. The Health Care rotation this past week was the first sign that breadth might be broadening. If that continues with Industrials and Financials catching a bid next week on any soft inflation print, the bull case strengthens substantially. If breadth narrows back to just the AI complex carrying the load, that’s the warning sign to watch.
For traders, the rules for next week are straightforward.
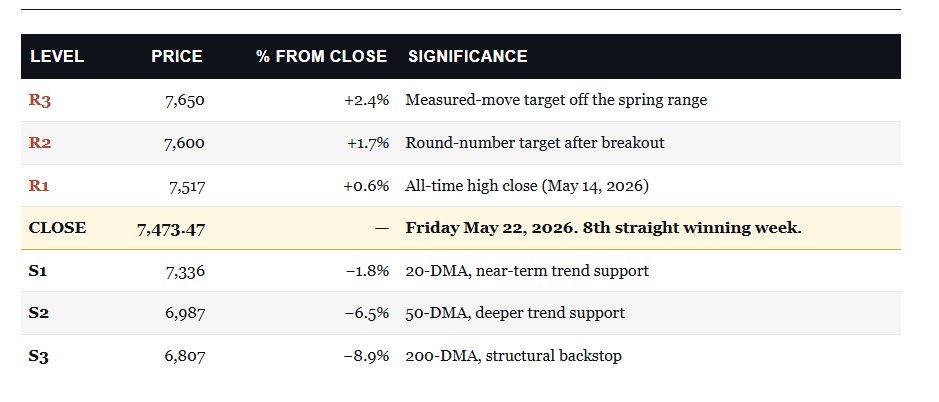
- A clean break above 7,517 with a daily close opens the path to 7,600 quickly.
- The next resistance after that sits near 7,650, a measured-move target off the spring trading range.
- On the downside, the 20-DMA at 7,336 is the first real test of the uptrend.
- A close below it that holds for more than 48 hours puts the 7,300 round number in play, then 7,200.
- Below those, the 50-DMA at 6,987 is the deeper trend test, and the 200-DMA at 6,807 is the structural backstop. Both of those would represent 6%-plus pullbacks from Friday’s close, which we’d consider buying opportunities rather than regime changes.
The most important signal from the technicals right now is resilience. The market closed Friday just below record highs despite the 30-year yield touching a near-two-decade high earlier in the week. It did so despite the Fed Chair transition that same morning. That kind of resilience does not happen by accident. It happens when underlying earnings strength and liquidity conditions are firm enough to absorb meaningful macro stress.
Next week, watch the 30-year and 10-year yields first thing Tuesday morning. If long rates resume falling with PCE on deck Friday, equities are set up well for another leg higher. If yields back up on any inflation surprise, the 7,336 20-DMA becomes the first real test of whether the eighth winning week was the top or just a pause.
🔑 Key Catalysts Next Week
The week after Memorial Day always packs a heavy data calendar into four trading days, and this one is no exception. Markets are closed on Monday, so traders return Tuesday morning to a stack of macro reports that will set the tone for June. The single most important release of the week is Friday’s PCE Price Index for April. That is the Fed’s preferred inflation gauge, and it comes out exactly when the bond market needs an answer.
Here’s the question every desk on Wall Street is asking right now. Did the energy spike from the Iran situation bleed into core inflation, or did the rest of the basket stay tame? Consensus is looking for headline PCE near +0.2% month-over-month and core PCE around +0.2%. Anything above +0.3% on core lights the fuse for another move higher in the long end of the curve. The 30-year yield touched 5.19% this past Tuesday, the first 19-year high. The long end pulled back through the back half of the week. A hot PCE print sends it right back to that resistance, and probably through it.
Before we get to PCE, several mid-week catalysts deserve attention. Tuesday brings Consumer Confidence, which has been drifting lower for three months. Wednesday delivers New Home Sales and the 5-Year Treasury auction, which will be a real-time test of bond demand at current yields. Thursday is the heaviest day, with the second estimate of Q1 GDP, weekly jobless claims, and Pending Home Sales all hitting before the bell. Q1 GDP came in at 2.0% on the advance read, and any meaningful downward revision would feed the slowdown narrative.
This is also Kevin Warsh’s first full week as Fed Chair. Any public comments he makes will be scrutinized for clues about his stance on rate cuts versus rate hikes. Markets are pricing the Fed to stay on hold through 2026 with a possible hike in early 2027, despite Trump’s vocal demands for cuts. Warsh has said he will not “predetermine” rates at the president’s request, but how he frames inflation in his first weeks shapes the narrative for the rest of his term. Watch for the first scheduled speech or interview.
On the earnings side, the calendar thins out considerably with most of the Q1 season behind us. Salesforce reports Wednesday after the close, and CRM rallied 2% Friday on rotation flow. Costco reports Thursday after the close, and that print matters even more given Walmart’s guidance scare last week. Costco’s commentary on member traffic and ticket size gives us a much clearer picture of the U.S. consumer. Dell reports the same night, and after Nvidia’s tepid reaction to Wednesday’s guidance, the AI capex narrative is on shaky ground. A miss or soft guide from Dell would put serious pressure on the entire enterprise hardware complex.
The asymmetric outcome is still a hot PCE print on Friday. A core read of +0.3% or higher sends the 30-year back above 5.20%. Equities would likely give back some of the eighth-winning-week’s gains, and the summer correction risk we’ve been writing about could come back into focus. The setup is binary, and we find out on Friday morning at 8:30 AM.

Need Help With Your Investing Strategy?
Are you looking for comprehensive financial, insurance, and estate planning services? Need a risk-managed portfolio management strategy to grow and protect your savings? Whatever your needs are, we are here to help.

💰 SpaceX IPO: What You Need To Know
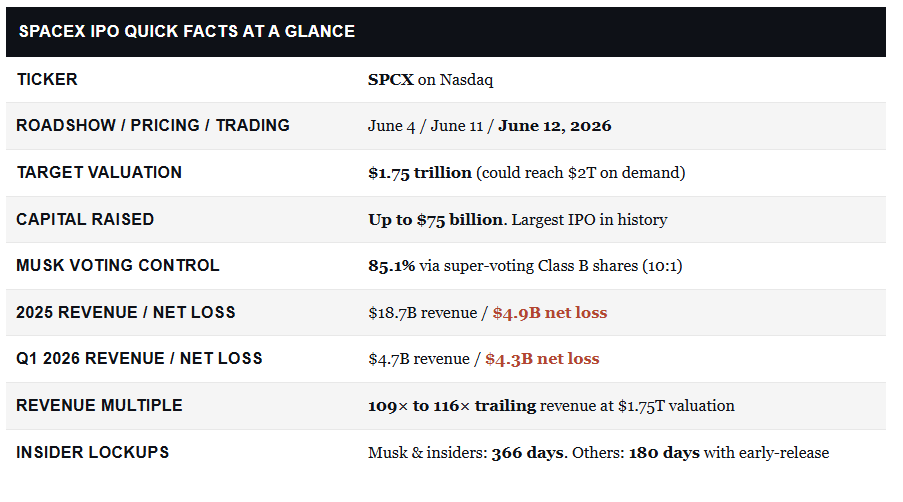
The SpaceX IPO will be the largest in history and is priced in less than three weeks. SpaceX filed its public S-1 on Wednesday, targeting a $1.75 trillion valuation, a $75 billion raise, and a Nasdaq debut on June 12 under ticker SPCX. Every client conversation this week has circled back to two questions. Should I buy on day one? And what does this do to the rest of my portfolio? In our recent piece on the spring rally, I argued that this market is running on a small number of mega-cap names. SpaceX walks straight onto that list the moment it trades.
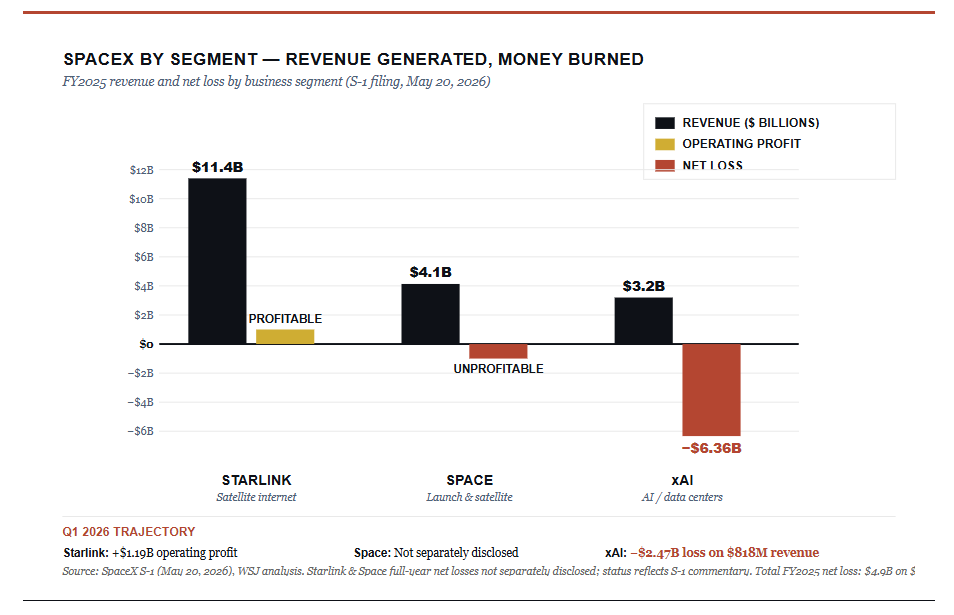
The financial picture in the SpaceX IPO S-1 is unlike anything we’ve seen at this valuation. SpaceX lost $4.9 billion in 2025 on $18.7 billion in revenue, and losses widened this year. Q1 2026 alone produced a $4.3 billion loss on $4.7 billion in revenue. The company lost almost as much in three months as it generated in revenue. That’s not a typo.
It’s really three businesses stitched together. Starlink is the only profitable piece, contributing $11.4 billion in 2025 revenue and a $1.19 billion operating profit in Q1 2026. The launch and satellite business added $4.1 billion but isn’t profitable. The xAI division, folded in via the February merger, lost $6.36 billion in 2025 and $2.47 billion in Q1 2026 on just $818 million in revenue. A profitable connectivity business sits next to a cash-burning launch operation and an AI startup lighting money on fire.
Musk holds 85.1% of voting power through 10-to-1 super-voting Class B shares. He cannot be removed as CEO. Buying SPCX on day one means buying a 14.9% voting interest in a company controlled by one person, whose other firms, Tesla and X, among them, are deeply intertwined with this one. That alone is a longer-term risk to consider.
The Hype Is Real. So Is The Insider Exit
Anyway, what you really want to know is whether you should buy the SpaceX IPO. I can’t tell you that, as you will have to determine that risk profile for yourself. However, I can provide you with some information to assist with your decision-making. Let’s start with the lock-up periods for insiders.
You’ll hear “fear of missing out” applied to the SpaceX IPO more than any IPO this cycle. The brand is recognizable, the scale is unprecedented, and the hype machine is running. But the lockup schedule is where investors need to focus. The early investors and SPVs that have been accumulating SpaceX shares for a decade get their first window to sell well before the company reports a single quarter as a public entity.
Musk and the largest insiders are locked up for 366 days. Pre-IPO investors holding through funds and SPVs face a 180-day lockup with early-release provisions baked in. Up to 20% of eligible shares can be sold shortly after SpaceX’s first quarterly results in early November 2026, with another 10% released if the stock holds a certain level on that date. That’s a planned exit overhang sitting above the stock through late 2026.
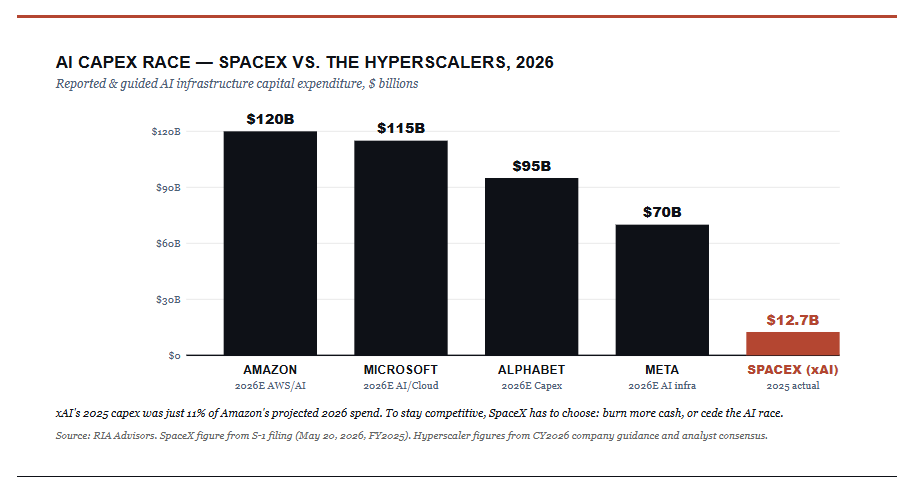
Now layer in the capex picture. SpaceX spent $20.7 billion in 2025. Fully 61% of that, $12.7 billion, went to xAI’s data center buildout. Launch and satellite combined spent $8 billion. Compare that to the public-market hyperscalers. Amazon, Microsoft, and Alphabet are each spending more than $90 billion annually on AI infrastructure in 2026. SpaceX is competing in AI with roughly a tenth of what rivals deploy. To stay competitive, that number must go higher. To get to profitability, it must come down. Those two paths are incompatible.
What An Instant Index Add Does To Your Index Fund
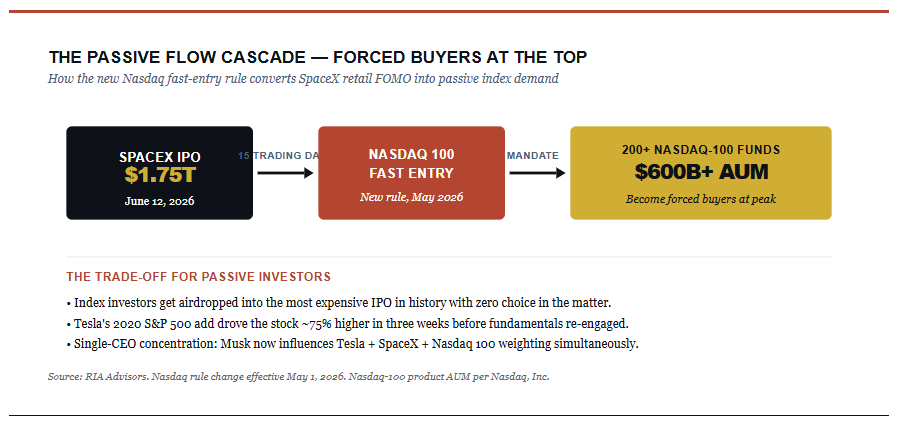
Next, there is the index impact. This is the part of the SpaceX IPO most retail investors aren’t thinking about, and the part that matters most for the broader market. On May 1, 2026, Nasdaq updated its Nasdaq 100 inclusion rules. Large new listings can now join within 15 trading days of going public, down from a three-month seasoning period. The change was designed for SpaceX, OpenAI, and Anthropic. The seasoning period existed for a reason. It gave the market time for price discovery before forced index buying distorted the tape. That window is now gone.
Here’s what that means in dollar terms. The Nasdaq 100 is tracked by more than 200 investment products with over $600 billion in assets. If SpaceX fast-tracks into the index 15 trading days after pricing, every passive Nasdaq 100 fund becomes a forced buyer. When Tesla joined the S&P 500 in 2020, forced index demand drove the stock from $400 to $700 in three weeks before fundamentals entered the conversation. Index funds had no choice. Their mandate is to track the benchmark, not to price-discover the new constituent.
The S&P 500 is the bigger story. Current rules require 12 months of public trading and four straight quarters of GAAP profitability, neither of which SpaceX satisfies. But in late April, S&P Dow Jones Indices launched a formal consultation on rule changes tailored to the SpaceX IPO, along with subsequent blockbusters coming like Anthropic and OpenAI. The proposal cuts the listing requirement to six months and waives the profitability test entirely for megacap names. The new rules could be in place before SpaceX’s IPO in June. Why is this so important? As noted above, the passive index problem is magnified by the S&P 500, which is benchmarked to roughly $24 trillion and is roughly 40 times the size of the Nasdaq 100. If S&P adopts before SpaceX trades, the forced-buying problem isn’t a Nasdaq problem. It’s the whole index complex.
“Nasdaq sold out passive investors by guaranteeing inclusion to SpaceX, clearing the way for more tech giants to do the same. Investors in Nasdaq funds will end up becoming forced buyers of these assets at the highest valuations the public markets have ever seen.”
TheStreet, May 5, 2026
The broader risk is concentration. The Magnificent 7 already drives more than 30% of the S&P 500’s market cap. Adding a $1.75 trillion SpaceX means a single CEO now exerts gravitational pull over Tesla, SpaceX, and the entire Nasdaq 100. Index investors don’t realize the idiosyncratic risk they’re taking on.
Should You Buy On Day One Or Wait?
The question I get asked most. Should I buy the SpaceX IPO on June 12th or hold off? I can’t tell you that specifically. However, the answer is in the data if you are so inclined. Academic research on IPO performance is unambiguous. The intraday high almost always prints in the first 30 to 90 minutes of trading on day one. Institutional allocates flip into retail demand, momentum buyers pile in, and the peak prints before the bid can absorb it all. From there, prices fade in a remarkably consistent pattern.
Hot-market IPOs decline 4% to 8% by day one’s closing print. By week one, prices have faded 8% to 18% from the peak. Greenshoe stabilization kicks in here, where underwriters buy back up to 15% of the offering. But that cushions the floor near the offer price, not the day-one high. Weeks three and four are pure price discovery. The average cohort sits 12% to 23% below the peak. Stocks with more than 60% first-day returns actually underperform stocks with no first-day pop over the following year.

Three factors make the day-one peak likely to be high and the fade steep for SpaceX.
- The hype is extreme, Musk reserved up to 30% of IPO shares for retail, and a 5-for-1 split last week dropped the per-share price to about $105. That’s the textbook recipe for a parabolic first-day spike.
- Second, the SPV early-release supply overhang sits at the 6-month mark. Anyone buying day one has to live through that scheduled selling.
- Third, with no positive earnings to anchor a valuation, if sentiment shifts, there’s no fundamental floor.
If you must own SPCX on day one, expect to be down 15% to 25% by the time the first earnings print arrives in November. If you wait until that print and let the lockup overhang clear, you almost certainly buy at a better price. That’s not a recommendation against owning SpaceX. It’s a recommendation against buying it at the most expensive point in its public life.
However, there is no guarantee that it will be the case. That is just what the history of other IPOs tells us, so measure your risk accordingly.
What Should Investors Do Now: Five Tips To Navigate The SpaceX IPO
The SpaceX IPO will be a defining event for this market cycle. The hype is enormous, the index distortion is real, and the post-IPO fade is one of the most consistent patterns in market history. Here are five tactical principles to consider.
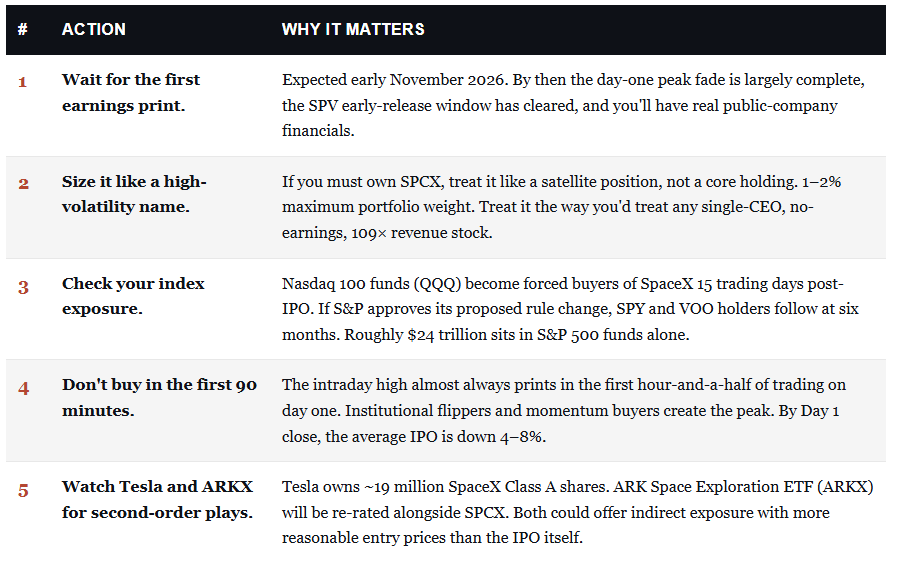
Make no mistake. The SpaceX IPO will be enormous, and the company is one of the most impressive of our generation. The launch business is unmatched, Starlink is genuinely changing global connectivity, and the founder has a track record few can compete with. None of that changes the math of what happens when a 109× revenue, money-losing, single-CEO-controlled company gets airdropped into the largest passive index complex in history. Great companies and great investments are not the same thing. The price you pay matters. Day one is likely to be the worst price you’ll pay for SPCX in the next twelve months.
But no one really knows for sure.
🖊️ From Lance’s Desk
This week’s #MacroView blog discusses recent concerns about rising interest rates and why much of the fear is misplaced.
Also Posted This Week:
- The AI Economy: Looking Beyond The Facade Part 1 – RIA – by Michael Lebowitz
- Rising Interest Rates: Why The Narrative Fails Against The Data – RIA – by Lance Roberts
📹 Watch & Listen
Is there a risk of a market correction ahead? I dig into the charts and examine the potential for a market reversal after 8 weeks of advances.
Subscribe To Our YouTube Channel To Get Notified Of All Our Videos
📊 Market Statistics & Analysis
Weekly technical overview across key sectors, risk indicators, and market internals

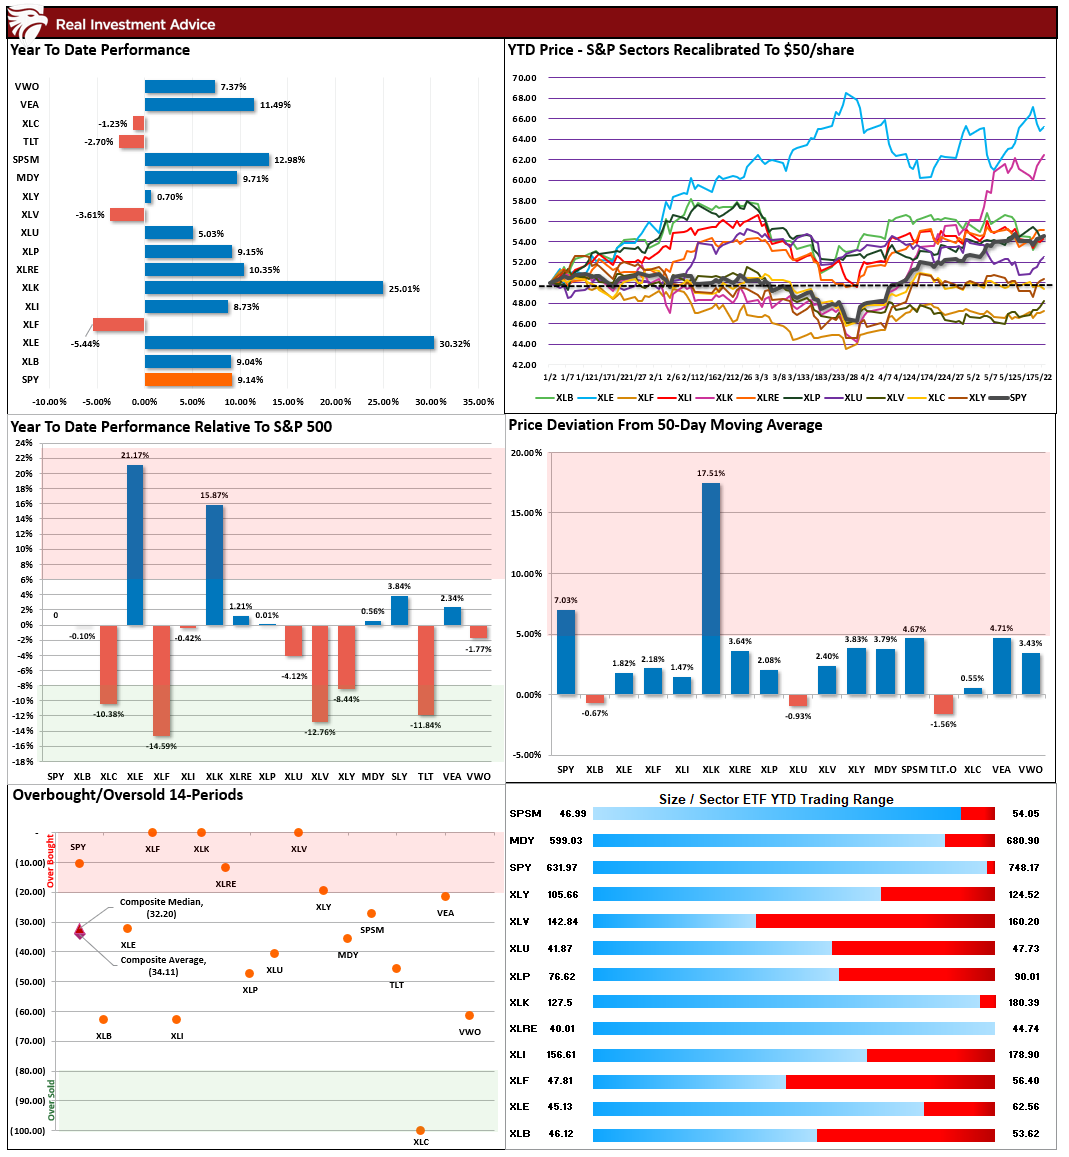
💸 Market & Sector X-Ray: Market Cracks Support
As we discussed last week, the market is now bifurcated, which historically suggests we could see a rather rapid internal market rotation (risk on to risk off). However, for now, the rather narrow technology trade continues to dominate, with that sector now catching up to Energy after its dramatic early-year surge. The rest of the market, however, has been mostly flat since mid-January.
📐 Technical Composite: 88.22 – Market Approaching Extreme Overbought
Despite some sloppy trading this past week, the market’s bullish bias continues, and the weekly technical composite is now approaching more extreme overbought territory. Previous market peaks typically occur at readings of 90 or above.

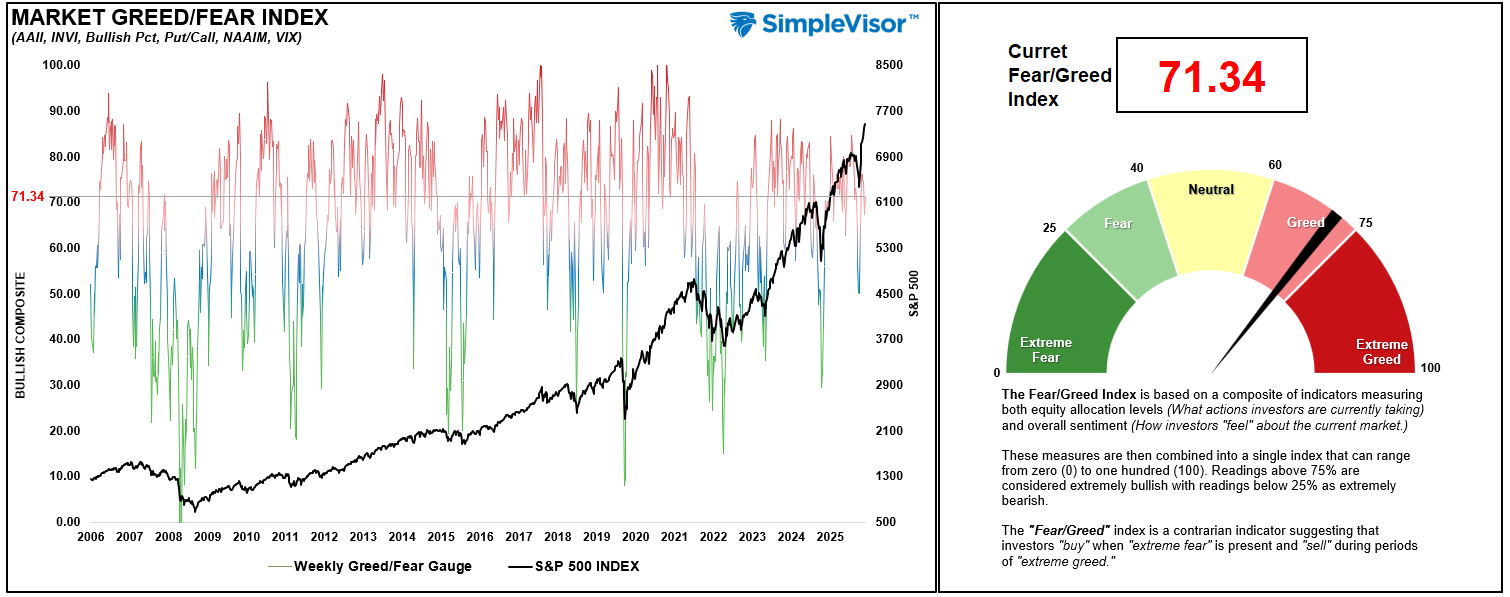
🤑 Fear/Greed Index: 71.34 – Greed Ticks Up With The Market
Investor sentiment and positioning ticked up this past week after a brief decline, as investors chased stocks higher amid hopes of a resolution to the Iran crisis. Markets are stretched but bullish exuberance, while increasing, is not at levels normally associated with short-term market tops.
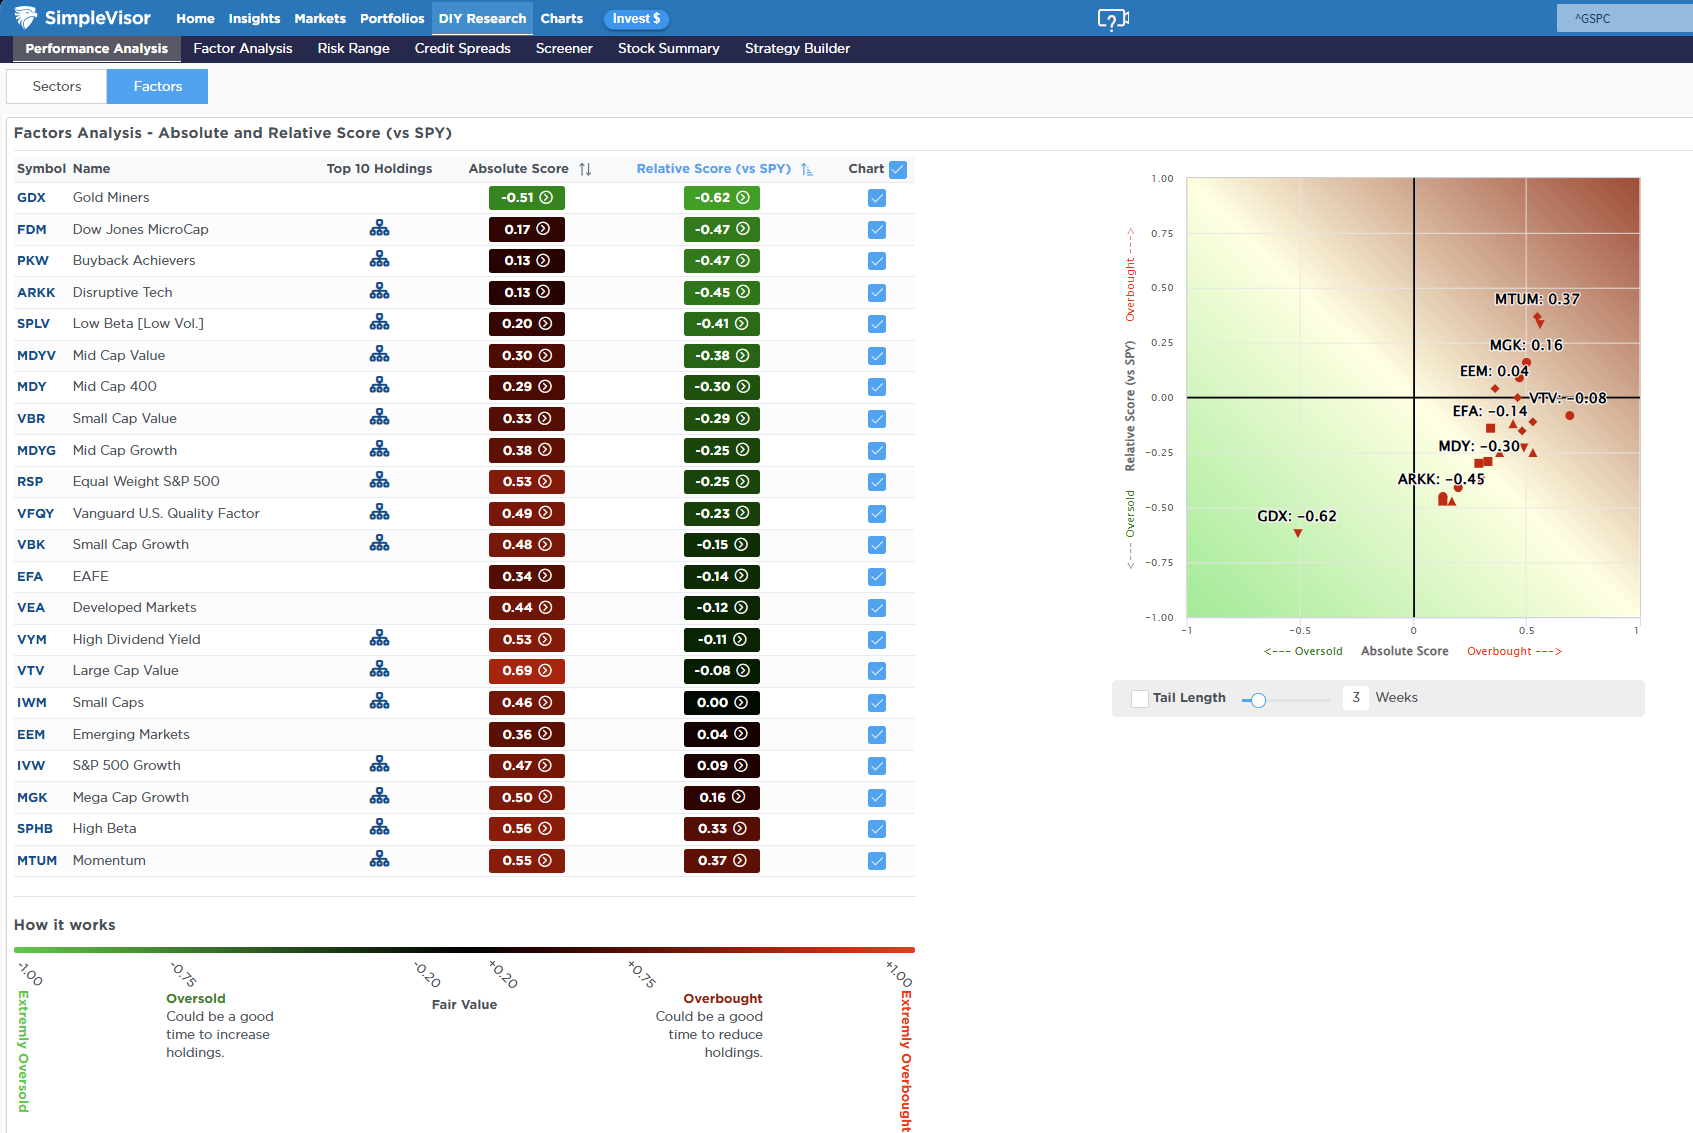
🔁 Relative Factor Performance
While Momentum has cooled a bit in recent weeks, it remains the most overbought factor and is being driven by the push into Technology. The most oversold factors are Gold Miners, which we warned in January were due for a more significant “risk off” rotation which has now occurred. In fact, most of the early-year “reflation trade factors are now the largest laggards of the market.
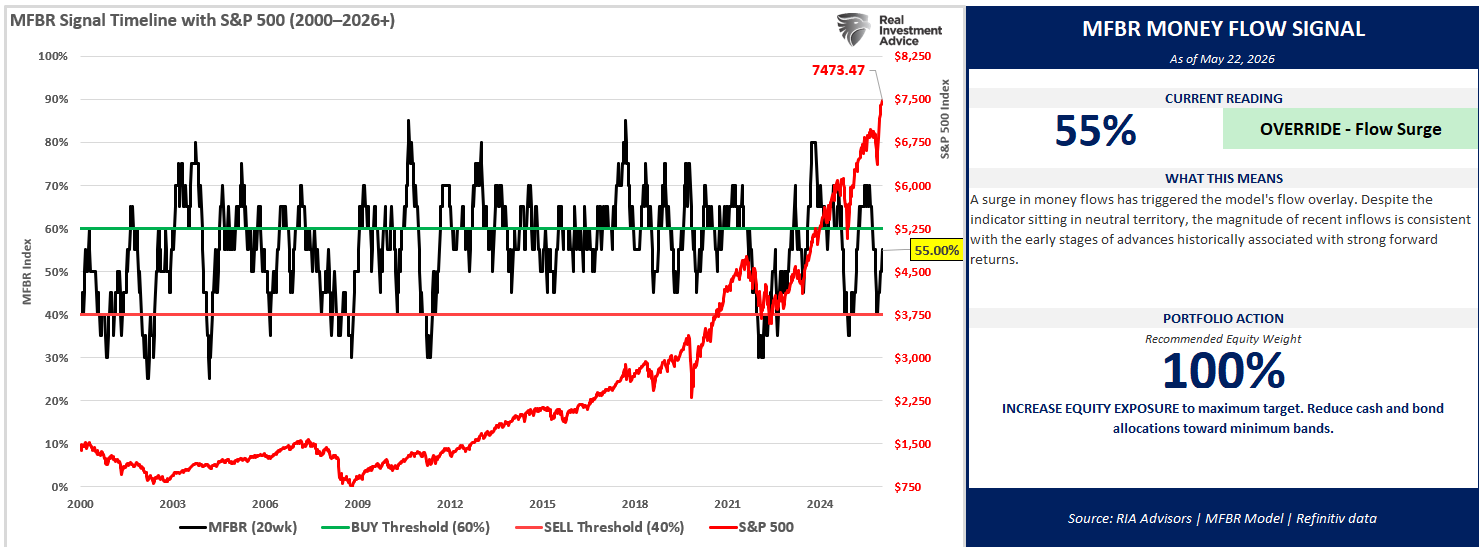
📊 MFBR Index (Money Flow/Breadth Ratio Indicator): 55% = Bullish
NEW! MFBR Index: The Money Flow Breadth Ratio (MFBR) model is a rules-based equity allocation framework that uses weekly S&P 500 money flow data to generate buy, sell, and neutral signals. It is designed to systematically adjust portfolio equity exposure in response to the direction and persistence of institutional capital flows, aiming to reduce drawdowns while capturing the majority of market upside.
“As of May 22, 2026, with the S&P 500 at 7,473.47, the Money Flow Breadth Ratio (MFBR) stands at 55% and rising. This places the indicator in the 50-60% range, triggering a OVERRIDE – Flow Surge signal. The prior week reading was 50%, representing a 10% decline over the trailing four weeks. The model currently recommends HOLDING exposure at 100%, a level that has remained since April 17, 2026 (5 weeks). This reflects a FLOW-OVERLAY OVERRIDE: the trailing 4-week net dollar flow has swung sharply positive (>$300B) after a deeply negative prior 4 weeks, a historically strong contrarian buy signal.”
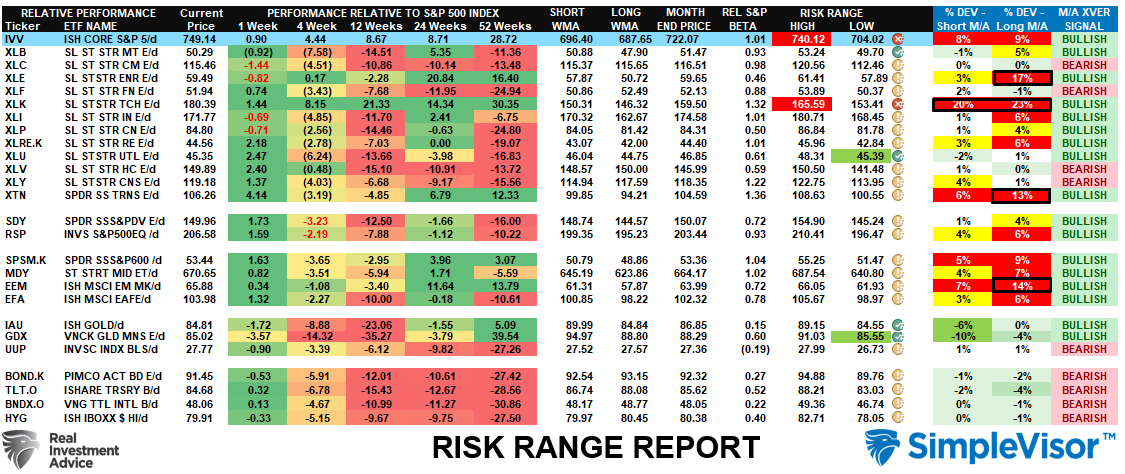
📊 Sector Model & Risk Ranges
Overall, the broad market is very overbought and trading well above its normal monthly range, along with Technology, which has been responsible for the majority of the market’s recent advance. Technology is increasingly deviating from its short- and long-term means, and a reversal is becoming much more likely. Along with Technology, Energy, Transportation, and Emerging Markets are also very deviated from the means, and the risk of a rotation remains elevated. Take profits and rebalance risk accordingly.
Have a great week.
Lance Roberts, CIO, RIA Advisors

