Jim Bianco at Bianco Research shares his views on the great inflation debate. When it will come, how big it will be, and when the Fed will hike.

When and Why Will the Fed Hike?
This is a guest post by Jim Bianco who explains his views on When Will the Fed Hike and Why.
Summary
The market is starting to see a Fed hike on the distant horizon. This is how a shift in thinking begins. The driving reason for this change seems to be a resurgence of inflation over booming real growth.
Over the summer, the Fed started suggesting they would hold off on any rate hikes for years. In late July (brown line), the market was flirting with the idea of negative rates, as shown by the fed funds futures curve.
By late October (blue line), the forward curve was back to positive, but still not pricing in a rate hike for years. A rate hike is expected when the implied yield is above 0.125%.
The combination of the election and Pfizer’s vaccine news resulted in the fed funds curve jumping higher (cyan and red lines). This morning (orange line), the market is getting closer to pricing in a 2023 rate hike.
This is how a shift in thinking begins. The market prices in a distant hike and then start to move it closer and closer to the present as data warrants.

Why Is This Happening?
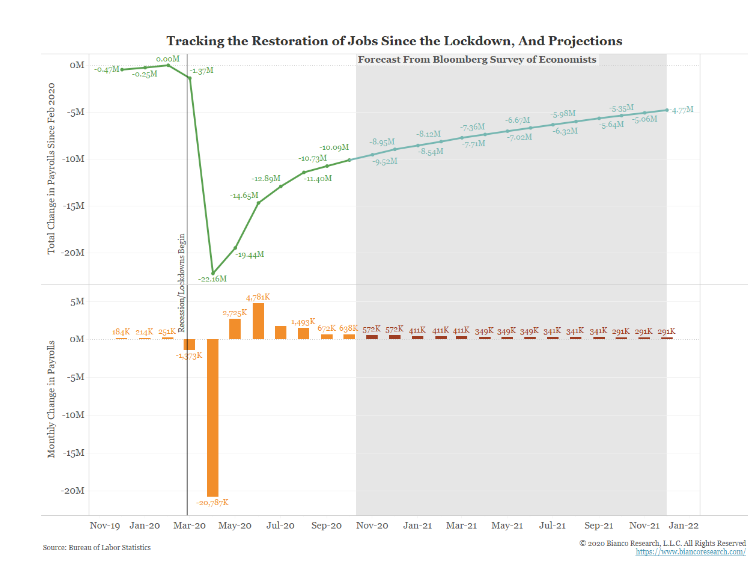
The next chart shows the jobs lost from the pandemic (cyan) and the projection of non-farm payroll growth from a survey of about 70 economists conducted by Bloomberg (shaded area). To date, over 10 million jobs lost to the pandemic have yet to be recovered (green line). This shortfall is expected to be cut to 4.7 million jobs by the end of 2021 (cyan line). Given the Fed’s preference for jobs over inflation, this means there should be no talk of the Fed hiking rates. Yet, the market is inching toward that reality.
Restoration of Jobs
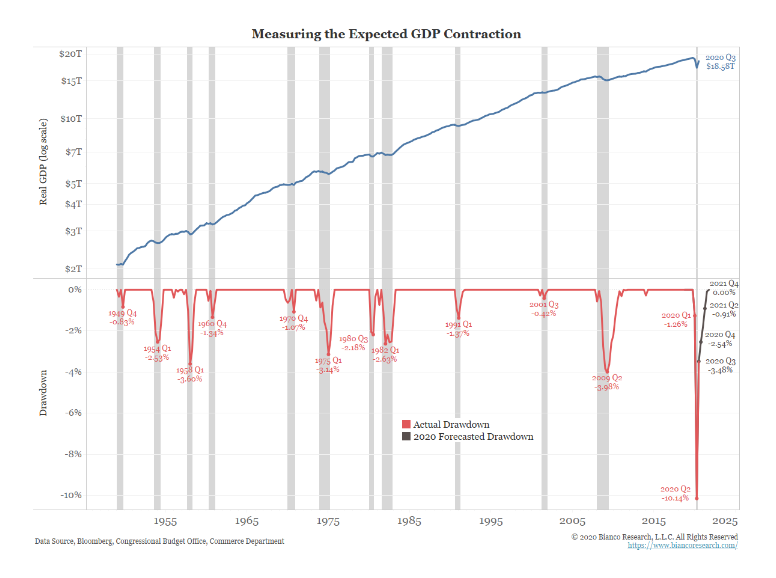
This same survey of economists expects economic growth to slow to pedestrian levels between now and the end of next year. No estimate, even after factoring in the election and vaccine news, expects real GDP growth to top 4% through the end of 2021. It is too early to consider 2022 forecasts.
With these levels of expected growth, real GDP is not expected to recover its previous peak (Q4 2019) until Q4 2021 (black line).

Measuring the Expected GDP Contraction
All of this is to say there is no reason for the market to start thinking about rate hikes or even higher long rates. But that is what is happening. Why?
We believe the market is pricing in a higher likelihood of inflation.
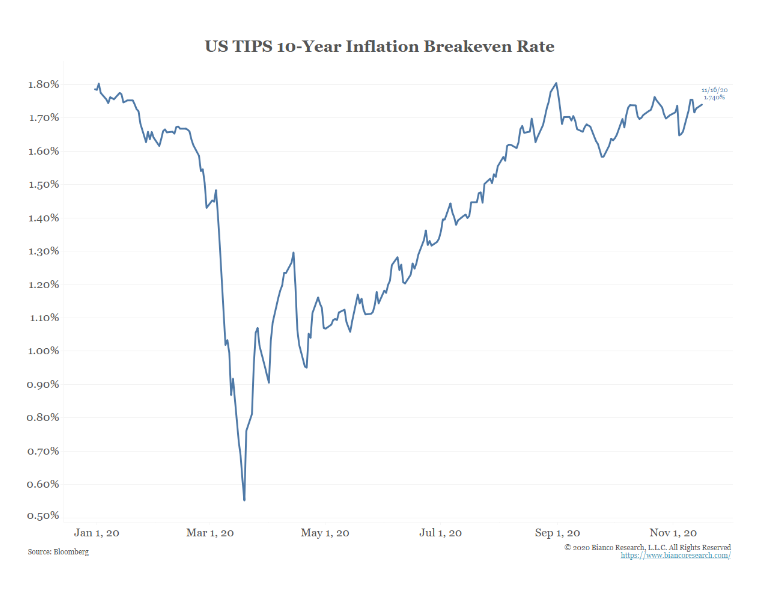
The next chart shows the 10-year inflation breakeven rate continues to move higher, suggesting more future inflation is being priced in.
US TIPS 10-year Inflation Breakeven Rate
But it is important to define “high inflation.”
According to the Fed’s preferred measure of core PCE, a move above 2.5% on a year-over-year basis would essentially be a 27-year high in inflation. We would define this level as high.
Core PCE
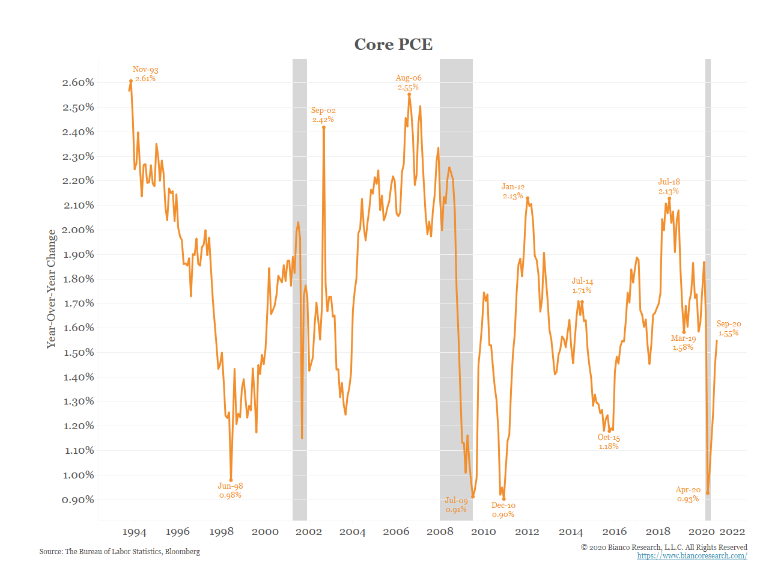
The next chart shows core PCE on a rolling 5-month annualized basis. In the five months ending in April 2020, when the pandemic really began taking hold, prices declined the most in a generation. During the re-opening (five months ending in September 2020), prices rebounded at their fastest rate since the earlier 1990s.
5-Month Annualized Core PCE
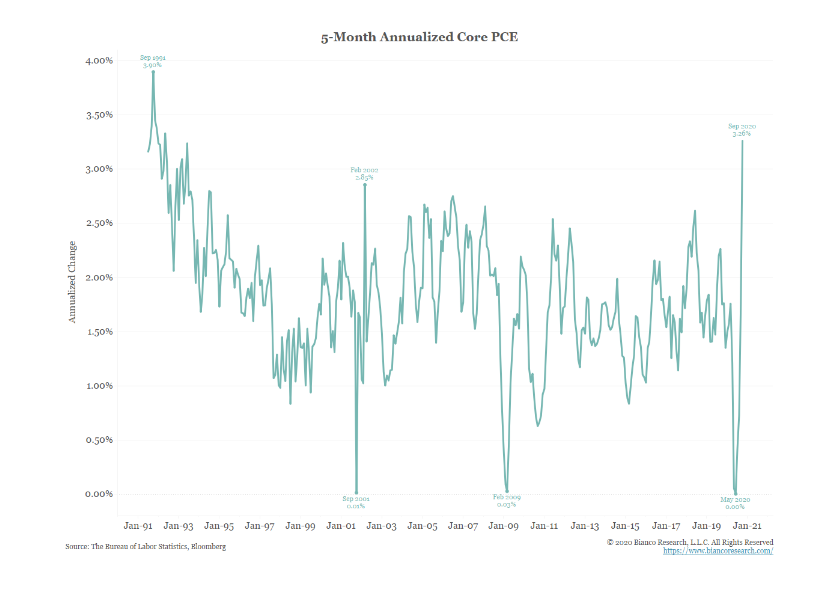
We do not expect prices to continue to accelerate at this level, but we do expect prices to continue to advance enough to challenge 2.5% on a year-over-year basis next year.

Why Will Inflation Advance?
Above we showed that the economy is below potential and will not recover the lost GDP for years. This means less supply that should help reduce excess capacity in the economy, especially given population growth is not reversing, so the demand for goods and services will not wane as much.
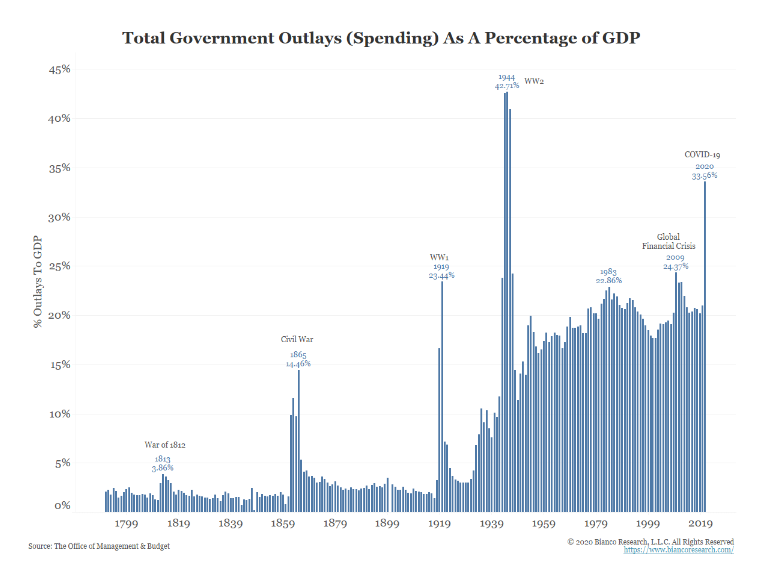
In addition to reduced supply, the stimulation of demand has been unprecedented. As the next chart shows, the government’s total outlay (spending) was over 33% of 2020’s GDP. In the 200+ years show, the government only had a bigger footprint on the economy in the war years of 1943 to 1945 (note the government’s fiscal year ends September 30, so 2020 is the full year).
Total Government Outlays as a Percentage of GDP
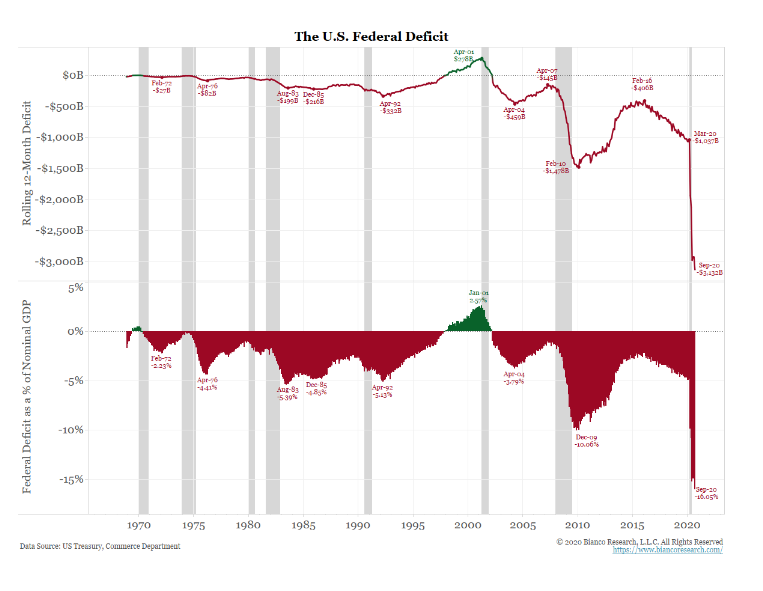
This spending has led to massive government borrowing. This has blown out the deficit to $3.13 trillion (top panel), or more than 16% of GDP (bottom panel).
The U.S. Federal Deficit
16% of GDP is rarefied air for the deficit. Only the year after WW1 (1919) and the WW2 years of 1943 to 1945 were larger.
Surplus or Deficit as a Percentage of GDP
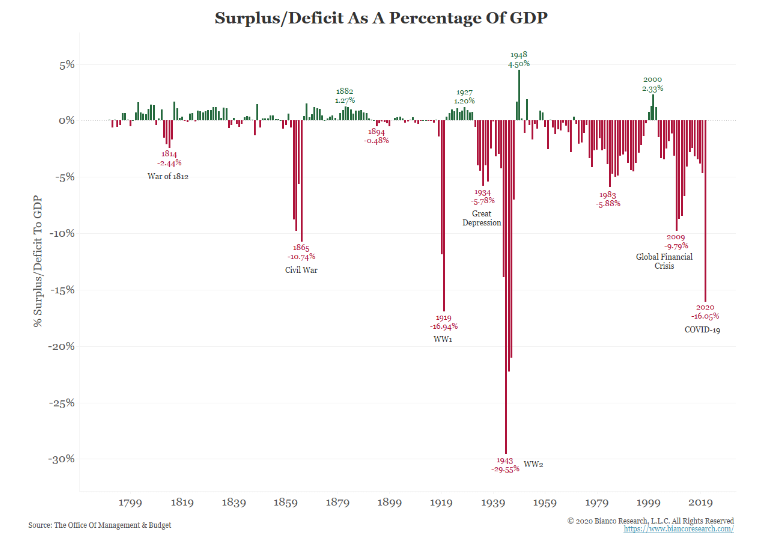
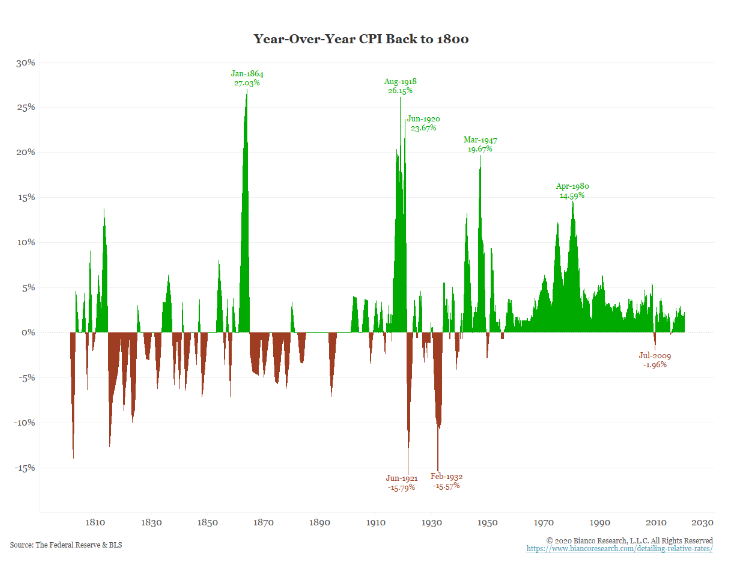
The chart above shows huge deficits relative to GDP in 1864, 1919, 1943 to 1945, and now. As the chart below shows, all these periods aligned with bouts of high inflation.
Huge deficits mean huge spending. Huge spending bids prices higher, otherwise known as inflation.
Year-Over-Year CPI Back to 1800

Why Does Inflation Matter?
Think of the Fed as a post and the bond market as a horse tied to that post. The horse will remain in place, tied to that post, unless spooked by inflation. The horse has the ability to rip that post from the ground and run wild. The post cannot stop a scared horse.
We have argued the 0.33% low in 10-year yields on March 9 marked the end of the 39-year bull market. Rates should be moving higher, but they are being suppressed via massive QE. At some point, we expect the “horse” to tear the post from the ground and start running with higher yields.
End Bianco Guest Post
According to Bianco, the Horse has not yet left the barn, but the Fed cannot keep the horse penned in forever.
That’s quite the presentation and a very good case.
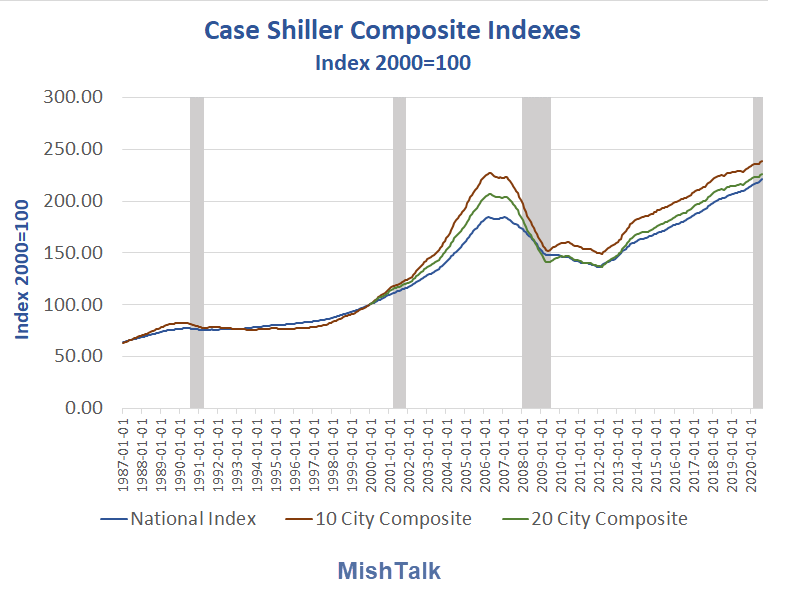
If we factor in housing prices, inflation is already roaring.
Case Shiller Composite Indexes
I would be more convinced of an inflation surge had Democrats won the Senate and Progressives got the agenda they wanted.
A longs as Republicans control the Senate the agenda will not go totally bonkers.
Yet, it is hard to say what bonkers even means. No one even bats an eye at talk of $3.13 trillion deficits.
The Wall Street Journal notes Investors Bet Economic Recovery Won’t Spark Jump in Inflation
“The big picture view is that the disinflationary effects of the pandemic are outweighing the inflationary effects,” said Gero Jung, chief economist at Mirabaud Asset Management. “We think inflation will come down even further” in the short term.
Longer-term, expectations haven’t changed significantly. The U.S. 10-year inflation break-even rate, a measure of how much inflation investors expect annually over the next decade, was largely flat at 1.72% on Wednesday, compared with 1.77% at the end of last year. At this year’s highest, it was about 1.8% in August.
“We’ve been long inflation, with a positive view on the recovery story, particularly because of very loose monetary and fiscal stimulus working in tandem. Now we’re starting to question that,” says Adam Skerry, rates, and inflation fund manager at Aberdeen Standard Investments.
Two Inflationary Tail Risks For US Investors
Lacy Hunt at Hoisington Management is still a bond bull, but he has concerns about what the Fed might do.
Hunt sees Two Inflationary Tail Risks For US Investors
We identify two-tail risks for long term Treasury investors: (1) a huge new debt-financed fiscal package and (2) a major change in the Fed’s modus operandi. The first risk would change the short-run trajectory of the economy. This better growth, although short-lived, could place transitory upward pressure on interest rates in a fashion that has been experienced many times. Over the longer run, disinflation would prevail, and the downward trend in Treasury yields would resume.
The second risk would bring a rising inflationary dynamic into the picture, potentially becoming much more consequential. As this dissatisfaction intensifies, either de jure or de facto, the Federal Reserve’s liabilities could be made legal tender or a medium of exchange. The Fed has already taken actions that appear to exceed the limits of the Federal Reserve Act under the exigent circumstances clause. However, so far, they are still lending and not directly funding the government’s expenditures in any meaningful way. But some advocate making the Fed’s liabilities spendable, and a few central banks have already moved in this direction. If the Fed’s liabilities were made a medium of exchange, the inflation rate would rise, and inflationary expectations would move ahead of actual inflation. In due course, Gresham’s law could be triggered as individuals move to hold commodities that can be consumed or traded for consumable items. This would result in a massive decline in productivity. Thus real growth and the standard of living would fall as inflation escalates.
Questions
What will Congress do for those who don’t have job?
Those who kept their job and are working at home got a huge income boost.
What about asset prices? The Fed targeted the stock market and that boosted home prices as well.
A sustained plunge could be quite deflationary, but I have given up attempting to figure out when bubbles will pop. I sit in gold instead.
Open Mind
My readers know that I have dissed most inflation claims for years, decades actually, (at least as the Fed and BLS calculate inflation).
Now I have an open mind as the bond market is flashing some warning signs, and so is the Fed, as observed by Lacy Hunt.
Lend vs Spend
It’s important not to confuse the Fed’s ability to lend with ability to spend.
Here is Lacy Hunt in a Bloomberg Interview in August 2020
Bloomberg: Lastly, I want to ask you about the rise of Modern Monetary Theory within economics and some proposals to have the Fed give money directly to individuals.
LH: The great risk is that we become dissatisfied with the way things are, and either de jure or de facto, the Federal Reserve’s liabilities are made legal tender. The Federal Reserve as it’s constituted today can lend, but it cannot spend. Now, they’ve done some things that are different from what the Federal Reserve Act said under the exigent circumstances clauses, but so far, they’re lending.
LH: Some folks want to make the Fed’s liabilities legal tender. Now, if that happens, then the inflation rate would take off. However, everyone would be totally miserable in concise order because no one would want to hold money. You would trigger Gresham’s Law — people would only want to hold commodities they can consume and commodities that can be traded for others.
LH: But there is that risk that you could use the Fed’s liabilities to pay directly. The Bank of England has made a small move in that direction — they say it’s temporary. Others want to try that because they’re frustrated that issuing the debt is not getting the job done. So we could significantly alter the whole structure of the U.S. economy. But if you use the Fed’s liabilities for directly funding goods and services, the consequences could be very extreme and very quick.
For the full interview and a followup discussion, please see Bond Bull Lacy Hunt Warns of a Huge Monetary Risk
Is the Bond Bull Over?
Keep your eye on the treasury barn door. I would not at all be surprised if the 0.33% low in 10-year yields on March 9 marked the end of the 39-year bull market.
What Value Remains?
If you believe, as I do, that the Fed will not take interest rates negative, what value in the 10-year treasury remained at 0.33%?
Now at 0.85% perhaps one can find 50 basis points of “value” with a risk of 200 to 300 basis points of losses.
There is more value but also more risk in the 30-year long bond yielding 1.56%.
Why Not Negative?
The Fed can easily see negative rates hurt Japan and the ECB. Whereas the ECB punished banks by charging them interest on excess reserves, the Fed slowly recapitalized US banks over time by flooding the banks with excess reserves then paying them free money all the while.
The Fed might try other tactics such as making the Fed’s liabilities legal tender, but that would have Hunt headed for the door in a flash.
Hello Fed, Low Interest Rates Do Not Promote Growth
To further discuss these ideas, including negative rates and a recap of Lacy Hunt’s position, please see Hello Fed, Low Interest Rates Do Not Promote Growth.
All bull markets come to an end. This end will have fireworks if the Fed does the wrong thing.


