The Relative Value Sector Report provides guidance on which industries or sectors are likely to outperform or underperform the S&P 500. This new report will be updated every Friday.
The Users Guide provides details on the model’s relative value calculations as well as guidance on how to read the model’s graphs.
This report is just one of many tools that we use to assess our holdings and decide on potential trades. Just because this report may send a strong buy or sell signal, we may not take any action if it is not affirmed in the other research and models we use.
Current Commentary
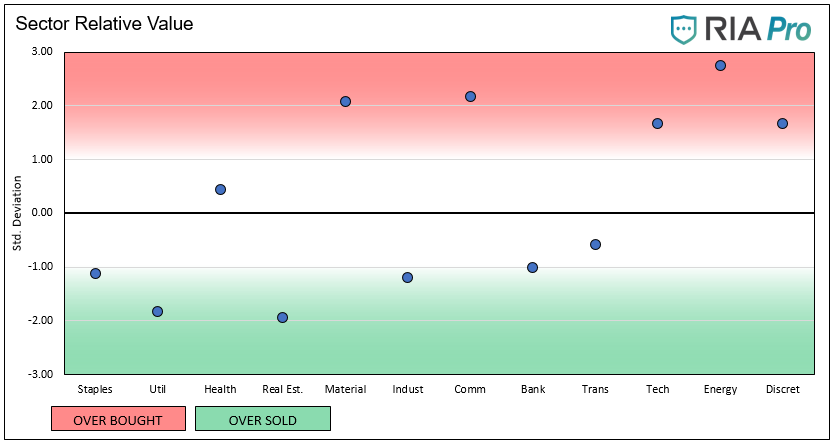
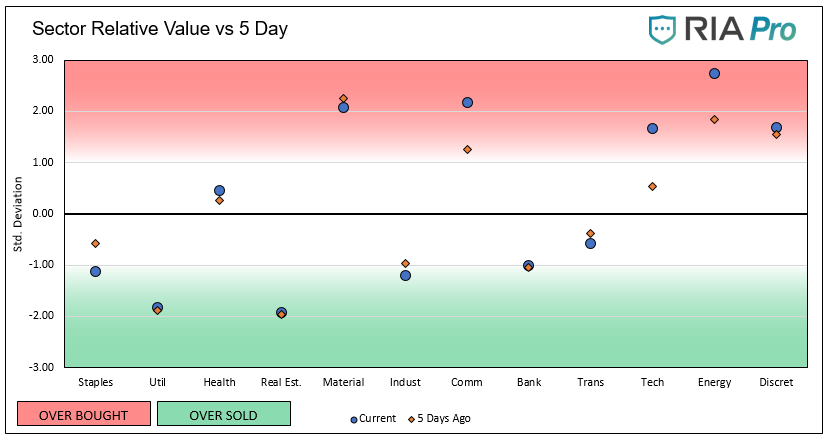
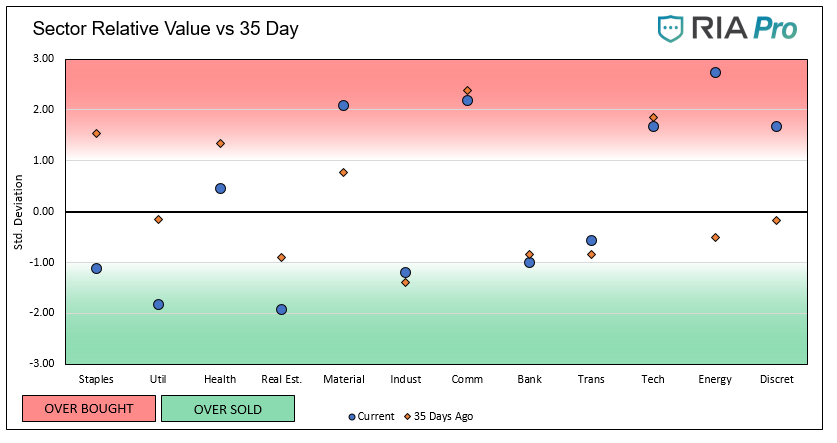
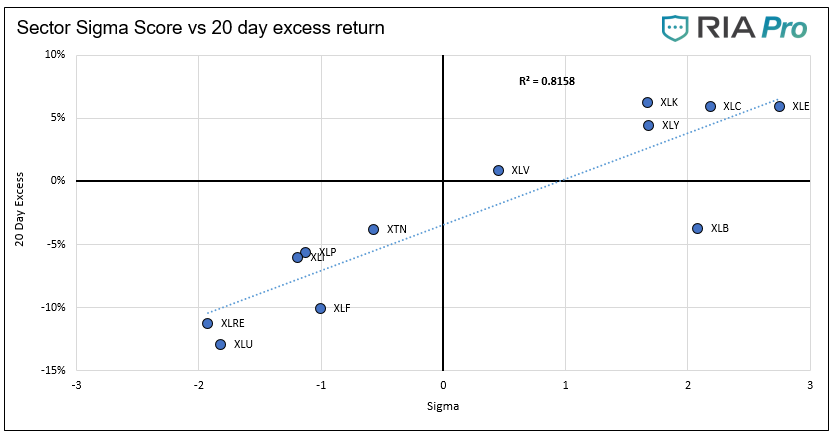
- There is a sharp divergence between the haves and have nots. Currently, only two (Health Care and Transportation) of the eleven sectors are not in either oversold or overbought territory. In prior weeks a majority of the sectors were straddling between overbought and oversold.
- Not surprisingly, conservative sectors like Staples, Utilities, and Real Estate are lagging the rising market and are now looking more attractive.
- Technology (XLK) and Communications (XLC) remain relatively strong as they are perceived as shelters from the economic impact of the Corona Virus.
- Energy (XLE) has been a market favorite over the last two weeks and is now extremely overbought at 2.75 standard deviations from the norm. We are comfortable with our stop loss in place as the sector is fundamentally cheap, especially if the supply/demand fundamentals improve as the economy opens up.
- The Real Estate (XLRE) and Utility sectors (XLU) are relatively cheaper in part due to the recent slight increase in bond yields.
- Staples (XLP) are more appealing as a potential position add on. XLP has worked off its overbought condition and finally moved into oversold territory.
- Discretionary (XLY) is approaching deeply overbought territory. We do not own XLY, as many of the underlying companies are very sensitive to the economic impact of the virus.
- The R-squared on the sigma/20 day excess return scatter plot is .81, meaning the model is working particularly well over the last four weeks in determining which sectors are over and underperforming.
Graphs
The ETFs used in the model are as follows:
- Staples XLP
- Utilities XLU
- Health Care XLV
- Real Estate XLRE
- Materials XLB
- Industrials XLI
- Communications XLC
- Banking XLF
- Transportation XTN
- Energy XLE
- Discretionary XLY
- S&P 500 SPY