
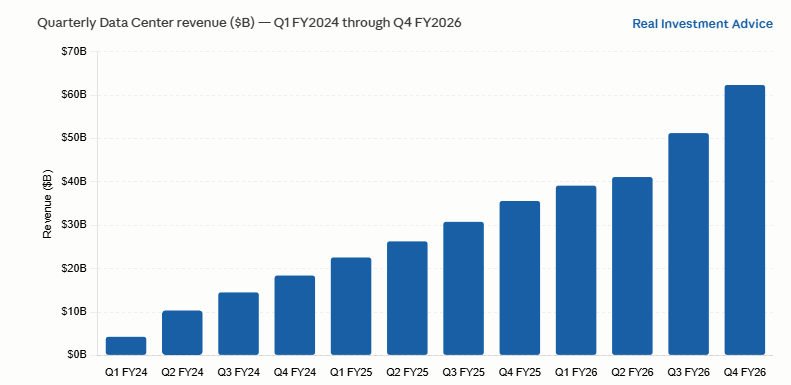
When investors discuss the semiconductor chips driving AI infrastructure, they almost always key on Nvidia GPU chips. That’s not surprising, given the surge in Nvidia GPU revenue as we share below. Since 2024, GPU revenue has risen by over 1300% while Nvidia shares are up almost 400%. Nvidia has certainly played the lead role in designing AI chips, but there are other types of chips and companies profiting from AI. As seen in the surge of the SOX semiconductor index, the market now recognizes companies that design CPU and Memory chips. To better appreciate the chip boom, we summarize the three distinct chips that an AI server requires.
- GPUs (Graphics Processing Units) handle the heavy compute work. GPUs are the cornerstone for AI as they train and run AI models. Nvidia has an estimated 80%+ market share in AI GPUs. AMD is Nvidia’s primary challenger, though the gap is huge.
- CPUs (Central Processing Units) manage workflows, direct data traffic, and run the software that tells GPUs what to do. Intel and AMD are the largest CPU designers.
- Memory Chips are where the bottleneck often lives. DRAM, particularly High Bandwidth Memory (HBM), sits alongside the GPU and feeds it data fast enough to keep pace with the compute. Without sufficient memory bandwidth, even the GPU idles. Micron, Samsung, and SK Hynix are the three companies leading.
From an investment perspective its vital to realize that the AI build-out isn’t a single-chip story. While Nvidia gets the headlines, every GPU they sell requires CPUs and memory chips. However, the three chips’ profit margins differ widely. Nvidia’s GPUs command an approximate 75% margin, while CPUs are closer to 50%, and memory chips are cyclical with a wide 25-50% band.
What To Watch Today
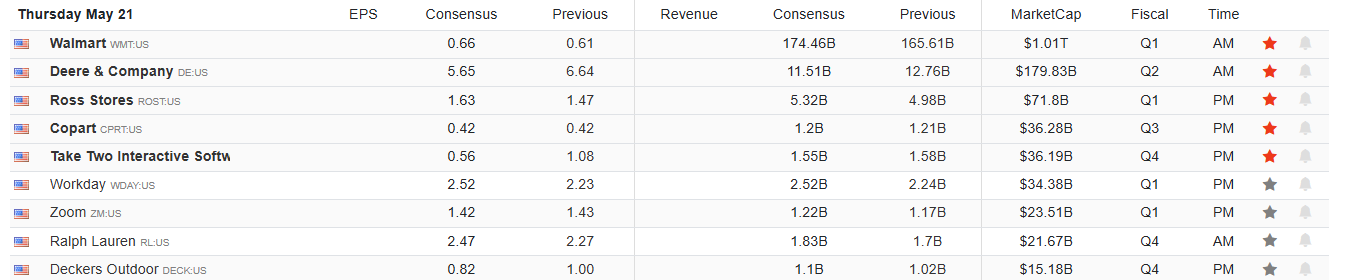
Earnings
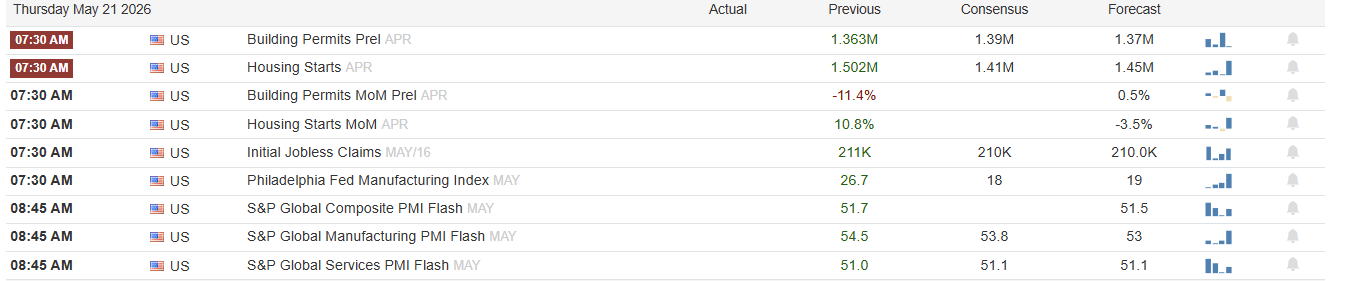
Economy
Market Trading Update
Yesterday, we discussed the potential rotation from semiconductors to software. One of the things we are watching closely is the implied volatility on the S&P 500.
The VIX closed Monday at 18.06. To anyone scanning headline numbers, that reads as a perfectly normal market. Calm. Boring, even. But look one ticker over at the CBOE SKEW Index, last printing at 145.77, and the picture changes entirely. In fact, big money is buying crash insurance. Meanwhile, retail is buying calls. Those two trades sit on opposite sides of the same options book, and somebody is going to be wrong. Of course, the VIX SKEW divergence is the technical signal worth your attention this week, and most of the financial media hasn’t said a word about it.
Look at what’s happening around the equity market this morning. First, the 10-year Treasury yield is sitting at 4.65%, a 16-month high. Then the 30-year has cleared 5.12%, an 18-year high. Meanwhile, oil is running roughly 50% above its pre-Iran-conflict price. Wholesale inflation is also printing near 6%. And CME FedWatch is now pricing roughly a 40% probability of a rate hike by year-end with cuts ruled out entirely for 2026.
Yet the VIX sits at 18. It hasn’t seen 25 in over a month.
That gap between what’s happening in macro and what’s being priced in equity volatility is the setup. We’ve written before about the disconnect between implied and realized volatility in our piece on the VIX and realized volatility gap, and about the bond-market-stock-market disconnect in VIX and MOVE: A Tale Of Two Markets. This week is the cleanest version of those tensions we’ve seen in a while.
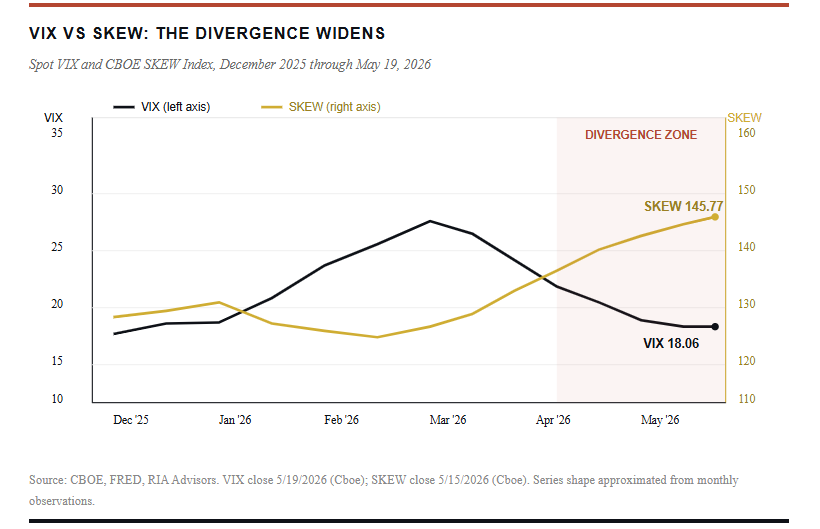
Here’s what the data actually says. The VIX measures expected 30-day volatility around the at-the-money S&P 500 options. In contrast, SKEW measures the price of way-out-of-the-money S&P 500 puts. When SKEW rises, somebody is paying up for tail-risk insurance against a “black swan” move. Importantly, the current SKEW print of 145.77 sits within shouting distance of all-time highs and runs well above the long-term median of around 118.
Now overlay the CBOE equity put/call ratio. The last reading was 0.56. That’s the lower end of the historical range. Retail and small-options traders are buying calls, not puts. They’re long the rally. So who’s buying the tail puts? Institutional desks. Specifically, the same ones that have been net sellers into strength for the better part of two months. The bid for SKEW is coming from somebody who actually has to manage downside risk, and the equity put/call tells you it isn’t the crowd chasing NVDA into another all-time high.
There’s one more piece of this setup that gets overlooked. The VIX futures term structure is in contango, which is the normal state for volatility roughly 80% of the time. What’s not normal is how flat that contango has gotten. The VX6/VX1 ratio (six-month VIX future divided by the front month) is currently around 1.06, against a long-run average between 1.15 and 1.20. Compressed contango is the volatility market’s version of a yield curve flattening. It tells you traders aren’t willing to pay much more for protection six months out than they are for protection next month. That isn’t because they think six months from now is calm. It’s because they think next month might not be either.
Notably, backwardation, where front-month VIX futures trade above longer-dated, has preceded 21 of the last 22 S&P 500 drawdowns of 5% or more since 2004. We aren’t in backwardation yet, but we are one bad print away from it.

A flip below 1.0 in the VX2/VX1 spread, a 9-day VIX moving above the 30-day VIX, or the equity put/call’s 10-day moving average pushing back above 0.7 would each tell us the rotation in positioning is starting. Any one of them in isolation is a flag. Two together, and we’d treat it as confirmation.
I’m not suggesting that you should short the market here. Picking tops on momentum-driven rallies is the fastest way to underperform. What I am saying is that protection is cheap, and the people who have to be right about the downside are buying it. With the VIX at 18, the cost of using listed options to hedge a long-only equity book is a fraction of what it’ll be on the day the SKEW finally translates into a spot VIX print.
If you’ve been waiting for the right moment to add tail-risk hedges, monetize gains in your most stretched positions, or rebalance toward bonds with the 10-year yielding 4.65%, the VIX SKEW divergence gives you the setup. The options market smart money is hedging, and the VIX is the only thing keeping the party going. The VIX also has a habit of not staying low when the rest of the building is on fire.

ADP Points To A Weak But Improving Labor Market
On October 28, 2025, ADP began posting weekly payroll reports based on its clients’ data. Prior to weekly reporting, ADP posted a monthly labor market gauge days before the monthly BLS employment report. ADP’s new weekly report presents the data as a rolling four-week moving average, which tends to smooth weekly variability.
As we share below, courtesy of Bloomberg, the ADP weekly gauge shows a pickup in job growth over the last two months. While positive, the rolling four-week moving average is only around 40k, well below what is considered a healthy job market with growth of 150k to 200k jobs per month. The recent pickup is encouraging, but continues to indicate that the unemployment rate should increase.
This private sector market report on labor conditions is the only widely accessible way to assess the labor market in near real time.

The AI Economy: Looking Beyond The Facade- Part 1
The US economy’s curb appeal looks great. Consider that gasoline prices are nearly $5, crude oil is trading above $100, consumer sentiment is at historically low levels, and mortgage and other interest rates have remained relatively high. Yet, despite the worrisome headwinds, the US consumer-driven economy continues to expand. However, as with a house’s curb appeal, it’s not just the headline data that defines an economy. Equally important is its supporting structure. Let’s open the door to our economy to better appreciate how AI is currently impacting it and how it may change in the future.
The question we explore here is whether the AI investment boom is genuinely broadening this country’s economic footing or weakening the labor force, the foundation of the economy.

Tweet of the Day

“Want to achieve better long-term success in managing your portfolio? Here are our 15-trading rules for managing market risks.”
Please subscribe to the daily commentary to receive these updates every morning before the opening bell.
If you found this blog useful, please send it to someone else, share it on social media, or contact us to set up a meeting.

