
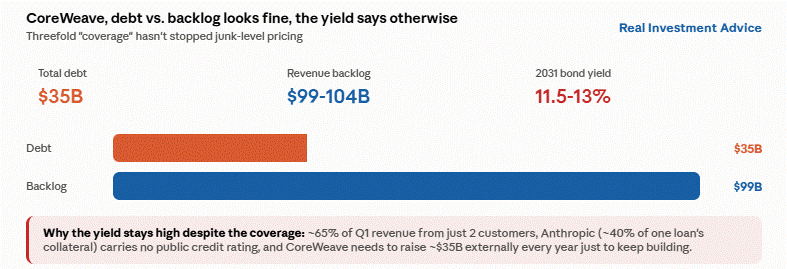
CoreWeave, which rents GPU computing capacity to AI labs and hyperscalers, sits at the heart of a circular financing story that worries some investors. CoreWeave’s total debt sits at $35 billion as of June 30, up sharply from $21 billion at year-end 2025. Further, interest expense hit $640 million last quarter, accounting for more than 25% of its revenue. Against that debt load sits a revenue backlog of approximately $100 billion, consisting mostly of take-or-pay contracts (buyer must pay whether they use the service) with Meta, OpenAI, Microsoft, and Anthropic. On paper, that is roughly threefold debt coverage. Yet CoreWeave’s 5-year bonds yield nearly 13%.
Bond markets aren’t doubting the authenticity of the backlog contracts. Three narrower concerns likely explain the high yield.
- Concentration risk. Per Fitch, 65% of Q1 revenue came from just two customers, and one of them, Anthropic, is not rated.
- Timing mismatch. Bond interest is due now while backlog revenue only becomes cash when data center capacity comes online over several years.
- Capex is immense. Its capex-to-operating-income ratio runs near 35-to-1, meaning CoreWeave must borrow about $35 billion every year to keep building capacity to fulfill its revenue backlog.
The revenue backlog helps secure financing for already built data centers, but not for new ones. This leaves us with an important question: Will Nvidia, AI labs, and the hyperscalers continue to help finance the data center buildout needed for CoreWeave to recognize the $100 billion in commitments, or will CoreWeave be left to the whims of the bond market? The answer could greatly impact investor sentiment for the AI industry.
What To Watch Today
Earnings

Economy
Market Trading Update
On Wednesday, we flagged compressed volatility as a spring wound tight. Then yesterday, we discussed what tends to perform best in September. Today, let’s look at what correlations and market breadth say underneath the index, because they tell a very different story than the headline level.
Let’s start with the actual tape. The S&P 500 closed Wednesday at 7,668, just 0.7% above where it closed on June 2 at 7,612. Three months, no progress. Yet the equal-weight S&P is up 4.1% over that same stretch. That isn’t broadening. That’s money sloshing out of Tech and AI into cyclicals and value while the index stands still. BTIG’s Jonathan Krinsky calls it a game of “musical chairs,” and the breadth data backs him up. The percent of Russell 3000 names above their 50-day average has fallen to 42%, the lowest since early April, and the percent above the 200-day average peaked in mid-August and has started rolling over.

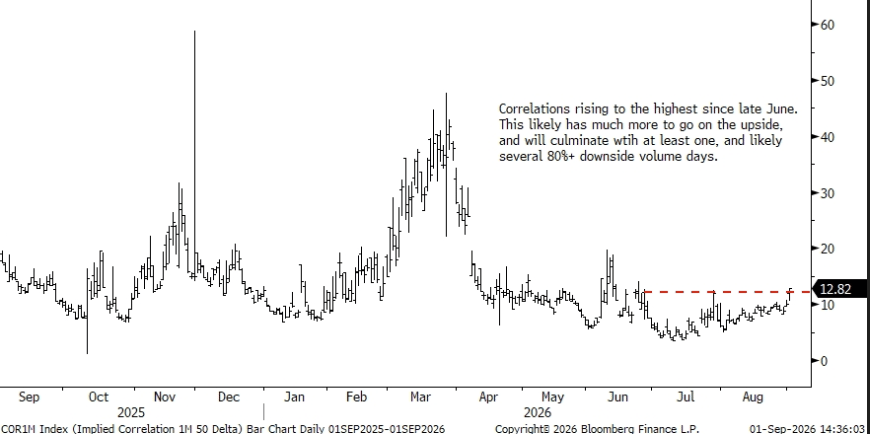
Here’s where it gets interesting. One-month implied correlation just hit its highest reading since late June. Rotation and rising correlation are opposites. When money rotates, correlation falls, because something works while something else doesn’t. When correlation rises, the chairs stop getting handed off, and everything falls together. The absolute level near 13 is still low, so this is early, NOT late. But Bob Farrell’s Rule #7 covers the ground: markets are strongest when broad and weakest when narrow.
The cyclical side is already cracking. Industrials (XLI) closed Wednesday at $172.78, about 4.8% below the 50-day average and only 1.3% above the 200-day. Transports (IYT) dropped 4.5% in five sessions. The names that grabbed the chairs in July are handing them back.
What’s missing is the flush. NYSE downside volume has run near 63%-65%, nowhere near the 80% day that marks real capitulation, and we haven’t seen one since last October. The average year delivers 21. There has never been a year with fewer than five. The 5-day put/call average sits at 0.82, one of the lowest readings in years. Complacency is still the crowded trade.

So the roadmap is clean. 7,600 is the breakout line, less than 1% under Wednesday’s close, with the 50-day at 7,570 right behind it. Lose both, and the next real support is the 200-day at 7,127. Notice that Krinsky’s 7,200 to 7,300 downside target, roughly 7% off the August 13 record close near 7,799, lands within about 1% of that trend line. The bear case and the moving average are the same number.
Keep doing the risk management work while the tape is still orderly. Raise quality, hold the cash buffer, and manage risk at 7,600 instead of after it breaks.

Today’s Job Report Could Decide The Rate Hike Debate
Today’s August employment report could be the linchpin deciding whether the Fed hikes rates at its September 16 meeting. After Warsh’s hawkish Jackson Hole remarks, it’s quite possible that a strong jobs report could push Warsh to support a hike. At the same time, another weak report and the possibility of another benign CPI report next Friday could even flip the narrative toward rate cuts.
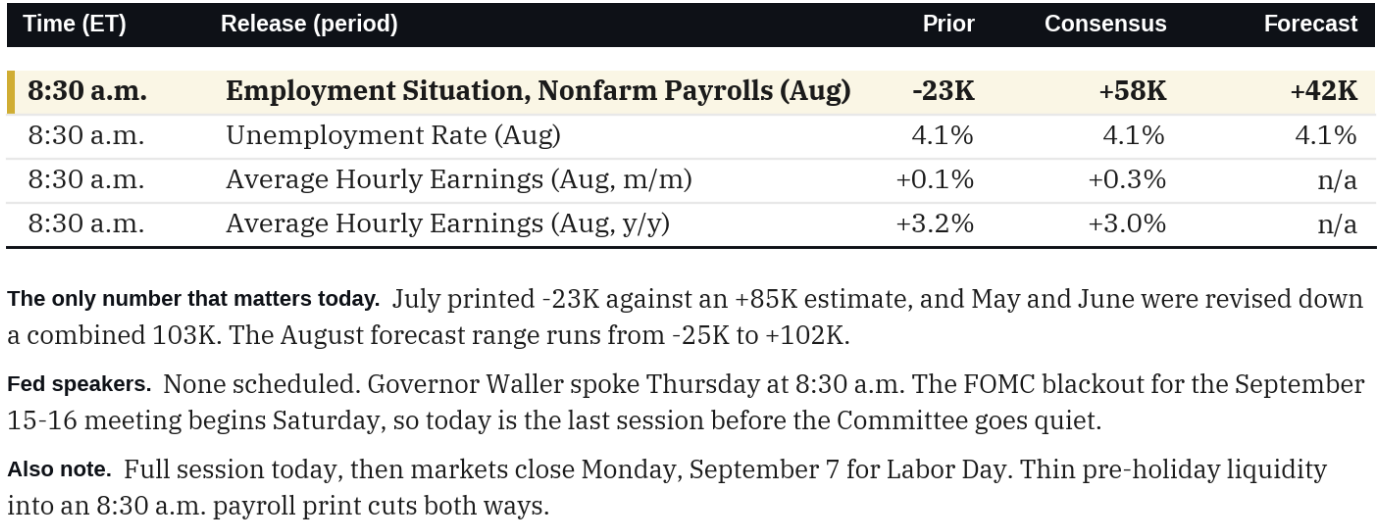
As a backdrop for today’s BLS report, July payrolls fell 23,000, with May and June revised down by a combined 103,000. The unemployment rate fell to 4.1%, its lowest in two years, but for the wrong reasons: labor force participation shrank by 264,000 and household employment fell by 87,000. Outside of COVID, the participation rate (61.4%) is the lowest since the mid-1970s. A benchmark revision on August 28 reduced total payrolls by another 79,000 through March. Over the last five years, the economy has created 201k jobs per month on average. Over the last six months, that has slowed considerably to 44k.
The Wall Street consensus expects a rebound to roughly 55,000 jobs, with unemployment holding at 4.1%. The range of plausible outcomes remains wide and, further confusing, we have seen large revisions over the past few months erase what was initially a good reading.


Tweet of the Day

New UPDATED Trading Rules With Desktop Printout
“Want to achieve better long-term success in managing your portfolio? Here are our 15-trading rules for managing market risks.”
Please subscribe to the daily commentary to receive these updates every morning before the opening bell.
If you found this blog useful, please send it to someone else, share it on social media, or contact us to set up a meeting.