
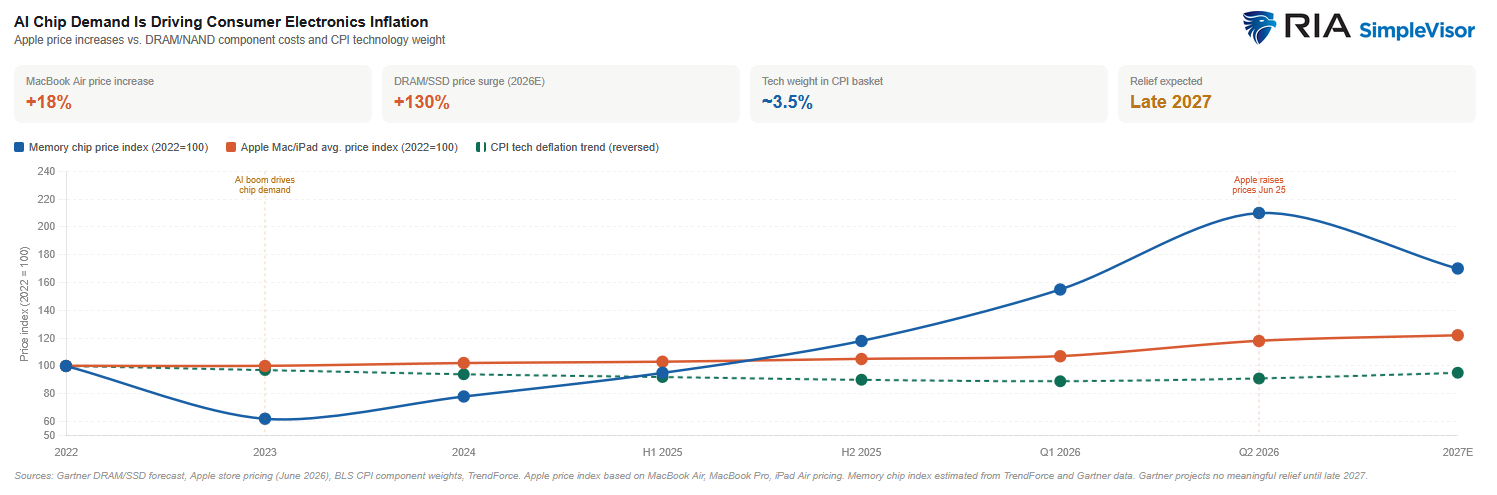
Last week, Apple raised prices on certain products, citing rising costs of AI memory chips. In a statement to Reuters, the company said it had “never seen a component price increase this much, this quickly” and further that it had been shielding customers from higher costs until now. There is a global shortage of memory and storage chips driven by AI data centers buying up DRAM and NAND capacity. As a consequence, Apple is increasing the MacBook Air price to $1,299 from $1,099, the MacBook Pro to $1,999 from $1,699, and the iPad Air to $749 from $599. Prices of other Apple products will also increase.
Apple is not alone. Dell raised prices roughly 15% to 20% in late 2025, Lenovo followed in January 2026, and HP, Acer, and ASUS warned of increases. All of them blame the same AI-related memory crunch.
The inflation implication is worth better appreciating. The CPI’s information technology category, including computers, smartphones, and peripherals, has been a persistent deflationary force for decades. That tailwind is now slowing and possibly reversing. From a Fed perspective, it’s worth noting that higher interest rates cool demand-related inflation but have a much smaller impact on supply-side inflation driven by a shortage of AI memory chips. However, if consumers and businesses are paying more for technology products, they will have less money to spend on other products. The reallocation of spending may offset some of the inflation in AI memory chips. Time, too, will solve the problem, as both new and existing AI memory chip producers are heavily incentivized to meet the insatiable demand.
What To Watch Today
Earnings

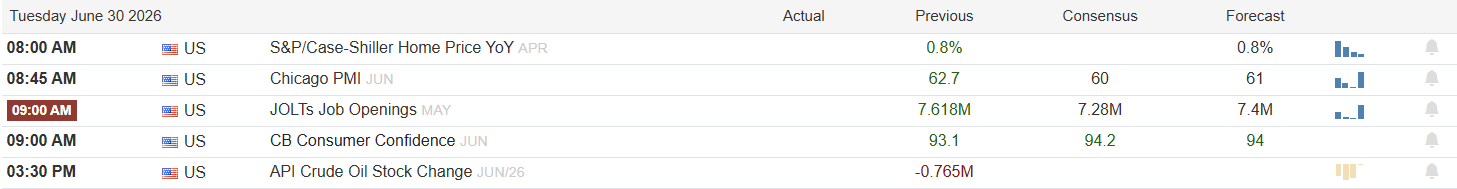
Economy
Market Trading Update
Yesterday, we addressed the technical market backdrop heading into the week and completed our switch from value to growth across all our models. I want to discuss that a bit further today.
Let’s start with the fact that the Magnificent 7 (Mag 7) just had an ugly month. Every one of the seven is down at least 8% in June, and the Roundhill Mag 7 ETF (MAGS) closed Friday at $61.60, roughly 13% below its high and right on the $60 line that BofA’s Michael Hartnett keeps flagging as a risk-off trigger. Money left in size.
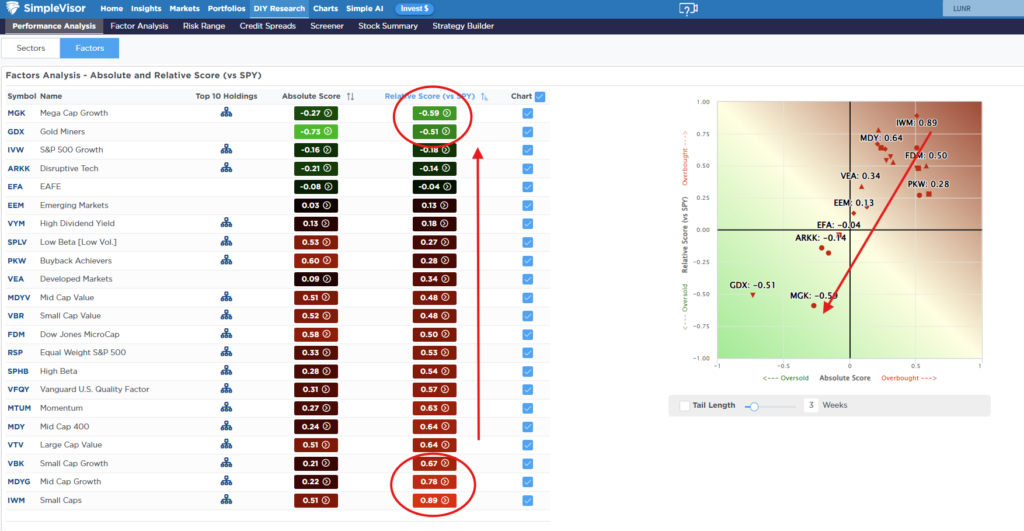
So why did we buy into it? Last Wednesday, our Sector and Factor Rotation model shifted from value toward growth. The trigger wasn’t a hunch. As we discussed in this past weekend’s Bull Bear Report, the model flipped because mega-cap growth has been the biggest laggard this month, and that weakness reversed much of its early-quarter lead. To wit:
“Start with where the factors sit on our SimpleVisor screen. MGK, our growth proxy, has fallen to a relative score of minus 0.59. That is the most oversold corner of the entire large-cap market, and it is oversold against both value (plus 0.65) and momentum (plus 0.73), which are each stretched. This isn’t subtle. The crowd has spent six months selling the biggest names and crowding into everything else.”
We think most of the damage is mechanical, not fundamental. Capex worries are real, and we’ll dig into that math this weekend in the next Bull Bear Report. But layered on top was a liquidation to chase the momentum in semiconductors and memory, where names like Micron and Marvell more than doubled this year before cracking last week. Add the buyback blackout heading into quarter-end, plus the institutional rebalancing after the rally that followed the Iran crisis, and you get forced selling into thin support. None of that says the businesses broke.
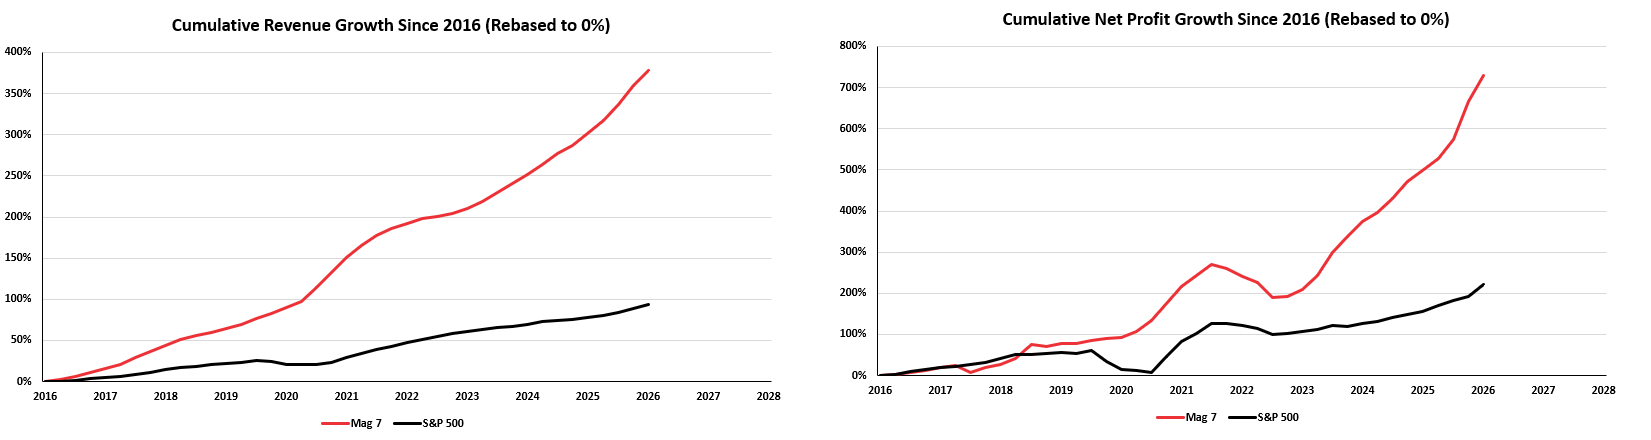
Look at the revenue picture. Since 2016, Mag 7 sales have grown by close to 375%, compared with roughly 95% for the S&P 500, and reported profit growth has outpaced the index by an even wider margin. A three-week, flow-driven drawdown does not undo that. Has the selloff “fixed” the spending debate? No. Make no mistake: a 13% price reset does not resolve questions about free cash flow and the return on hundreds of billions in spending. But it takes a lot of froth out of the trade and sets up a counter-rotation. As Bob Farrell warned, excesses in one direction tend to invite excesses in the other. The crowd rotated hard into chips. The “un-rebalancing” trade rotates some of that back.
Here’s how we’re approaching it. This is a TACTICAL add, not a verdict that the AI capex story is settled. We expect the mega-caps to outperform both value and high-flying hardware names as post-quarter-end flows normalize, and our net equity exposure barely moves with the trade. The exit is defined. If the capex and cash flow concerns we’re watching actually confirm when these companies report Q2 earnings, we sell the positions and do something else. The bottom line is simple. The fundamentals still favor the engines of this market, but we’re treating the bounce as a trade with a stop, not a reason to stop watching the spending.

Quarter-End Rebalancing Trades In Action
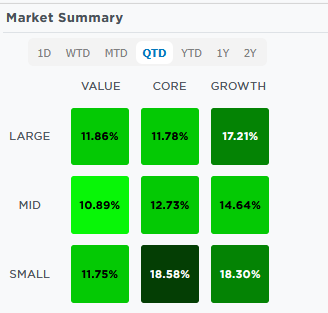
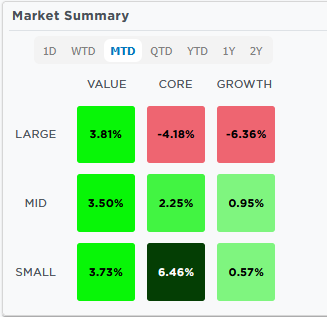
The top two graphics below help illustrate how market breadth has improved over the last few weeks as passive index managers rebalance from stocks that have outperformed the market to those that have underperformed. On a quarter-to-date basis, large-cap growth has beaten large-cap value by over 6%. While this is a meaningful outperformance, consider that over the month of June, large-cap value beat large-cap growth by about 9% and, in the process, closed what was a much larger performance gap. The graph within the third graphic shows how MGK, the mega-cap growth ETF, rotated from very overbought to oversold in three weeks. At the same time, small caps (IWM) and the equal-weighted S&P 500 (RSP) moved into overbought territory.
The risk for investors chasing the new outperformers is that the sharp reversal in fortunes over the last few weeks was likely driven by rebalancing trades. It is common for larger rebalancing actions to reverse themselves once a period-end date has elapsed.
Not shown, but regarding the sectors, we now find that the once laggards, health care, financials, and utilities, are overbought, while technology is back to fair value. It’s important to note that over the last month, mega-cap stocks, which include technology giants like Apple, Nvidia, Google, and Microsoft, gave up 3.75% to the S&P 500. Chip makers beat the index by nearly 7%. Simply, the weakness in technology is from the largest stocks. Thus, we might expect to see those megacap names outperform in the first week of the new quarter, while semiconductor and hardware stocks give up some of the spectacular gains they earned over the last few months.

Record Retail Inflows: Where Is All The Money Coming From?
A couple of weeks ago, I showed Adam Taggart the following chart of record retail levels of household cash as a percentage of total financial assets. This chart is hard to square with the financial media narratives.
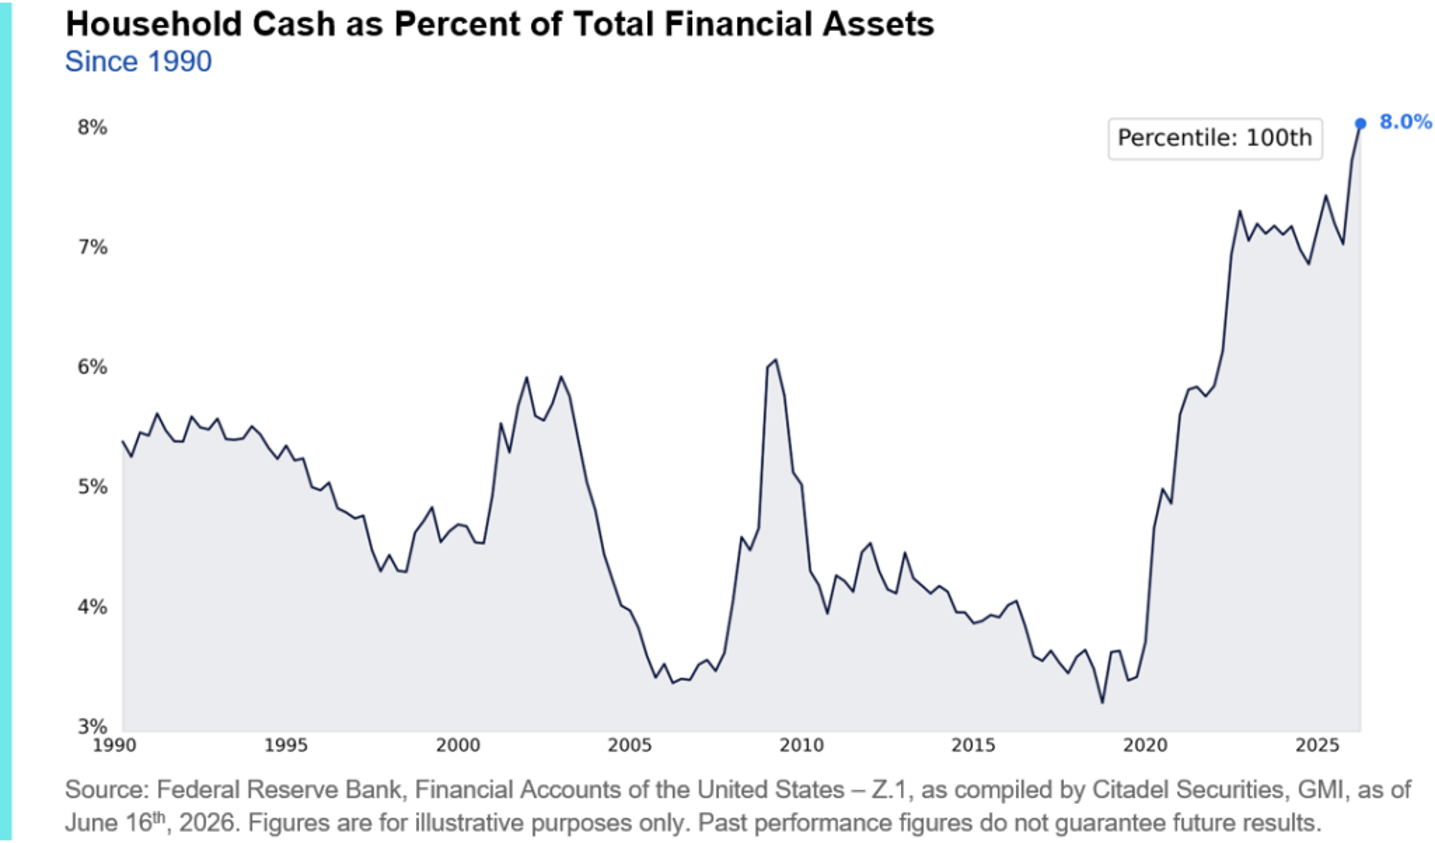
For example, two stories ran side by side this month, and on the surface, they cannot both be true. In the first, a resurfaced clip of Kevin O’Leary scolding young workers for buying $28 lunches went viral, and the replies were filled with people explaining they’re broke, locked out of housing, and finished apologizing for a coffee.6 In the second, record retail inflows poured into stocks, options, and ETFs at a pace Wall Street has never logged.5
So which is it? Are Americans drowning, or are they buying every dip with both hands? The uncomfortable answer is both. And the space between those two facts tells you almost everything you need to know about this market.

Tweet of the Day

New UPDATED Trading Rules With Desktop Printout
“Want to achieve better long-term success in managing your portfolio? Here are our 15-trading rules for managing market risks.”
Please subscribe to the daily commentary to receive these updates every morning before the opening bell.
If you found this blog useful, please send it to someone else, share it on social media, or contact us to set up a meeting.

