


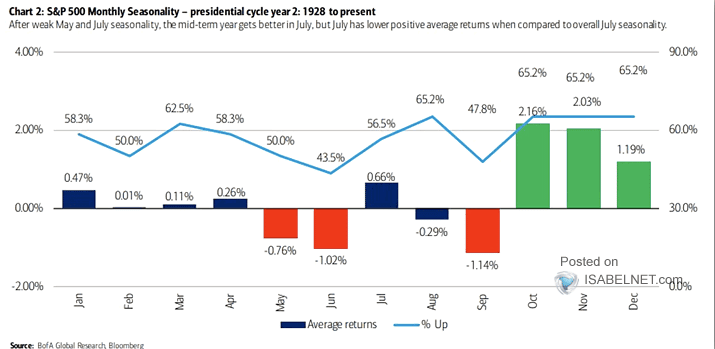
This past quarter (Q3), investors took their lumps. However, seasonality analysis points to a positive Q4. The graph below shows that during the mid-term of past Presidential cycles, as we are in, S&P 500 average returns are the highest in the fourth quarter. Two thirds of the time, Q4 returns are positive, easily beating any other quarter. As we have recently highlighted, via bearish sentiment and record put options trading, sentiment is washed out. Heavy volatility in the final week of Q3 was likely related to quarter-end posturing by investment professionals. Often such “window dressing” reverses in the next quarter. Given the technically oversold market and weak sentiment, a bounce to start Q4 would not be surprising. The bigger question for Q4 is how the Fed, inflation, the dollar, mid-term elections, and geopolitics affect stock prices.

What To Watch Today
Economy
- 9:45 a.m. ET: S&P Global U.S. Manufacturing PMI, September final (51.8 expected, 51.8 prior)
- 10:00 a.m. ET: Construction Spending, month-over-month, August (-0.2% expected, -0.4% prior)
- 10:00 a.m. ET: ISM Manufacturing, September (52.1 expected, 52.8 prior)
- 10:00 a.m. ET: ISM Prices Paid, September (52.0 expected, 52.5 prior)
- 10:00 a.m. ET: ISM New Orders, September (50.5 expected, 51.3 prior)
- 10:00 a.m. ET: ISM Employment, September (53.0 expected, 54.2 prior)
- WARDS Total Vehicle Sales, September (13.50 million expected, 13.18 million prior)
Earnings
- No earnings releases today
Market Trading Update
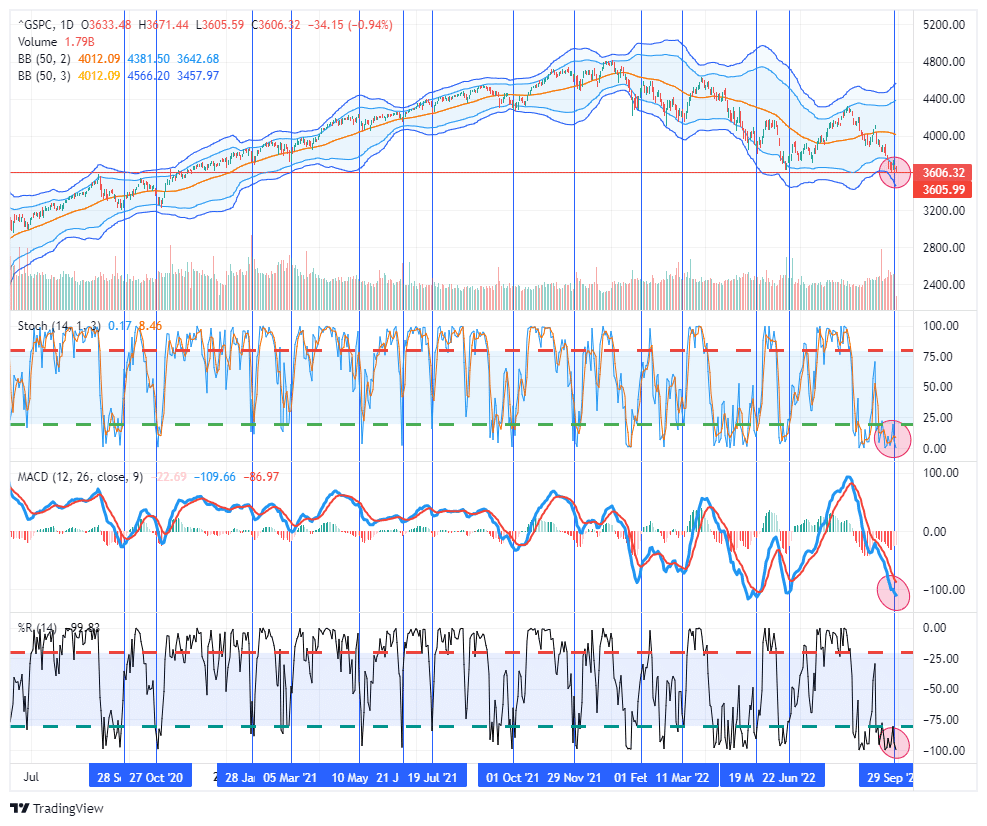
On Friday, the market took out the June lows but is testing support going back to the peaks in 2020. As noted, every technical indicator is now screaming oversold. As shown by the vertical lines, when the market had previously hit such lows across indicators, such was typically near a short-term bottom. We suspect that as we enter into October, we could see a more sustainable reflexive rally to roughly 3850 on the S&P 500. Investors should continue to use such rallies to raise cash and rebalance risk accordingly.
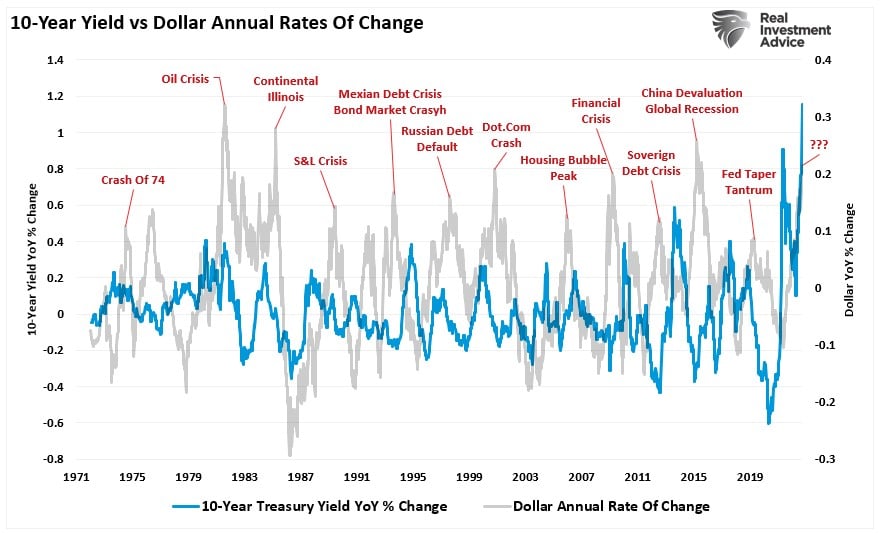
So far, the Federal Reserve has remained blessed with a very stable market environment. However, on Wednesday, the Bank of England started buying bonds as the U.K. pension system faced potential insolvency from surging margin calls. Investors should not overlook the importance of those actions. Such was the subject of an article I wrote for MarketWatch. The crux of the article was the combined impact of tighter monetary policy combined with a surging dollar and rates was the recipe for “financial instability.”
“Furthermore, the surge in the dollar, driven by higher rates, accompanied the sharpest increase in interest rates in history. That’s problematic, particularly in heavily indebted economies, as debt-servicing requirements and borrowing costs surge. Interest rates alone can destabilize an economy, but when combined with a surging dollar and inflation, the risks of market instability increase markedly.”
The risk of market instability is rising, as seen in the volatility spike this past week. While that volatility spike remains subdued, it has reached the warning zone, suggesting something may be near breaking in the markets.
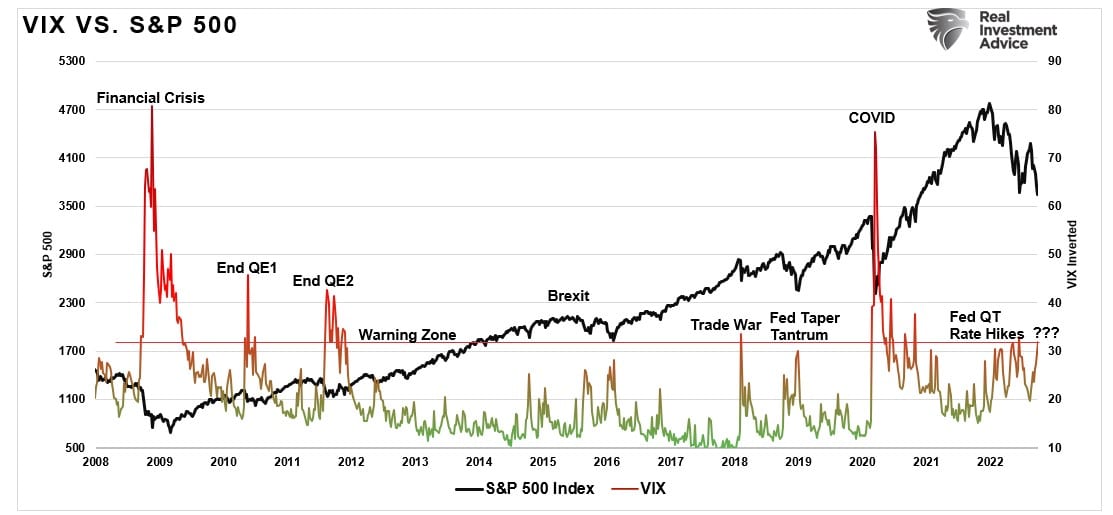
We will continue to watch volatility closely. In the meantime, both markets and sentiment are at such bearish levels the risk-reward is now favorable for traders.
The Week Ahead
The week starts off with the ISM manufacturing survey. Like most surveys, the inflation and employment subcomponents will be the most important to watch. Analysts expect ISM prices to fall from 52.5 to 51 and employment to remain stable at 54. Tuesday, Wednesday, Thursday, and Friday offer important updates on the labor markets. Tuesday’s JOLTs reading provides an update on job openings and the tight labor market. Thursday’s jobless claims number sheds more light on people being let go from jobs. Claims are worth following as they tend to lead to other employment data. ADP on Wednesday and the BLS labor report on Friday will be the most followed labor data. Analysts expect 290k jobs, leaving the unemployment rate at 3.7%.
Q4 corporate earnings season starts this week; however, there will be no reports of substance. Because of those coming earnings reports, most corporations are in “blackout periods” and can’t buy back their own stock. There are also a plethora of Fed speakers this week. Be alert for financial instability concerns and how that might affect monetary policy.
Bonds are Historically Cheap
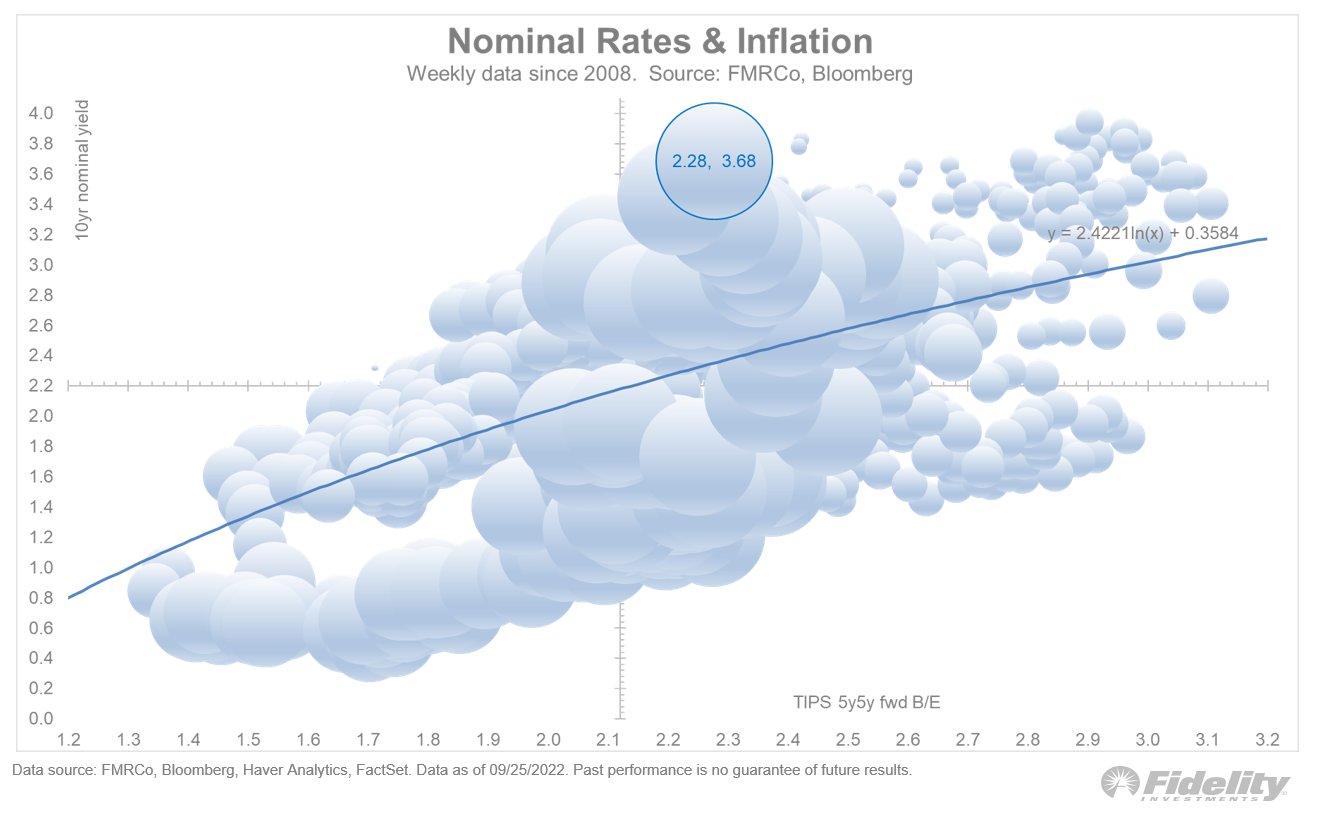
The scatter plot below from Fidelity plots weekly levels of the ten-year UST yield and 5×5 inflation expectations. 5×5 inflation expectations is the implied five-year inflation rate bond traders expect five years from now. The current 5×5 rate is 2.28%. As a comparison, the next five-year implied inflation rate is 2.18%. The graph shows the current ten-year yield of 3.68% is 1.33% above the 2.35% trend line rate.
We took the analysis a step further and compared the ten-year rate to the five-year implied inflation rate average and the 5×5 inflation rate. This method captures yields versus the full ten-year of inflation expectations. Since 2010, on average, the Treasury note was 0.21% above the aggregate expected inflation rate. Currently, it is 1.40% above it. Both methods show that bond yields are over 1% too high based on inflation expectations. Bottom line: bonds are a buy, but there are many financial undercurrents, such as the U.K. pension fund selling, that are unpredictable and, in some cases, unknown. These events can create significant volatility and temporarily increase yields further.
PCE Inflation
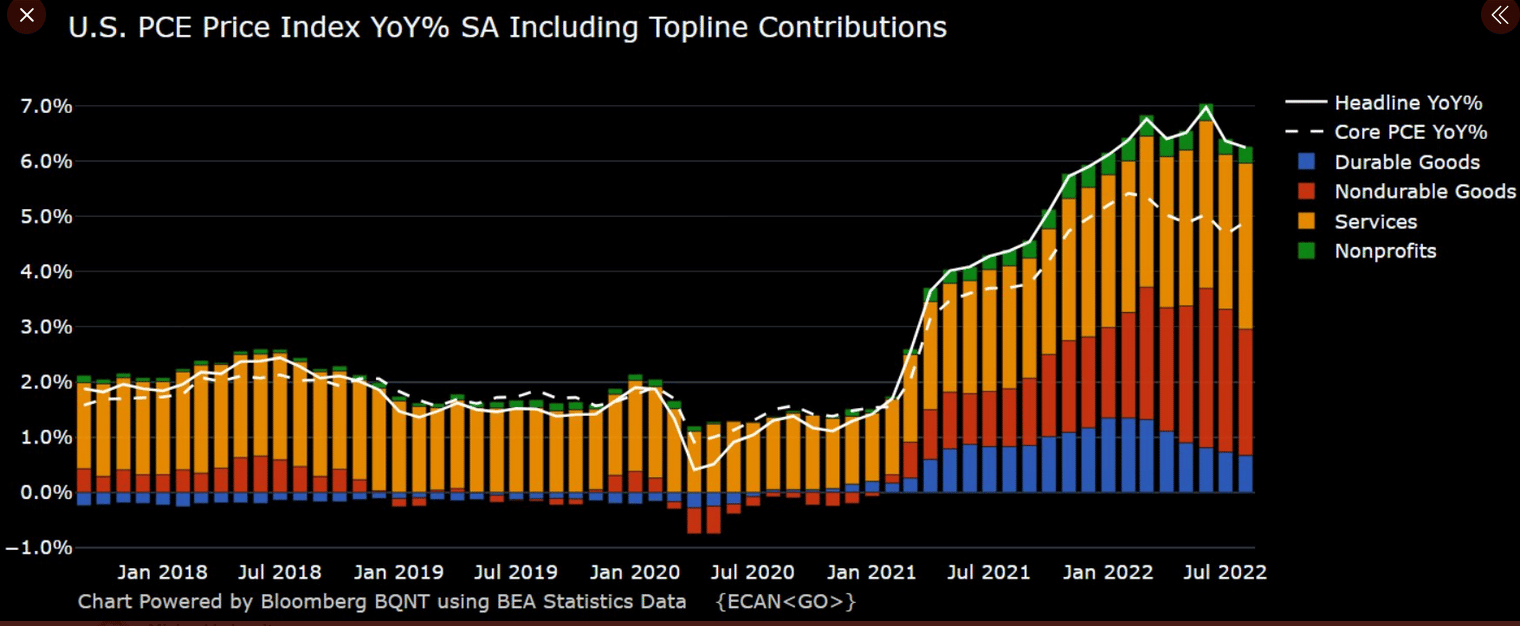
The financial media closely follows and reports on CPI inflation data. However, the Personal Consumption Expenditures (PCE) Price Index is the Fed’s preferred inflation gauge. Friday’s headline PCE price index met expectations for an increase of 0.3%. Stripping out food and energy, the core PCE rose 0.6%, 0.1% more than expectations. Zacks Research offers the following commentary:
The main aspect of these figures market participants pay closer attention to are the year over year numbers: +6.2% for the PCE Price Index, down 20 bps from July. Core year over year reached +4.9%, 20 bps above consensus and the upwardly revised previous month read. This suggests “transitory” inflation metrics have somewhat been absorbed into the stickier parts of the economy, making inflation more difficult to tame.
That said, +4.9% on core, while still historically high, is well below the +6.8% we saw in June of this year, which was the highest print we’d seen since Ronald Reagan’s first year as President. What we would rather see, of course, is these numbers come down on core as well as headline to have a better grasp of controlling overall inflation metrics. Clearly this is still a work in progress.
Tweet of the Day
Please subscribe to the daily commentary to receive these updates every morning before the opening bell.
If you found this blog useful, please send it to someone else, share it on social media, or contact us to set up a meeting.
Also Read


