


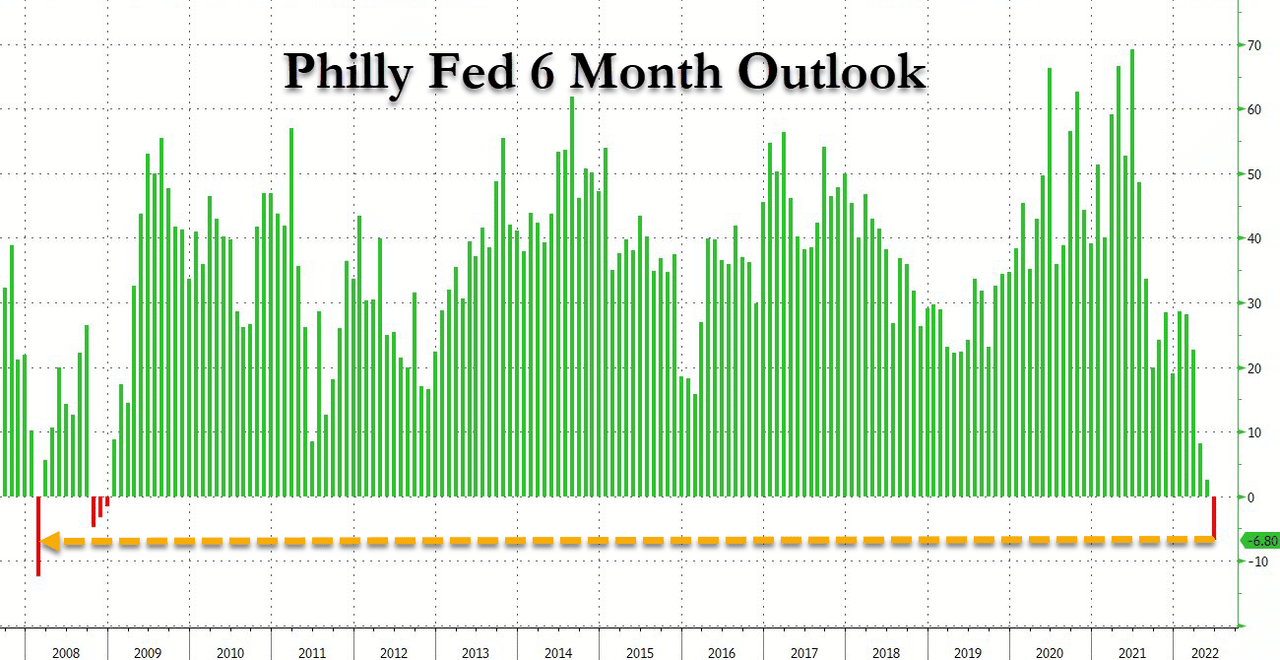
On Wednesday, the Atlanta Fed revised its Q2 growth estimate to 0.0%. Yesterday, the Philadelphia Fed Index fell into economic contraction territory. It was the first time since 2020 that the Fed’s survey of Philadelphia area manufacturers contracted. More concerning is the outlook. The six-month Philadelphia Fed outlook, shown below, fell below zero for the first time since 2008. Driving the dour outlook in the Philadelphia Fed survey is new orders which fell sharply to -12.4, and future shipments, which fell 29 points to 3.6. As a result, the future employment index fell from 29.5 to 10.5. While employment is still positive, manufacturers are bracing for a slowdown.
We would like to believe Powell’s sentiment that “there is no sign of a broader slowdown in the economy,” still, the reality is that many real-time measures of economic activity, like the Philadelphia Fed report, signal an abrupt slowdown and possible recession.

What To Watch Today
Economy
- Industrial Production, month-over-month, May (0.4% expected, 1.1% prior)
- Capacity Utilization, May (79.3% expected, 79.0% prior)
- Manufacturing (SIC) Production, May (0.2% expected, 0.8% prior)
- Leading Index, May (-0.4% expected -0.3% prior)
Earnings
Pre-market
- No notable reports are set for release.
Post-market
- No notable reports are set for release.
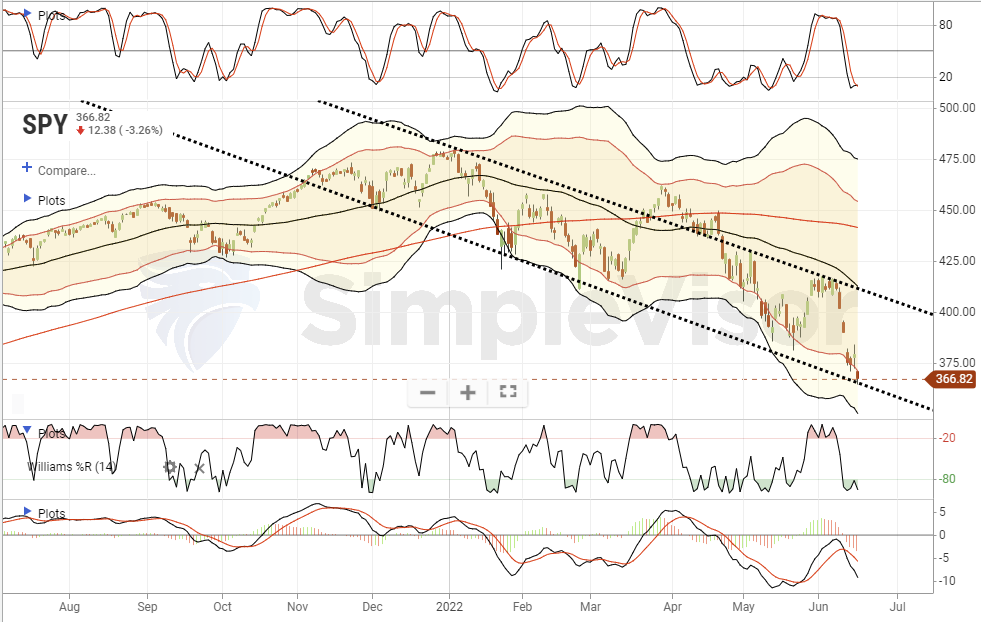
Market Trading Update – Market Calls Fed’s Bluff
While Jerome Powell may see no recession on the horizon, the Philadelphia Fed index, and the market all disagreed. Yesterday, the market sold off sharply across sectors as the risk of a recession is rising sharply as the Fed hikes rates.
As shown, the market is deeply oversold on a short-term basis and is trading at the bottom of the current downtrend range. Following today’s massive options expiry, I would not be surprised to see a bounce. However, while that bounce could be fairly strong, I would expect it to fade at roughly 4000 on the S&P 500 as trapped longs look for their next exit.
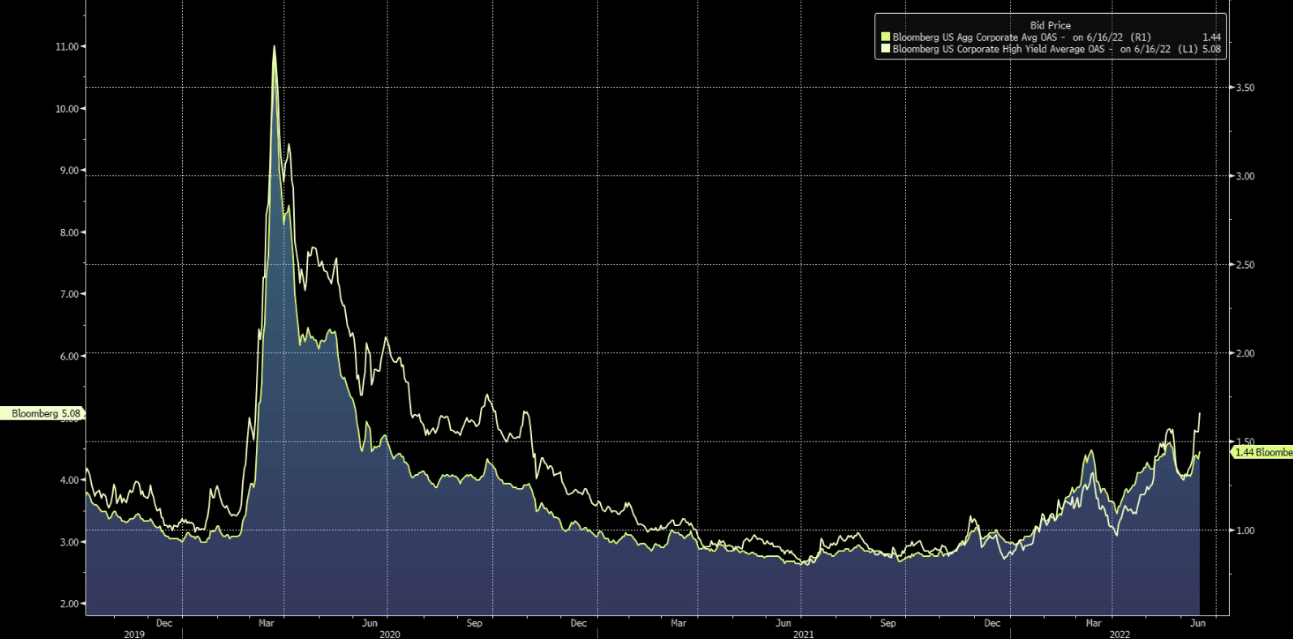
The Fed May, Or May Not, Have Your Back
US high yield spreads closed above 500bps for the first time since late 2020 when it was on the way down. The last time it closed above in a broader uptrend was 28 February 2020. Remember that there is a lot of oil in here, so very different macro backdrop vs 2020. – MarketEar
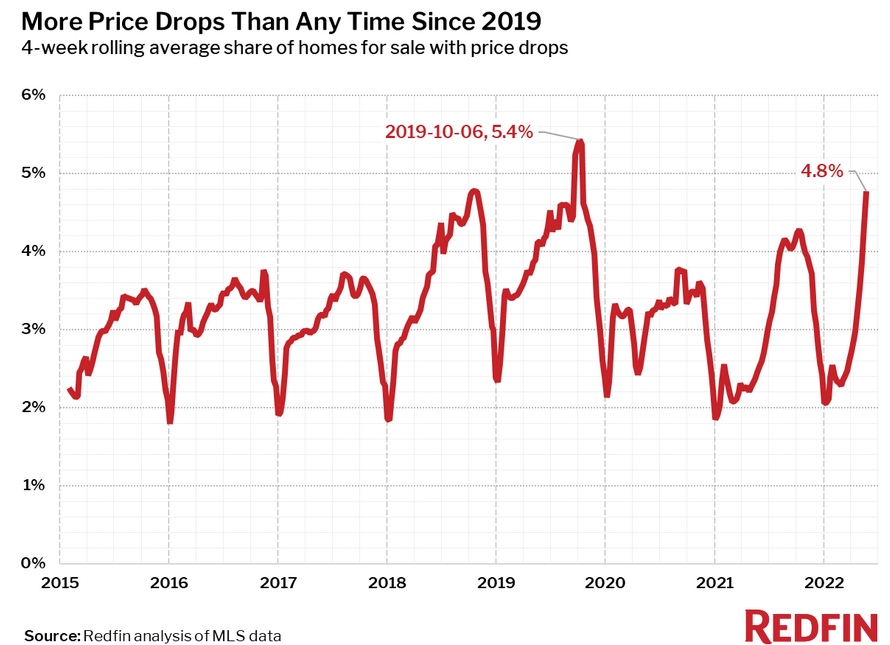
Higher Mortgage Rates Are Beginning to Take a Toll on Housing
The graph below from Redfin shows that home sellers are reducing prices at the fastest pace since 2019. The data below is rolling, which can skew the result. Per Redfin:
The housing market is sending clearer signals that the pandemic-driven housing frenzy is coming to an end. Nearly one in five (19.1%) home sellers dropped their price during the four week period ending May 22—the highest level since October 2019.
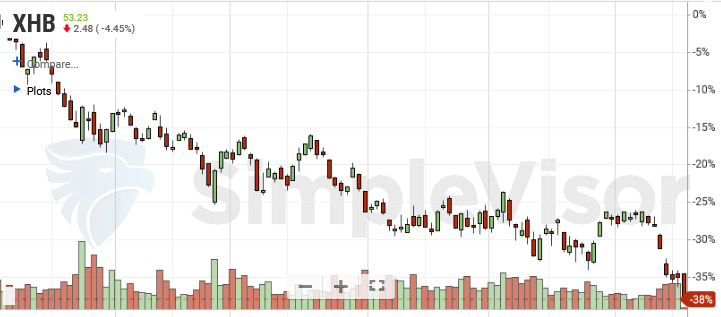
Housing Starts and Building Permits data released yesterday further confirm Redfin’s views. Housing starts in May fell 14.4% after rising 5.5% in April. Building permits dropped 7% following a 3.2% decline in April. Investors seem to be pricing in a poor outlook for homebuilders. The Home Builder ETF XHB is down 38% this year, about twice as much as the S&P 500.
6.00% mortgages are taking a toll on the robust housing market. While we can see home price reductions and houses sitting on the market today, it will take a few months for this data to feed through to official measures of home sales activity and home prices. Over a third of CPI and about 15% of GDP is based on housing.
Optimism from TPA Analytics
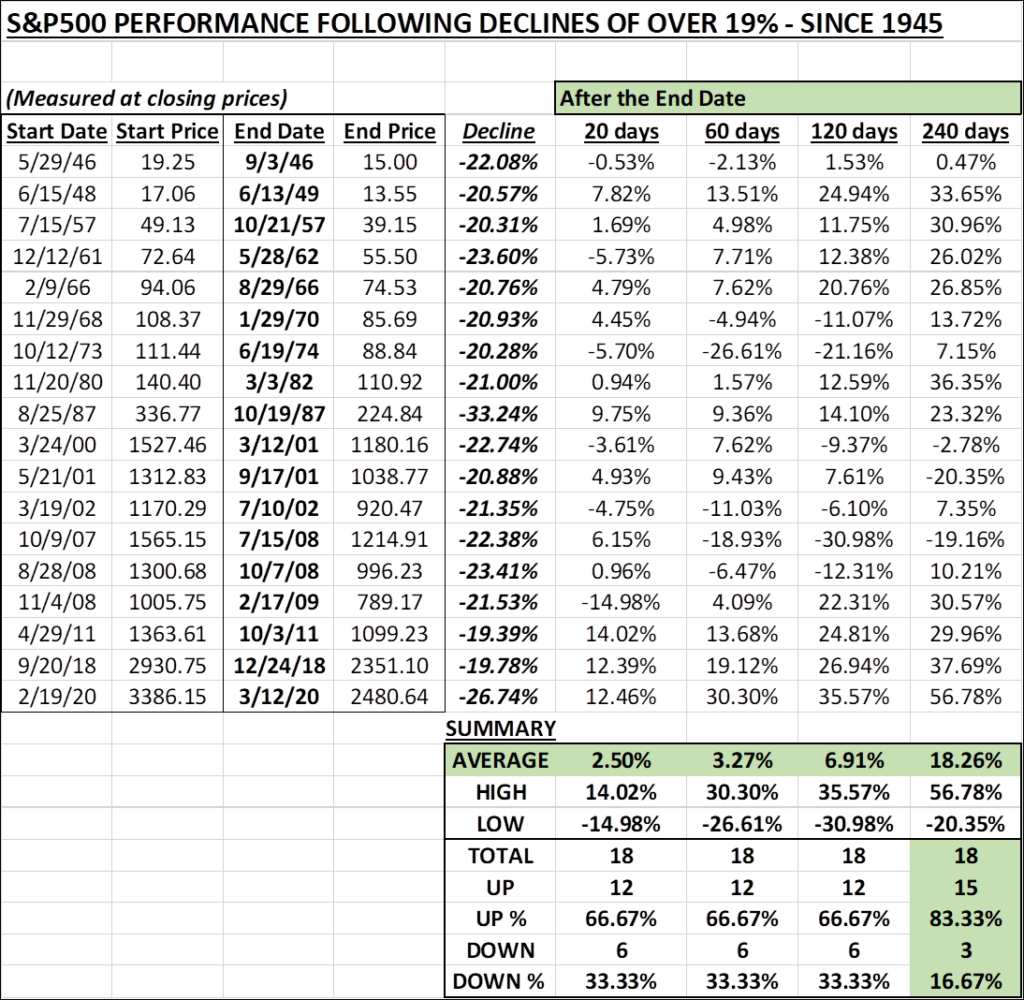
Our colleague Jeffery Marcus from TPA Analytics penned the following research. He notes that since 1945, market declines of over 19% are buying opportunities.
To find a roadmap for going forward, TPA looked back over the past 77 years or since World War II to see what happened after previous bear markets. After some initial research, we broadened our scope to include an additional 2 occurrences in 2011 and 2018, in which the declines were a fraction shy of the normally required -20% (2011 -19.39% and 2018 -19.78%). TPA found that, although in some cases it required some grit to see it through, in an overwhelming majority of cases, buying after bear market declines rewarded investors 1 year out.
His table below with the “bear market” instances shows that there have only been two bear markets in which a 19%+ decline was not met with gains over the next year. Those two instances were 2001 and 2007, the last two recessions.
What Drives Gasoline Prices?
The illustration below from the Visual Capitalist highlights the four main drivers of gasoline prices. As they share, slightly over half of the gas price is a function of the price of crude oil. The remaining influences are divided equally between taxes, distribution & marketing, and refining costs. Taxing oil producers or asking refiners to limit profits will only have a limited effect on capping gas prices.

Please subscribe to the daily commentary to receive these updates every morning before the opening bell.
If you found this blog useful, please send it to someone else, share it on social media, or contact us to set up a meeting.
Also Read


